Define species-area relationship. What is the significance of the slope of regression ? Show with the help of a graph .
Step-by-Step Solution
1. Definition of Species-Area Relationship:
The species-area relationship is a principle that describes how the number of species (species richness) in a given area increases with the area size. This concept was introduced by the German naturalist and geographer Alexander von Humboldt. He proposed that as the area explored increases, the richness of species also increases, but only up to a certain limit.
2. Graphical Representation:
To illustrate the species-area relationship, we can create a graph:
- X-axis: Represents the area (A).
- Y-axis: Represents species richness (S).
- The relationship can be depicted on a logarithmic scale, where the equation is given by:
logS=logC+ZlogA
Here, S is species richness, C is a constant (the y-intercept), A is the area, and Z is the slope of the line (regression coefficient).
3. Understanding the Slope (Z):
The slope (Z) of the regression line in the species-area relationship graph is significant because it indicates how species richness changes with area. A higher value of Z suggests that species richness increases more rapidly with an increase in area, while a lower value indicates a slower increase.
4. Significance of the Slope:
The significance of the slope (Z) can be summarized as follows:
- It indicates that species richness decreases when the area decreases. This means that smaller areas tend to support fewer species, while larger areas can support a greater diversity of species.
5. Rectangular Hyperbola:
The relationship can also be represented mathematically as:
S=CAZ
This equation shows that the relationship between species richness and area can be visualized as a rectangular hyperbola on a graph.
Graph Illustration:
- Draw a graph with the X-axis labeled "Area" and the Y-axis labeled "Species Richness".
- Plot a curve that starts from the origin and rises, illustrating that as area increases, species richness also increases, but at a diminishing rate.
The species-area relationship is a principle that describes how the number of species (species richness) in a given area increases with the area size. This concept was introduced by the German naturalist and geographer Alexander von Humboldt. He proposed that as the area explored increases, the richness of species also increases, but only up to a certain limit.
To illustrate the species-area relationship, we can create a graph:
- X-axis: Represents the area (A).
- Y-axis: Represents species richness (S).
- The relationship can be depicted on a logarithmic scale, where the equation is given by:
logS=logC+ZlogA
Here, S is species richness, C is a constant (the y-intercept), A is the area, and Z is the slope of the line (regression coefficient).
The slope (Z) of the regression line in the species-area relationship graph is significant because it indicates how species richness changes with area. A higher value of Z suggests that species richness increases more rapidly with an increase in area, while a lower value indicates a slower increase.
The significance of the slope (Z) can be summarized as follows:
- It indicates that species richness decreases when the area decreases. This means that smaller areas tend to support fewer species, while larger areas can support a greater diversity of species.
The relationship can also be represented mathematically as:
S=CAZ
This equation shows that the relationship between species richness and area can be visualized as a rectangular hyperbola on a graph.
- Draw a graph with the X-axis labeled "Area" and the Y-axis labeled "Species Richness".
- Plot a curve that starts from the origin and rises, illustrating that as area increases, species richness also increases, but at a diminishing rate.
Topper's Solved these Questions
- SAMPLE QUESTION PAPER 02Book:ICSEChapter:SAMPLE QUESTION PAPER 02Exercise:PART-II (SECTION .B.)
Explore 11 Videos
- SAMPLE QUESTION PAPER 02Book:ICSEChapter:SAMPLE QUESTION PAPER 02Exercise:PART-II (SECTION .B.)
Explore 11 Videos
- SAMPLE PAPER 2019Book:ICSEChapter:SAMPLE PAPER 2019Exercise:PART-II (SECTION-C)
Explore 12 Videos
- Sample Question Paper 1Book:ICSEChapter:Sample Question Paper 1Exercise:PARTI- II (SECTION .C.)
Explore 12 Videos
Similar Questions
Knowledge Check

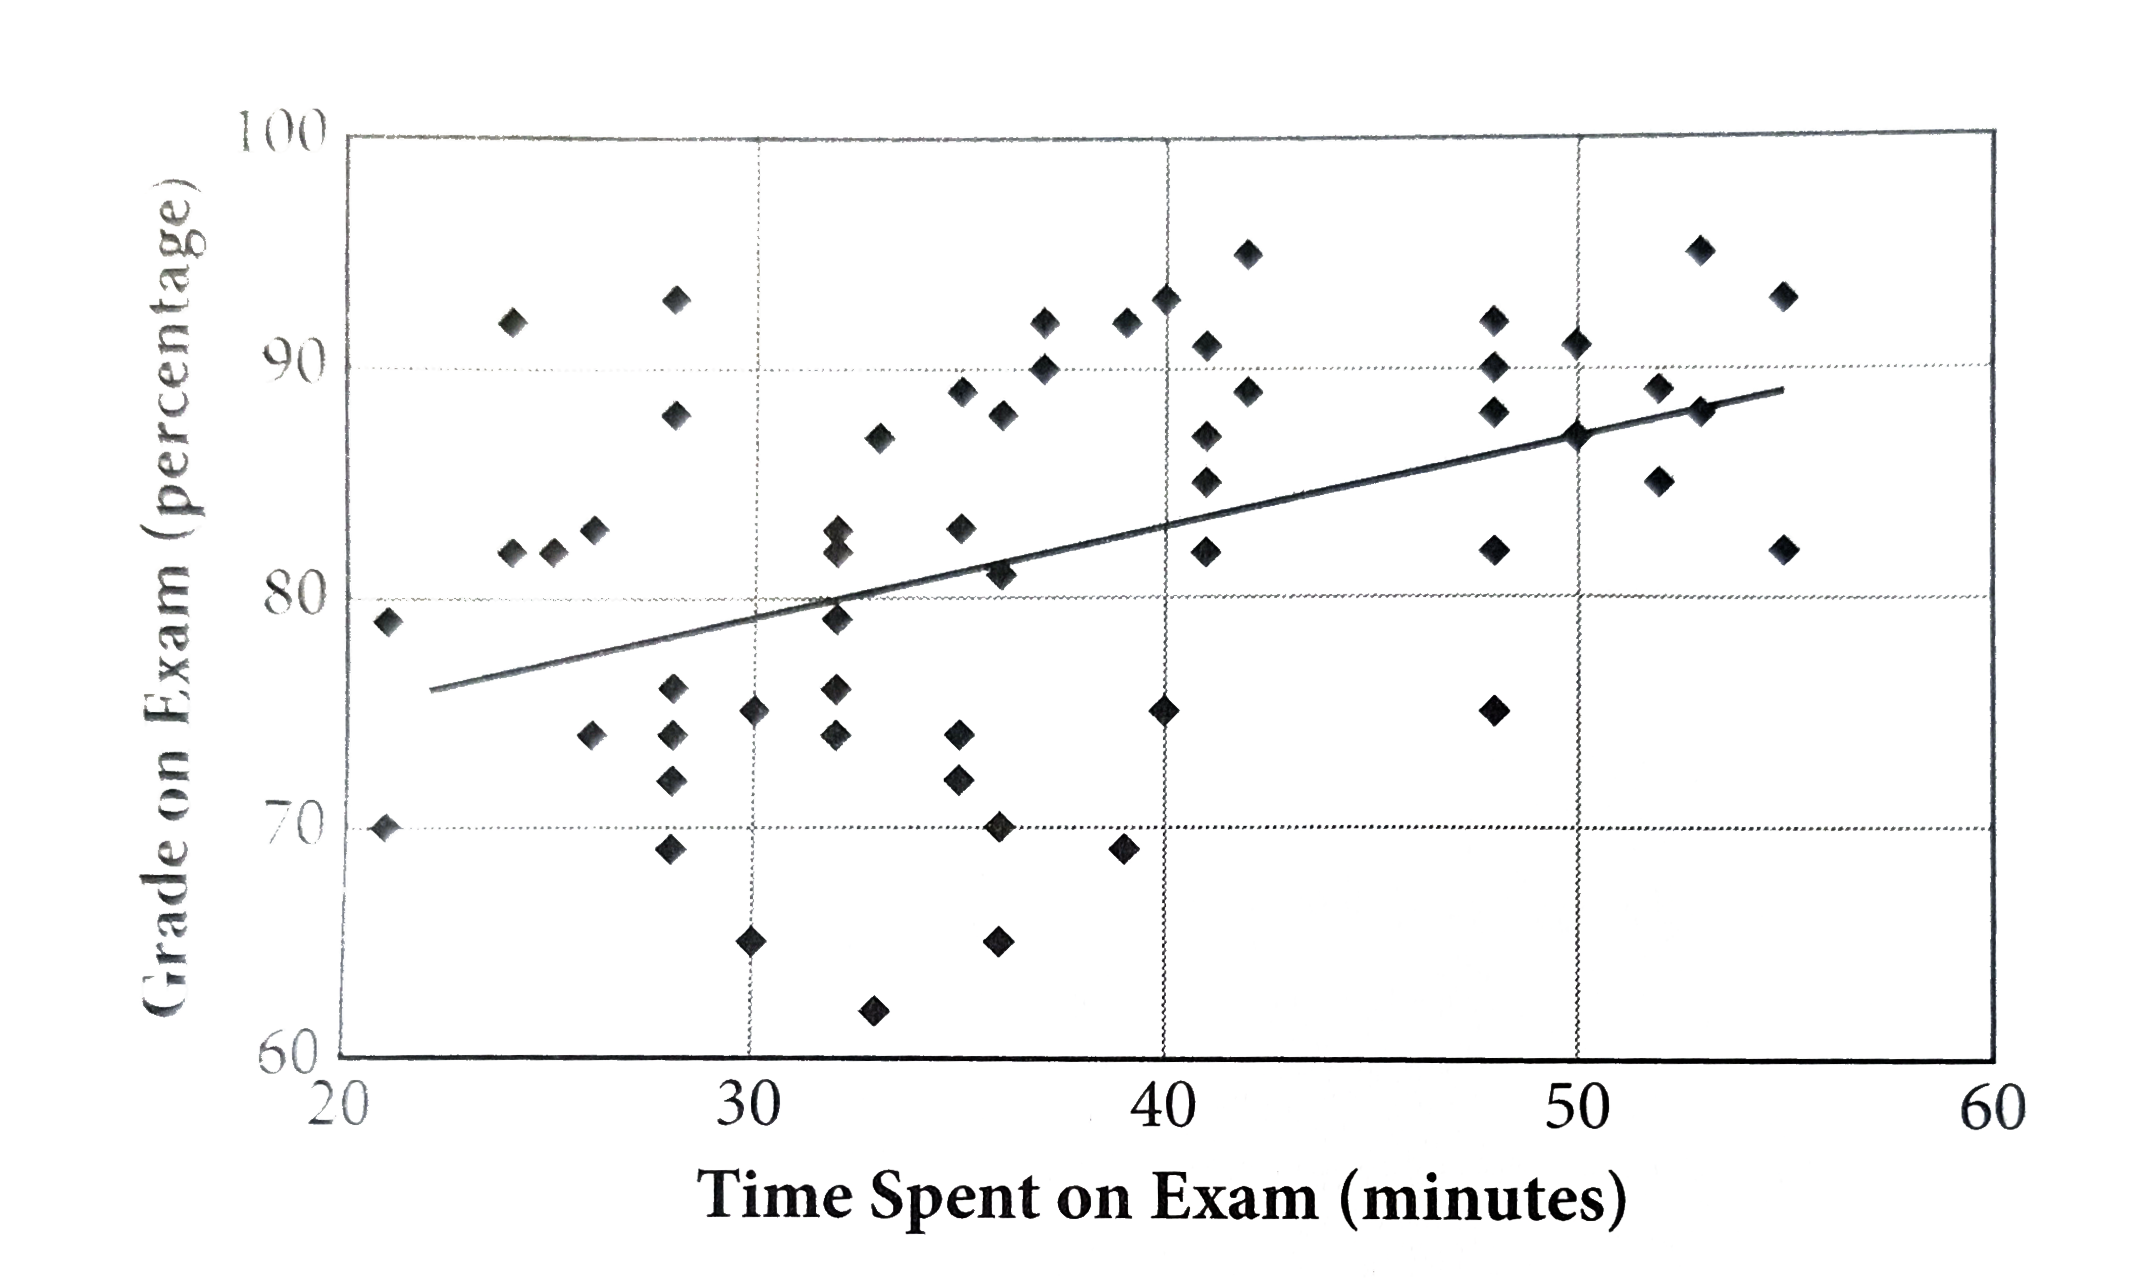
A physicas professor presented the scatterplot above to her first-year students. What is the significance of the slope of the line of best fit ?AThe slope represents the rate at which time spent on an exam increases based on a student's exam performance.BThe slope represents the average grade on the exam.CThe slope represents the rate at which a student's exam grade increases based on time spent on the exam.DThe slope has no significance.
Define angular momentum. What is its physical significance ?
View SolutionWhat is the significance of area of closed curve on P-V diagrams?
View SolutionDefine vital capacity. What is its significance?
View SolutionDefine vital capacity. What is its significance?
View SolutionWhat is the slope of x-t graph of a stationary object?
View SolutionDefine BOD. What is its significance in an aquatic ecosystem?
View SolutionIn the polt of the species - area relationship for the co-efficient z, the axis X and Y, represents
View Solution

