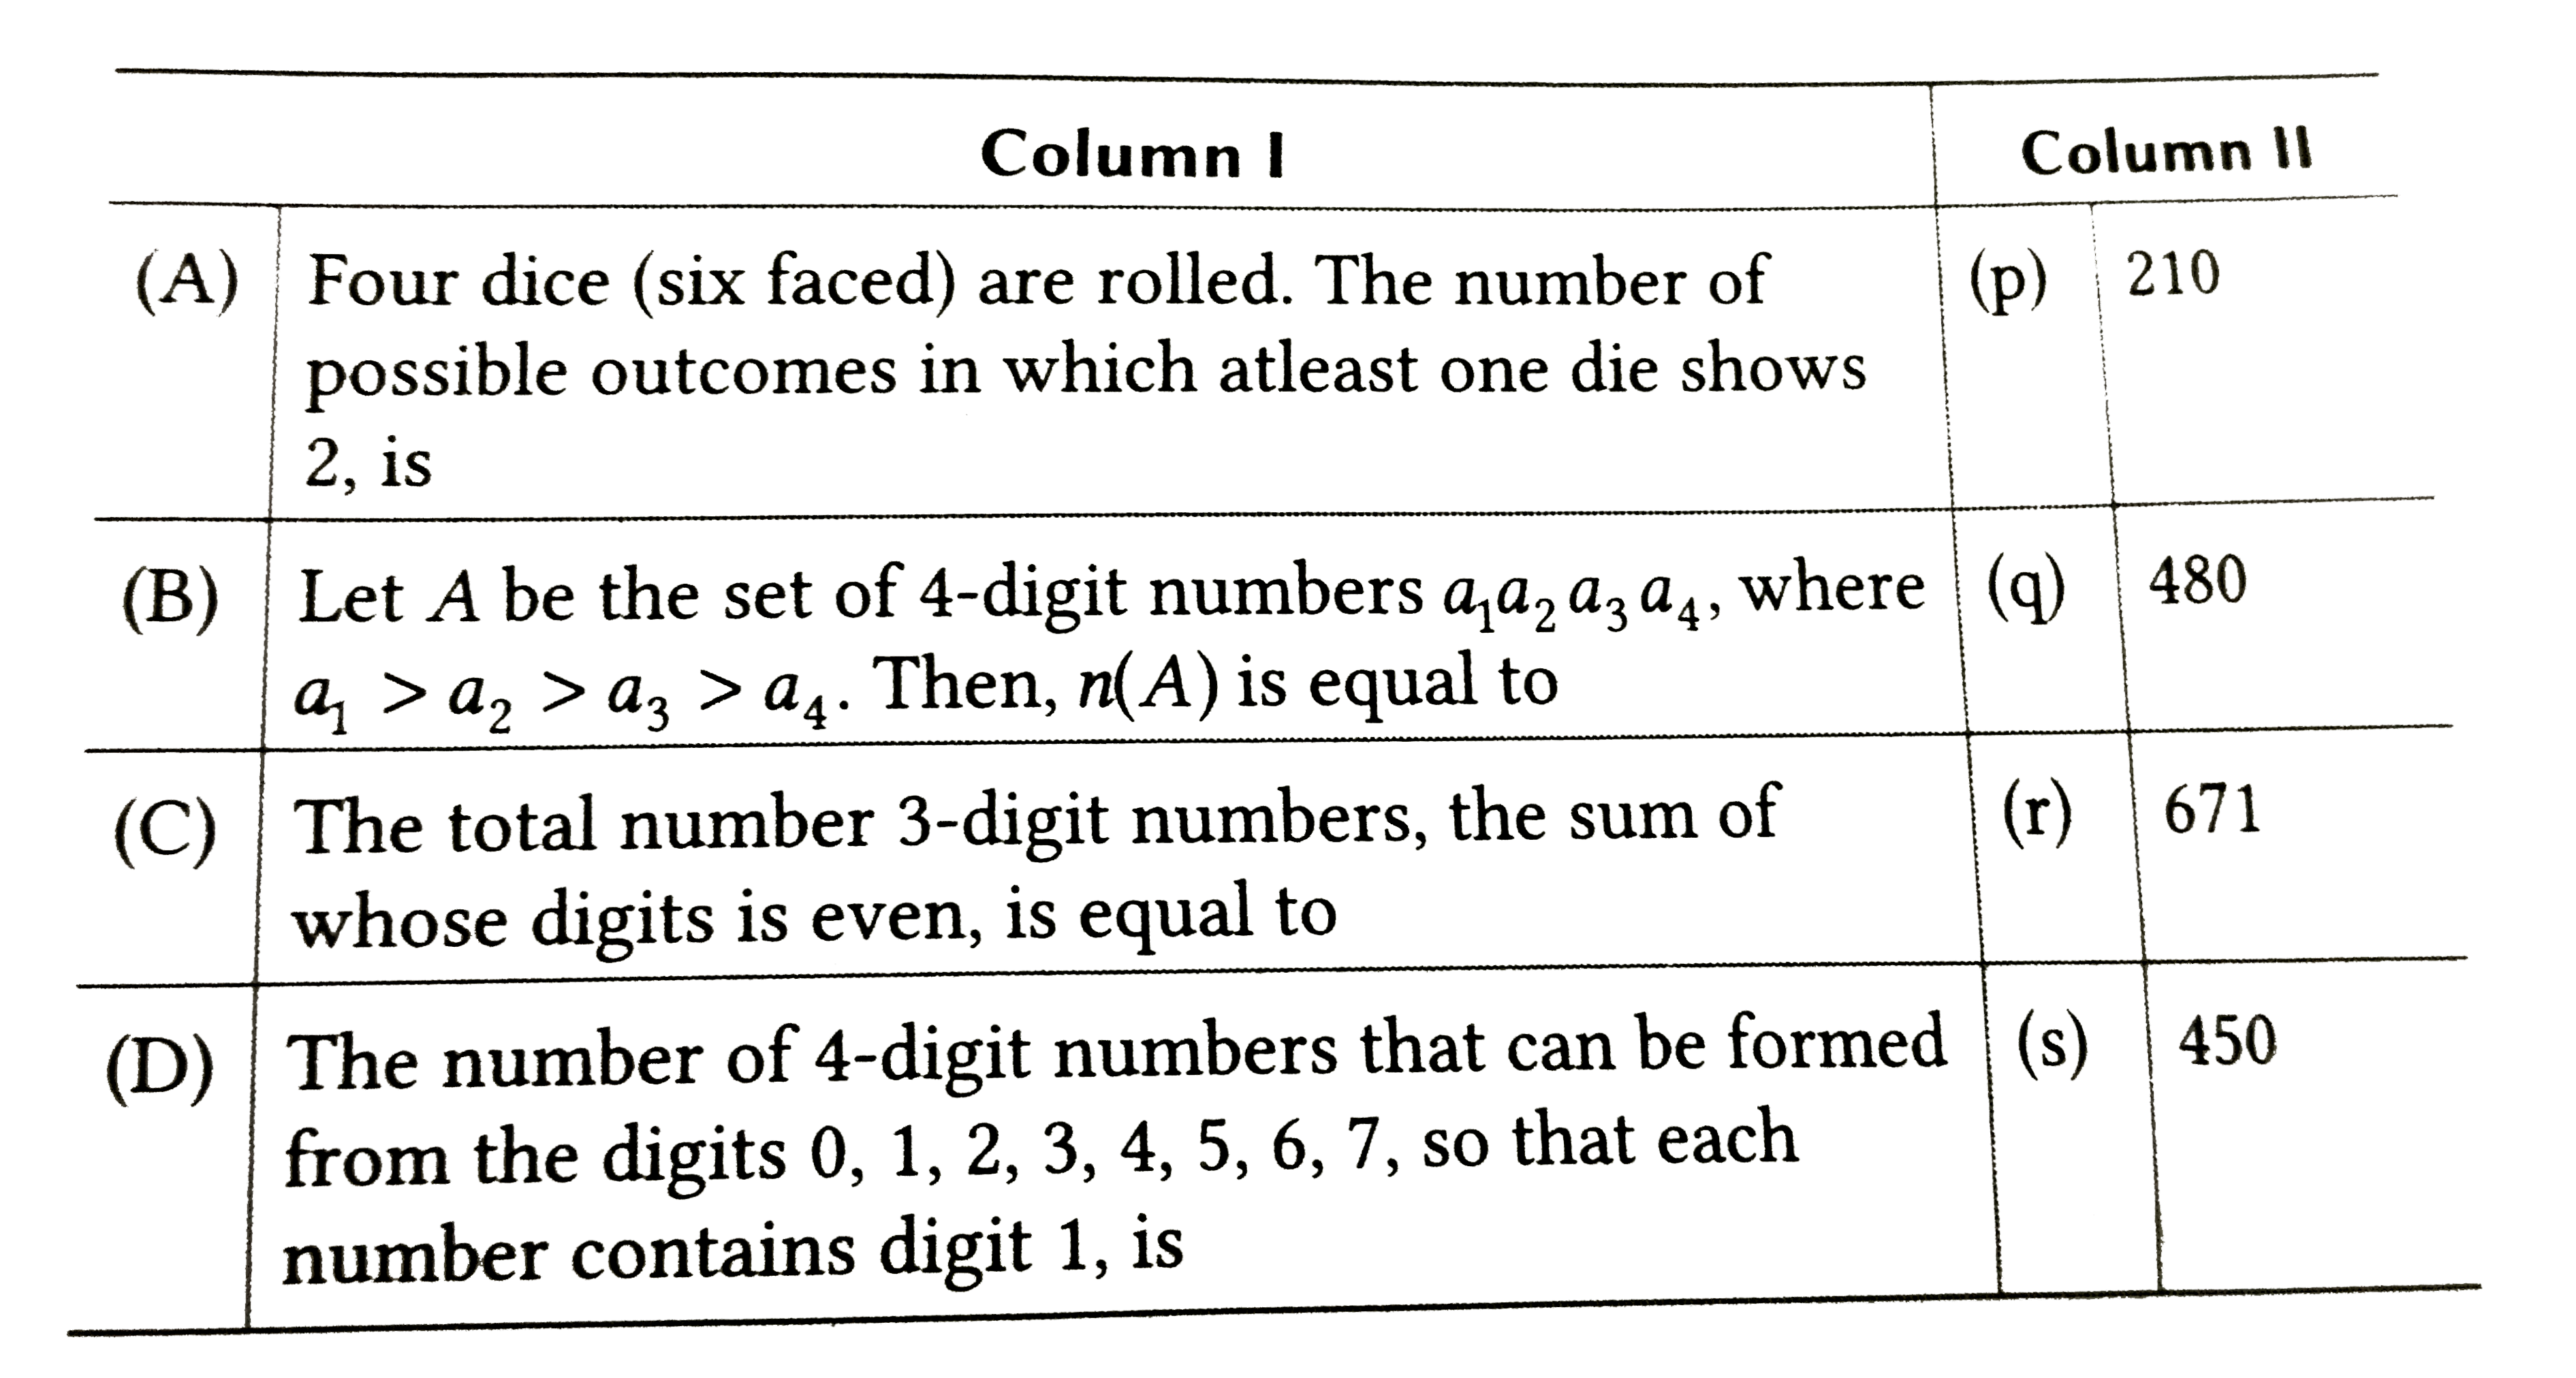
 .
.
(A)-r,(B)-p,(C)-s,(D)-q
Topper's Solved these Questions
- PERMUTATIONS AND COMBINATIONS BOOK - ARIHANT MATHS ENGLISHCHAPTER - PERMUTATIONS AND COMBINATIONS EXERCISE - Exercise For Session 1
11 Videos
- PERMUTATIONS AND COMBINATIONS BOOK - ARIHANT MATHS ENGLISHCHAPTER - PERMUTATIONS AND COMBINATIONS EXERCISE - Exercise For Session 2
15 Videos
- PERMUTATIONS AND COMBINATIONS BOOK - ARIHANT MATHS ENGLISHCHAPTER - PERMUTATIONS AND COMBINATIONS EXERCISE - Exercise (Questions Asked In Previous 13 Years Exam)
28 Videos
- PARABOLABOOK - ARIHANT MATHS ENGLISHCHAPTER - PARABOLAEXERCISE - Exercise (Questions Asked In Previous 13 Years Exam)
36 Videos
- PROBABILITYBOOK - ARIHANT MATHS ENGLISHCHAPTER - PROBABILITYEXERCISE - Exercise (Questions Asked In Previous 13 Years Exam)
54 Videos
Similar Questions
There are three routes: air, rail and road for going from Chennai to Hyderabad. But from Hyderabad to Vikarabad, there are two routes, rail and road. The number of routes from Chennai to Vikarabad via Hyderabad is:
View SolutionIf .nP5=20.nP3, find the value of n.
View SolutionThere is a rectangular sheet of dimension (2m−1)×(2n−1), (where m>0,n>0) It has been divided into square of unit area by drawing line perpendicular to the sides. Find the number of rectangles having sides of odd unit length.
View Solutionabout to only mathematics
View Solutionabout to only mathematics
View SolutionHow many lines of symmetry does the above figure have ?
View SolutionWhich of the following are correct chain isomers of butane ? (i)
View SolutionDetermine the point of symmetry of a regular hexagon.
View SolutionDtermine the images of the following figure about the given line :
View SolutionMatch the following Column A to Column B

View SolutionMatch the following Column A to Column B

View SolutionMatch the following Column A to Column B

View SolutionFind the area of the figure given below.

View SolutionThe area of the shaded part in the figure given below is ______.

View SolutionThe inequation represented by the graph given below is :
View SolutionThe inequation that best describes the graph given below is _________
View Solution
