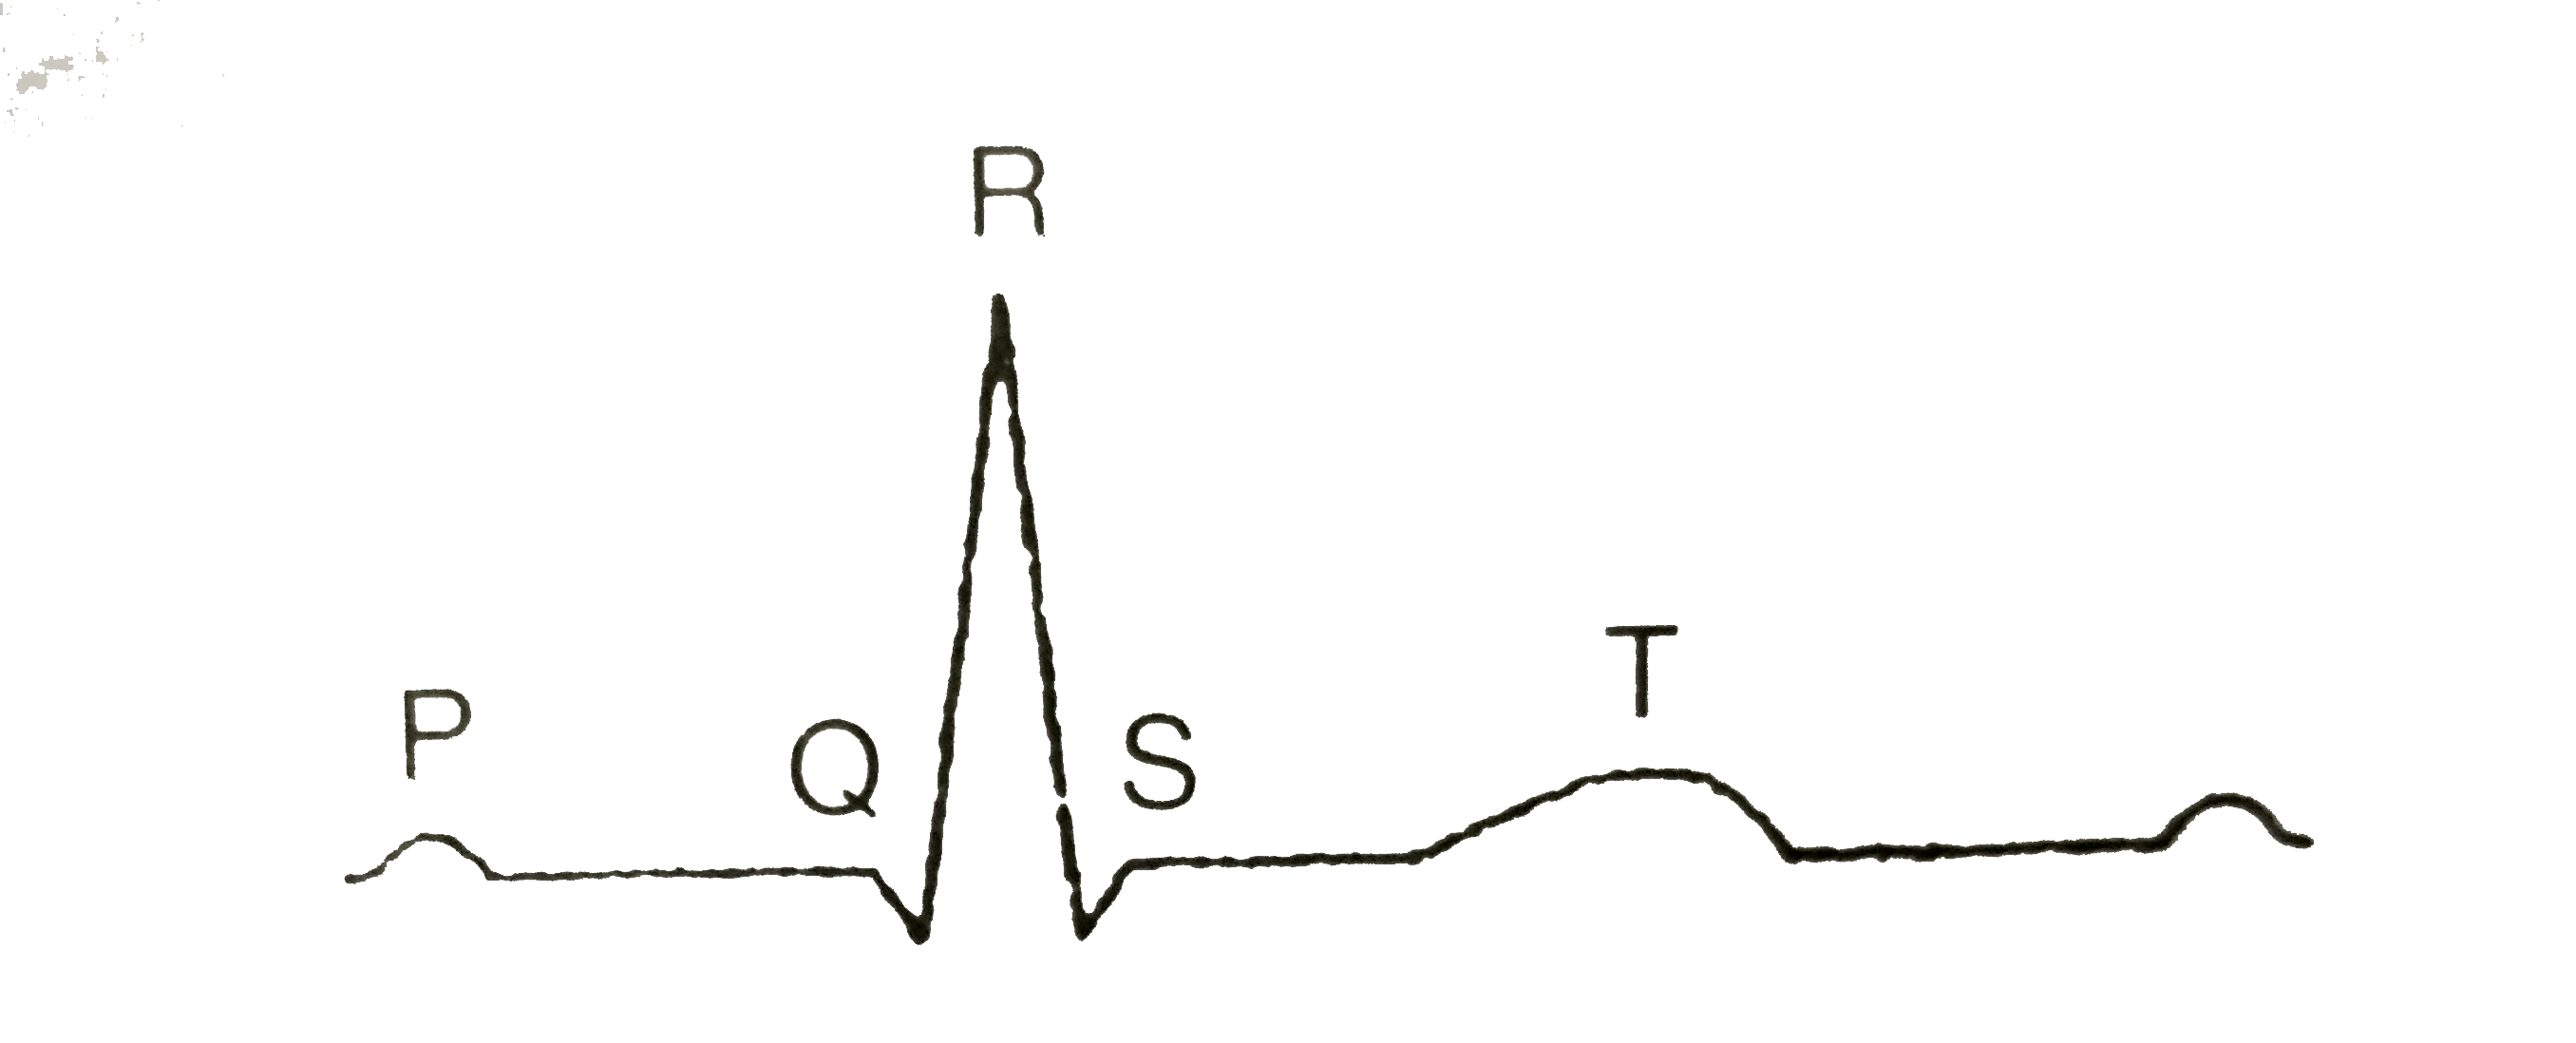
The diagram given here is the standard ECG of a normal person.The P-wave represents the
A
Contraction of both the atria
B
Initiation of the ventricular contraction
C
Beginning of the systole
D
End of systole
Video Solution
Text Solution
The correct Answer is:A
P wave in an ECG shows contraction of both the atria
|
Similar Questions
Knowledge Check
The diagram given here is the representation of
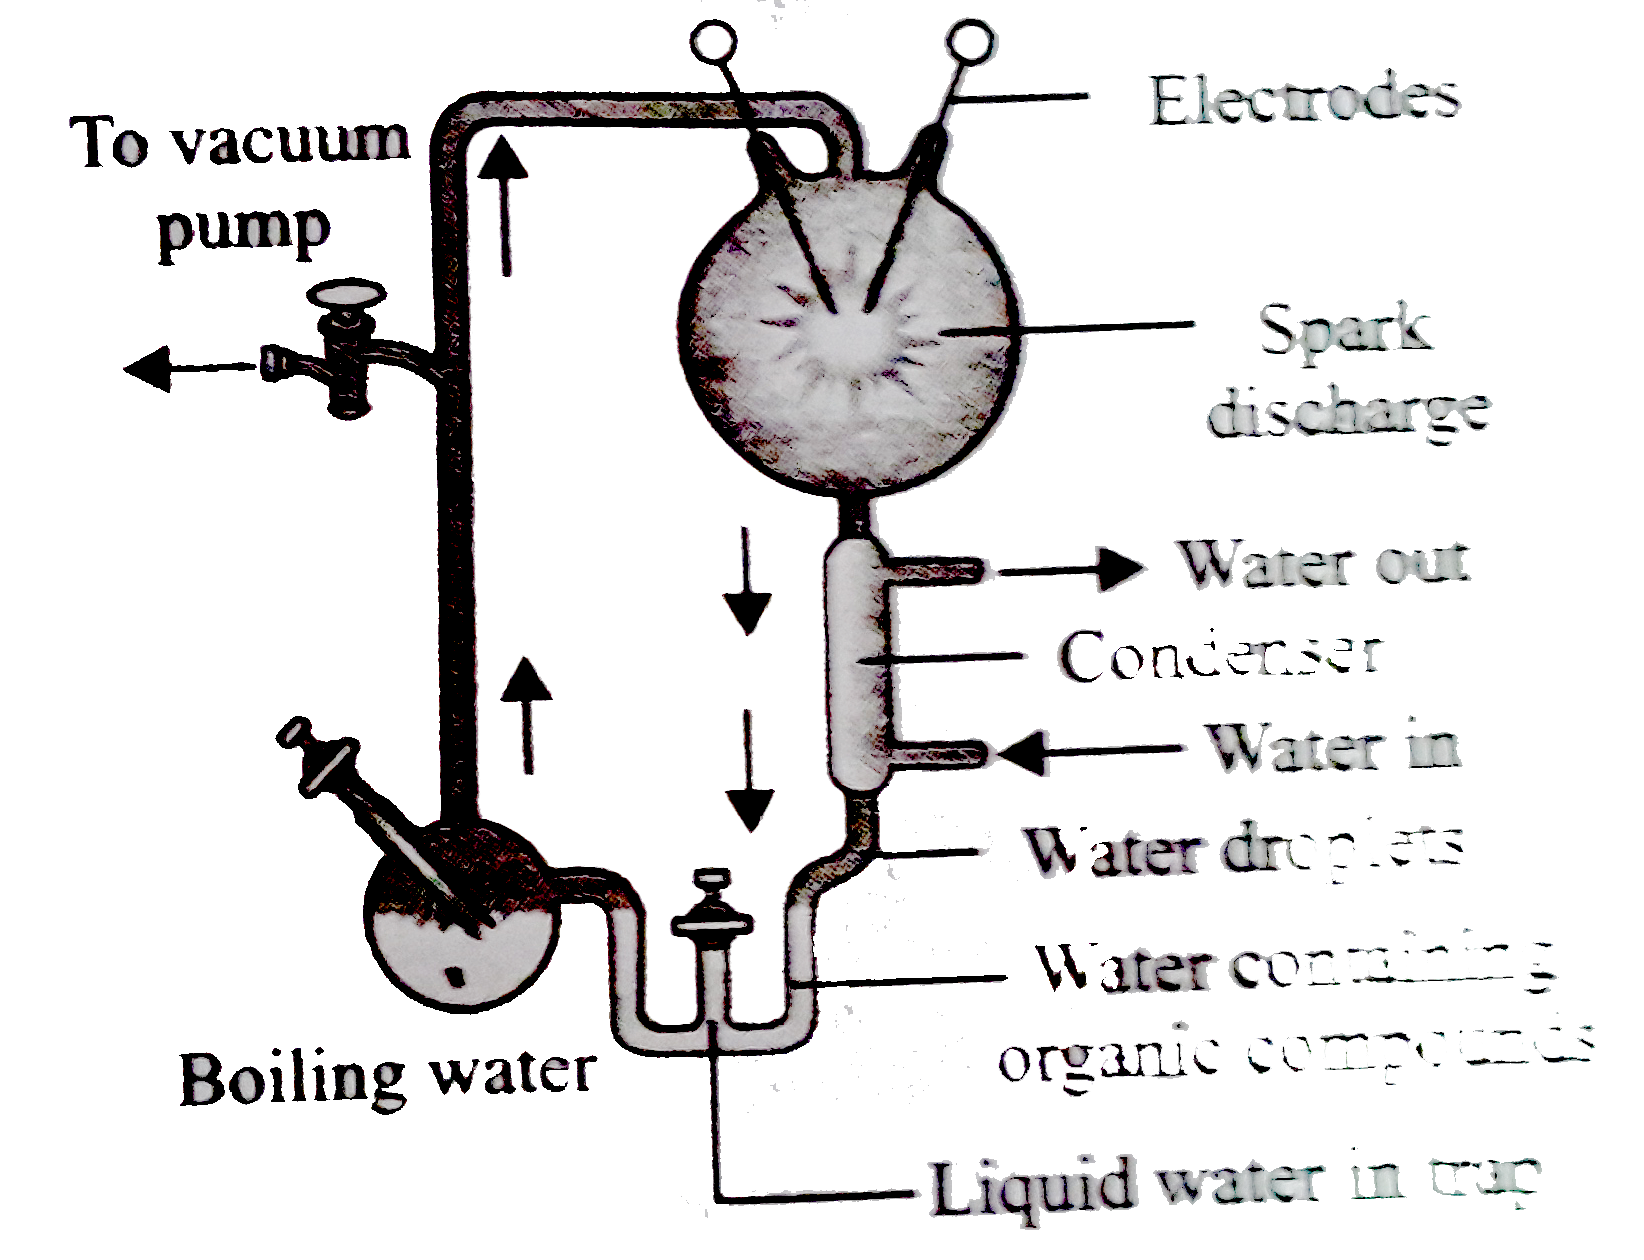 AMiller's experimentBRedi's experimentCLouis pasteur's experimentDSpallanzani's experiment
Study the diagram given below and answer the questions that follow:
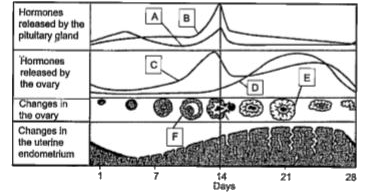
The alphabet 'A' represents ______ hormone.AOestrogenBProgesteroneCFSHDLH
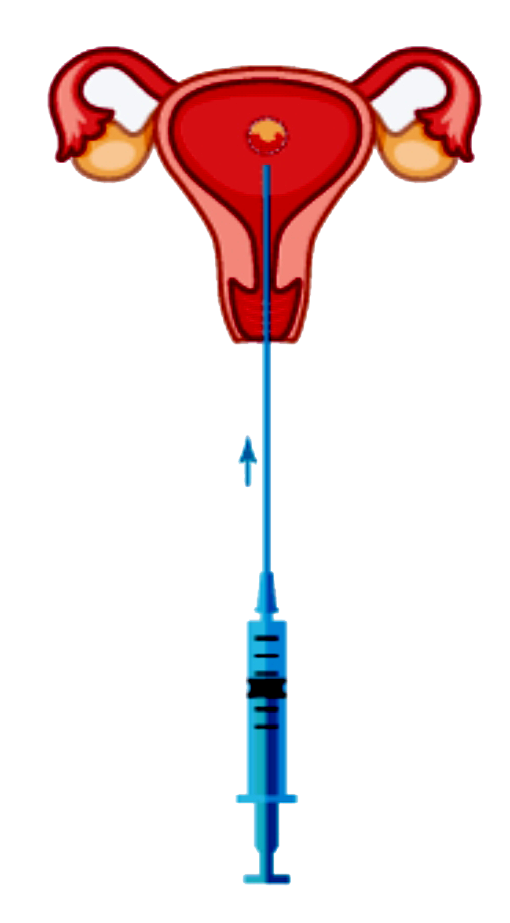
The diagram given below represents
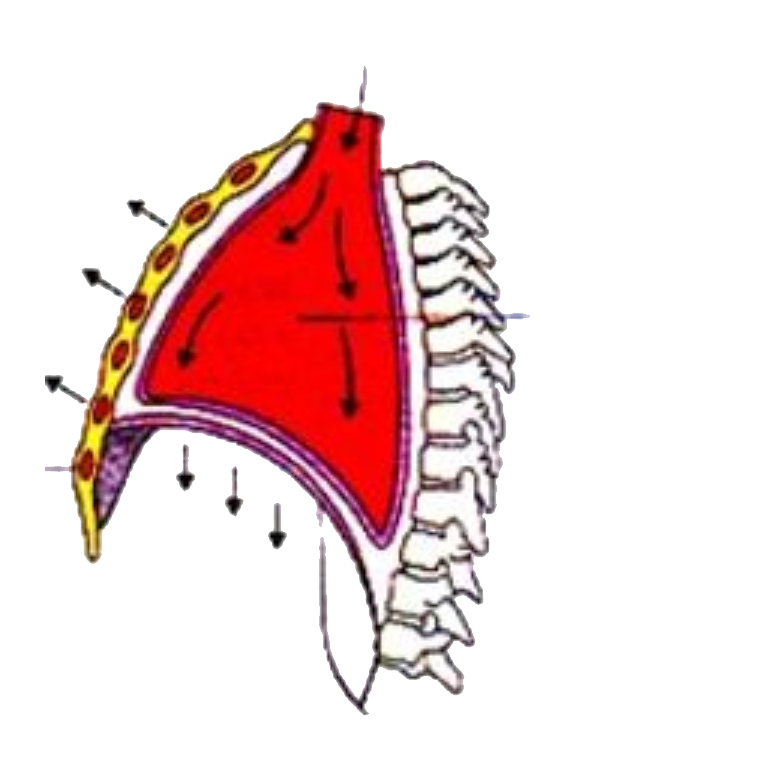
View SolutionThe given diagram represents
View SolutionIn ECG, what does T wave represent?
View Solution'T' wave in an ECG represents
View SolutionT wave in a standard ECG represents
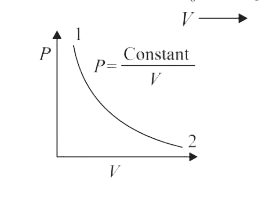
View SolutionFor the diagram given for an ideal gas, out of the following which one correctly represent the diagram?
View Solution

