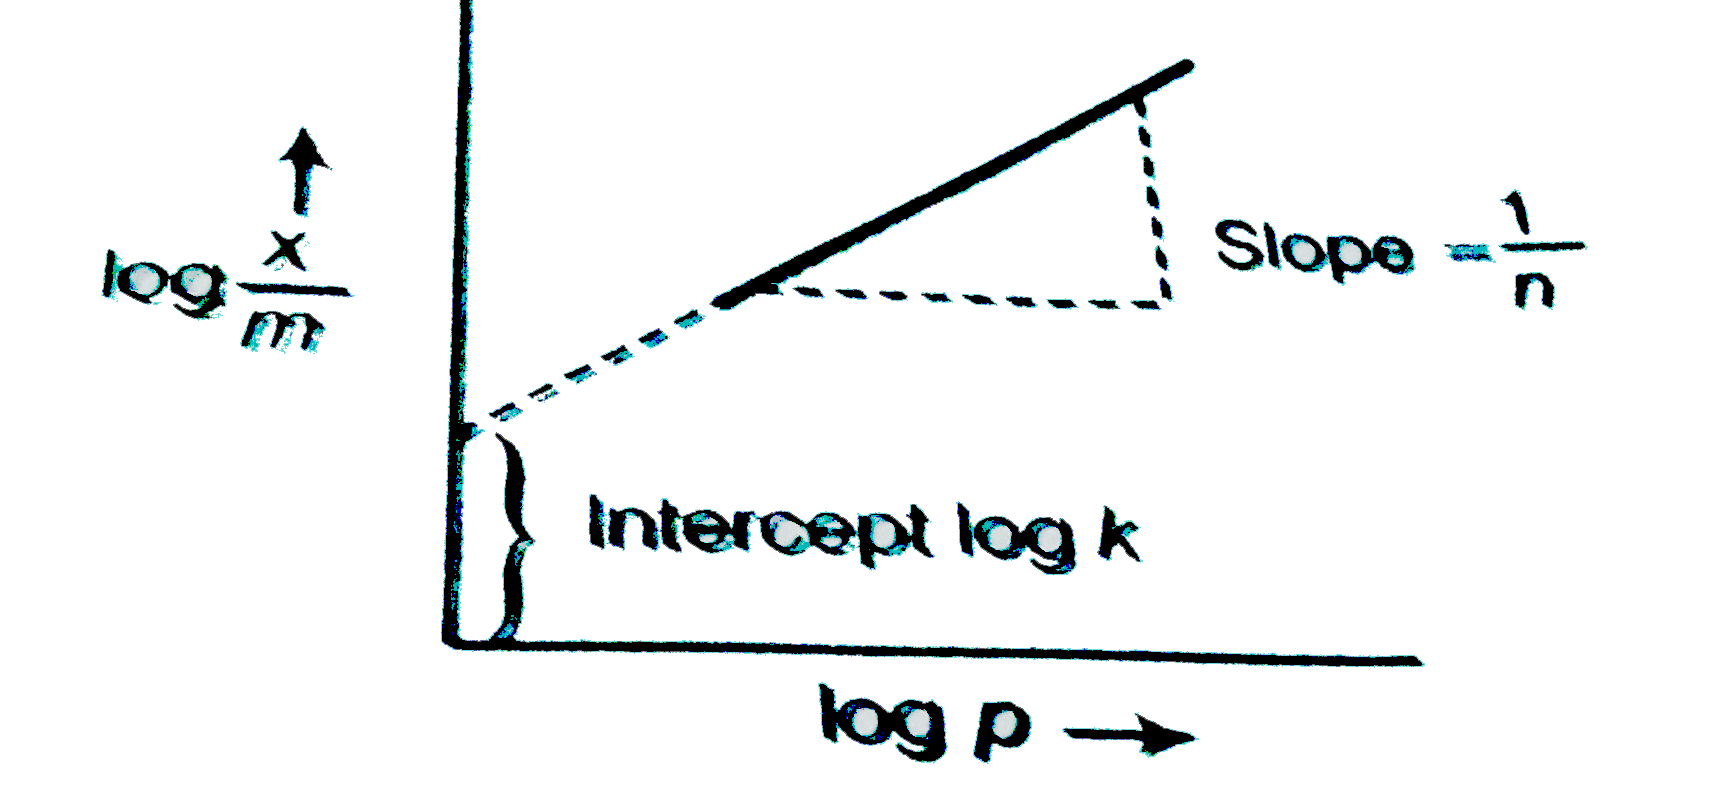
A plot of log (xm) against log P for the adsorption of a gas on a solid gives a straight a straight line with slope equal to :
k
log k
n
1n
The correct Answer is:D
If we plot a graph between log (xm) and log p, a straight line will be obtained. The slope of the line is equal to 1n and the intercept is equal to log k.

where, xm = amount of adsorption
According to Freundlich adsorption isotherm
xm=kp1/n
Taking log of both sides,
log.xm=logk+1nlogp
from y = zx + c
z=1n (slope)
Similar Questions
Knowledge Check
A plot of log (a-x) against time 't' is a straight line. This indicates that the reaction is of :
Azero orderBfirst orderCsecond orderDthird order
For the adsorption of a gas on a solid, the plot of log(x/m) versus log p is linear with slope equal to
View SolutionFor a first order reaction the plot of ‘t’ against log c gives a straight line with a slope equal to :
View SolutionFreundlich adsorption isotherm gives a straight line on plotting :
View SolutionAdsorption of a gas on a surface follows Freundlich adsorption isotherm. Plot of log xm versus log P gives a straight line with slope equal to 0.5, then :
(xm is the mass of the gas adsorbed per gram of adsorbent)
View SolutionRate constant k of a reaction varies with temperature according to the equation
logk = constant −Ea2.303R(1T)
where Ea is the energy of activation for the reaction . When a graph is plotted for log k versus 1T , a straight line with a slope - 6670 K is obtained. Calculate the energy of activation for this reaction
View SolutionFind slope of a straight line 2x−5y+7=0
View SolutionThe graph between logk versus 1/T is a straight line.
View Solution