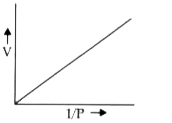
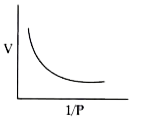
The true graphical representation of volume versus temperature relationship at constant pressure is :


The correct Answer is:a
To solve the question about the graphical representation of the volume versus temperature relationship at constant pressure, we can follow these steps:
1. Understand the Ideal Gas Law:
The ideal gas law is given by the equation PV=nRT, where:
- P = pressure
- V = volume
- n = number of moles of gas
- R = ideal gas constant
- T = temperature in Kelvin
2. Identify Constants:
In this scenario, we are considering the relationship at constant pressure. This means that P is fixed, and since the number of moles n and the gas constant R are also constants, we can simplify the equation.
3. Rearranging the Ideal Gas Law:
Since P is constant, we can rearrange the ideal gas law to express volume V in terms of temperature T:
V=nRPT
Here, nRP is a constant (let's call it k). Thus, we can rewrite the equation as:
V=kT
4. Determine the Relationship:
The equation V=kT indicates that volume V is directly proportional to temperature T. This means that as temperature increases, volume also increases, and vice versa.
5. Graphical Representation:
When we graph this relationship, we plot volume V on the y-axis and temperature T on the x-axis. Since the relationship is linear (directly proportional), the graph will be a straight line that passes through the origin (0,0).
6. Conclusion:
Therefore, the true graphical representation of the volume versus temperature relationship at constant pressure is a straight line that starts from the origin.
Final Answer:
The true graphical representation of volume versus temperature relationship at constant pressure is a straight line passing through the origin.
---
The ideal gas law is given by the equation PV=nRT, where:
- P = pressure
- V = volume
- n = number of moles of gas
- R = ideal gas constant
- T = temperature in Kelvin
In this scenario, we are considering the relationship at constant pressure. This means that P is fixed, and since the number of moles n and the gas constant R are also constants, we can simplify the equation.
Since P is constant, we can rearrange the ideal gas law to express volume V in terms of temperature T:
V=nRPT
Here, nRP is a constant (let's call it k). Thus, we can rewrite the equation as:
V=kT
The equation V=kT indicates that volume V is directly proportional to temperature T. This means that as temperature increases, volume also increases, and vice versa.
When we graph this relationship, we plot volume V on the y-axis and temperature T on the x-axis. Since the relationship is linear (directly proportional), the graph will be a straight line that passes through the origin (0,0).
Therefore, the true graphical representation of the volume versus temperature relationship at constant pressure is a straight line that starts from the origin.
The true graphical representation of volume versus temperature relationship at constant pressure is a straight line passing through the origin.
Topper's Solved these Questions
- STUDY OF GAS LAWS BOOK - ICSECHAPTER - STUDY OF GAS LAWS EXERCISE - TOPIC 2 (2 Marks Questions )
27 Videos
- STUDY OF GAS LAWS BOOK - ICSECHAPTER - STUDY OF GAS LAWS EXERCISE - TOPIC 2 (3 Marks Questions )
29 Videos
- STUDY OF GAS LAWS BOOK - ICSECHAPTER - STUDY OF GAS LAWS EXERCISE - TOPIC 1 (5 Marks Questions )
10 Videos
- SPECIMEN PAPER 3BOOK - ICSECHAPTER - SPECIMEN PAPER 3EXERCISE - SECTION II
35 Videos
- STUDY OF THE FIRST ELEMENT - HYDROGENBOOK - ICSECHAPTER - STUDY OF THE FIRST ELEMENT - HYDROGENEXERCISE - TOPIC 2 Properties of Hydrogen, Oxidation nd Reduction (5 MARKS QUESTIONS)
29 Videos
Similar Questions
Knowledge Check
Which is the true graphical representation of V vs 1/P
A B
B C
C D
D
Volume : Temperature relationship is given by
ABoyleBGay LussacCDaltonDCharles
Give a graphic representation of phosphorus cycle in nature.
View SolutionWhich is not the graphical representation for the zeroth order reaction ?
View SolutionGraphic representation indicating evolutionary relationships of group is
View SolutionGive a graphic representation of carbon cycle in nature.
View SolutionThe graphic representation of interrelationship between plants and animals is
View SolutionDepict graphically the variation of the extent of adsorption with temperature at constant pressure for physical and chemical adsorptions.
View Solution
