The heights (in cm) of the volley-ball players from team A and term B were recorded as :
Team A : 180, 178, 176, 181, 190, 175, 187
Team B : 174, 175, 190, 179, 178, 185, 177
Which team had the greater average height ?
Find the median of team A and team B.
The correct Answer is:Team A has greater average height. Median of team A is 180 cm and median of term B is 178 cm.
To solve the problem, we will follow these steps:
Step 1: Calculate the Mean Height of Team A
1. List the heights of Team A: 180, 178, 176, 181, 190, 175, 187
2. Sum the heights:
180+178+176+181+190+175+187=1267
3. Count the number of players: There are 7 players in Team A.
4. Calculate the mean:
Mean=Sum of heightsNumber of players=12677=181 cm
Step 2: Calculate the Mean Height of Team B
1. List the heights of Team B: 174, 175, 190, 179, 178, 185, 177
2. Sum the heights:
174+175+190+179+178+185+177=1258
3. Count the number of players: There are 7 players in Team B.
4. Calculate the mean:
Mean=Sum of heightsNumber of players=12587≈179.71 cm
Step 3: Compare the Mean Heights
- Team A Mean Height: 181 cm
- Team B Mean Height: 179.71 cm
- Conclusion: Team A has a greater average height.
Step 4: Find the Median Height of Team A
1. Arrange the heights of Team A in ascending order: 175, 176, 178, 180, 181, 187, 190
2. Find the median:
- Total number of observations (N) = 7 (odd)
- Median position = N+12=7+12=4
- The 4th observation in the ordered list is 180 cm.
Step 5: Find the Median Height of Team B
1. Arrange the heights of Team B in ascending order: 174, 175, 177, 178, 179, 185, 190
2. Find the median:
- Total number of observations (N) = 7 (odd)
- Median position = N+12=7+12=4
- The 4th observation in the ordered list is 178 cm.
Final Results
- Mean Height: Team A = 181 cm, Team B = 179.71 cm
- Median Height: Team A = 180 cm, Team B = 178 cm
1. List the heights of Team A: 180, 178, 176, 181, 190, 175, 187
2. Sum the heights:
180+178+176+181+190+175+187=1267
3. Count the number of players: There are 7 players in Team A.
4. Calculate the mean:
Mean=Sum of heightsNumber of players=12677=181 cm
1. List the heights of Team B: 174, 175, 190, 179, 178, 185, 177
2. Sum the heights:
174+175+190+179+178+185+177=1258
3. Count the number of players: There are 7 players in Team B.
4. Calculate the mean:
Mean=Sum of heightsNumber of players=12587≈179.71 cm
- Team A Mean Height: 181 cm
- Team B Mean Height: 179.71 cm
- Conclusion: Team A has a greater average height.
1. Arrange the heights of Team A in ascending order: 175, 176, 178, 180, 181, 187, 190
2. Find the median:
- Total number of observations (N) = 7 (odd)
- Median position = N+12=7+12=4
- The 4th observation in the ordered list is 180 cm.
1. Arrange the heights of Team B in ascending order: 174, 175, 177, 178, 179, 185, 190
2. Find the median:
- Total number of observations (N) = 7 (odd)
- Median position = N+12=7+12=4
- The 4th observation in the ordered list is 178 cm.
- Mean Height: Team A = 181 cm, Team B = 179.71 cm
- Median Height: Team A = 180 cm, Team B = 178 cm
Topper's Solved these Questions
Similar Questions
A school has to send one team of 8 members to participate in team event in a Mathematics competition. Team A and B want to participate in this competition. The members of both the terms appear for a qualifying test. The marks obtained by the members of the two teams are as follow:
Team A: 76,72,78,82,79,80,77
Team B: 81,73,51,81,56,81,54,83
Which central tendency should the school use to select the team for the competition?

View SolutionThe heights, to the nearest cm, of 30 men are given below:
159170174173175160161164163165164171162170177185181180175165186174168168176176165175167180
Using class intervals 155 - 160, 160 - 165, ... draw up a grouped frequency distribution and use this to estimate the Arithmetic mean and standard deviation.
View Solution
Knowledge Check
Column AThe average ages of the players on team A and team B , are 20 and 30 years, respectively. The Average age of the players of the teams togeter is 26Column BThe number of players on team AThe number of players on team B
AIf column A is largerBIf column B is largerCIf the columns are equalDIf there is not enough information to decideThe Math Team and Debate Club at Jackson City High School buy their T-shirts from different stores. The tables below show the numbers of T-shirts ordered by the Math Team and Debate Club , and the costs of medium , large , and extra-large T-shirts.

Which statement about the costs of T-shirts , as shown in the tables , is true ?
I.The Math Team spent more on extra-large T-shirts than the Debate Club spent .
II.On average , the Math Team paid more per T-shirt than the Debate Club paid .
III. Of the three sizes , extra-large T-shirts had the highest median cost.AI onlyBII onlyCIII onlyDI,II and IIIThis passage is adapted from Geoffrey Giller, “Long a Mystery, How 500-Meter-High Undersea Waves Form Is Revealed.” ©2014 by Scientific American.
nearly impossible to see. Unlike other large waves, these rollers, called internal waves, do not ride the ocean surface. Instead, they move underwater, undetectable without the use of satellite imagery or sophisticated monitoring equipment. Despite their hidden nature, internal waves are fundamental parts of ocean water dynamics, transferring heat to the ocean depths and bringing up cold water from below. And they can reach staggering heights—some as tall as skyscrapers.
Because these waves are involved in ocean mixing and thus the transfer of heat, understanding them is crucial to global climate modeling, says Tom Peacock, a researcher at the Massachusetts Institute of Technology. Most models fail to take internal waves into account. “If we want to have more and more accurate climate models, we have to be able to capture processes such as this,” Peacock says.
Peacock and his colleagues tried to do just that. Their study, published in November in Geophysical Research Letters, focused on internal waves generated in the Luzon Strait, which separates Taiwan and the Philippines. Internal waves in this region, thought to be some of the largest in the world, can reach about 500 meters high. “That’s the same height as the Freedom Tower that’s just been built in New York,” Peacock says.
the South China Sea and beyond, they didn’t know exactly how internal waves formed. To find out, Peacock and a team of researchers from M.I.T. and Woods Hole Oceanographic Institution worked with France’s National Center for Scientific Research using a giant facility there called the Coriolis Platform. The rotating platform, about 15 meters (49.2 feet) in diameter, turns at variable speeds and can simulate Earth’s rotation. It also has walls, which means scientists can fill it with water and create accurate, large-scale simulations of various oceanographic scenarios.
Peacock and his team built a carbon-fiber resin scale model of the Luzon Strait, including the islands and surrounding ocean floor topography. Then they filled the platform with water of varying salinity to replicate the different densities found at the strait, with denser, saltier water below and lighter, less briny water above. Small particles were added to the solution and illuminated with lights from below in order to track how the liquid moved. Finally, they re-created tides using two large plungers to see how the internal waves themselves formed.
The Luzon Strait’s underwater topography, with a distinct double-ridge shape, turns out to be responsible for generating the underwater waves. As the tide rises and falls and water moves through the strait, colder, denser water is pushed up over the ridges into warmer, less dense layers above it.
This action results in bumps of colder water trailed by warmer water that generate an internal wave. As these waves move toward land, they become steeper—much the same way waves at the beach become taller before they hit the shore—until they break on a continental shelf.
The researchers were also able to devise a mathematical model that describes the movement and formation of these waves. Whereas the model is specific to the Luzon Strait, it can still help researchers understand how internal waves are generated in other places around the world.
Eventually, this information will be incorporated into global climate models, making them more accurate. “It’s very clear, within the context of these [global climate] models, that internal waves play a role in driving ocean circulations,” Peacock says.
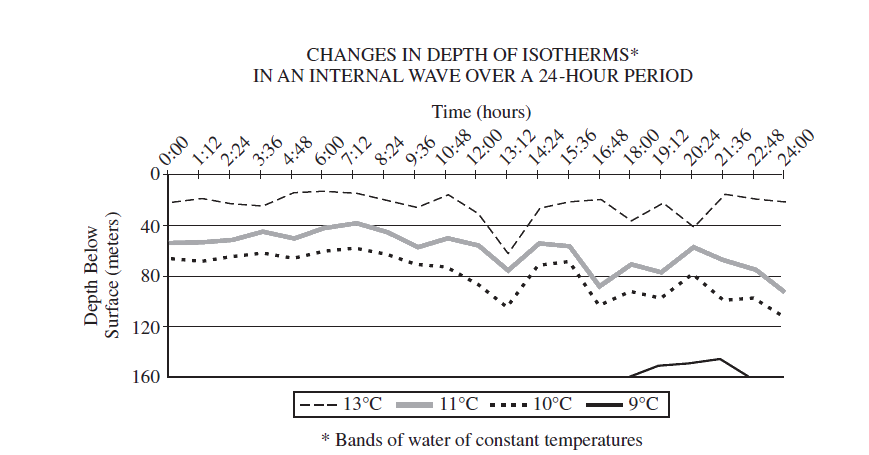
Adapted from Justin Small et al., “Internal Solitons in the Ocean: Prediction from SAR.” ©1998 by Oceanography, Defence Evaluation and Research Agency.
As used in line 65, “devise” most nearly meansAcreate.Bsolve.Cimagine.Dbegin.
The following the record of goals scored by team a in football session. Number of goals scored: 0 1 2 3 4 Number of matches: 1 9 7 5 3 For the team B, mean number of goals scored per match was 2 with a standard deviation 1.25 goals. Find which team may be considered more consistent?
View SolutionThis passage is adapted from Geoffrey Giller, “Long a Mystery, How 500-Meter-High Undersea Waves Form Is Revealed.” ©2014 by Scientific American.
nearly impossible to see. Unlike other large waves, these rollers, called internal waves, do not ride the ocean surface. Instead, they move underwater, undetectable without the use of satellite imagery or sophisticated monitoring equipment. Despite their hidden nature, internal waves are fundamental parts of ocean water dynamics, transferring heat to the ocean depths and bringing up cold water from below. And they can reach staggering heights—some as tall as skyscrapers.
Because these waves are involved in ocean mixing and thus the transfer of heat, understanding them is crucial to global climate modeling, says Tom Peacock, a researcher at the Massachusetts Institute of Technology. Most models fail to take internal waves into account. “If we want to have more and more accurate climate models, we have to be able to capture processes such as this,” Peacock says.
Peacock and his colleagues tried to do just that. Their study, published in November in Geophysical Research Letters, focused on internal waves generated in the Luzon Strait, which separates Taiwan and the Philippines. Internal waves in this region, thought to be some of the largest in the world, can reach about 500 meters high. “That’s the same height as the Freedom Tower that’s just been built in New York,” Peacock says.
the South China Sea and beyond, they didn’t know exactly how internal waves formed. To find out, Peacock and a team of researchers from M.I.T. and Woods Hole Oceanographic Institution worked with France’s National Center for Scientific Research using a giant facility there called the Coriolis Platform. The rotating platform, about 15 meters (49.2 feet) in diameter, turns at variable speeds and can simulate Earth’s rotation. It also has walls, which means scientists can fill it with water and create accurate, large-scale simulations of various oceanographic scenarios.
Peacock and his team built a carbon-fiber resin scale model of the Luzon Strait, including the islands and surrounding ocean floor topography. Then they filled the platform with water of varying salinity to replicate the different densities found at the strait, with denser, saltier water below and lighter, less briny water above. Small particles were added to the solution and illuminated with lights from below in order to track how the liquid moved. Finally, they re-created tides using two large plungers to see how the internal waves themselves formed.
The Luzon Strait’s underwater topography, with a distinct double-ridge shape, turns out to be responsible for generating the underwater waves. As the tide rises and falls and water moves through the strait, colder, denser water is pushed up over the ridges into warmer, less dense layers above it.
This action results in bumps of colder water trailed by warmer water that generate an internal wave. As these waves move toward land, they become steeper—much the same way waves at the beach become taller before they hit the shore—until they break on a continental shelf.
The researchers were also able to devise a mathematical model that describes the movement and formation of these waves. Whereas the model is specific to the Luzon Strait, it can still help researchers understand how internal waves are generated in other places around the world.
Eventually, this information will be incorporated into global climate models, making them more accurate. “It’s very clear, within the context of these [global climate] models, that internal waves play a role in driving ocean circulations,” Peacock says.
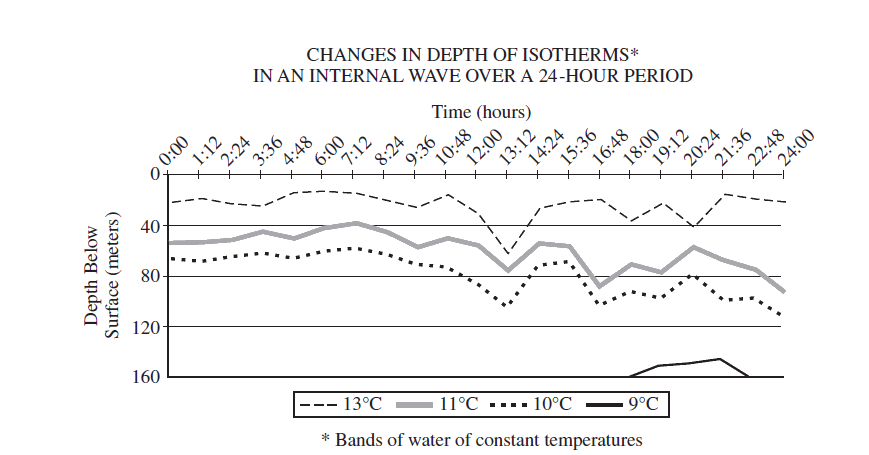
Adapted from Justin Small et al., “Internal Solitons in the Ocean: Prediction from SAR.” ©1998 by Oceanography, Defence Evaluation and Research Agency.
Which choice provides the best evidence for the answer to the previous question?
View SolutionThis passage is adapted from Geoffrey Giller, “Long a Mystery, How 500-Meter-High Undersea Waves Form Is Revealed.” ©2014 by Scientific American.
nearly impossible to see. Unlike other large waves, these rollers, called internal waves, do not ride the ocean surface. Instead, they move underwater, undetectable without the use of satellite imagery or sophisticated monitoring equipment. Despite their hidden nature, internal waves are fundamental parts of ocean water dynamics, transferring heat to the ocean depths and bringing up cold water from below. And they can reach staggering heights—some as tall as skyscrapers.
Because these waves are involved in ocean mixing and thus the transfer of heat, understanding them is crucial to global climate modeling, says Tom Peacock, a researcher at the Massachusetts Institute of Technology. Most models fail to take internal waves into account. “If we want to have more and more accurate climate models, we have to be able to capture processes such as this,” Peacock says.
Peacock and his colleagues tried to do just that. Their study, published in November in Geophysical Research Letters, focused on internal waves generated in the Luzon Strait, which separates Taiwan and the Philippines. Internal waves in this region, thought to be some of the largest in the world, can reach about 500 meters high. “That’s the same height as the Freedom Tower that’s just been built in New York,” Peacock says.
the South China Sea and beyond, they didn’t know exactly how internal waves formed. To find out, Peacock and a team of researchers from M.I.T. and Woods Hole Oceanographic Institution worked with France’s National Center for Scientific Research using a giant facility there called the Coriolis Platform. The rotating platform, about 15 meters (49.2 feet) in diameter, turns at variable speeds and can simulate Earth’s rotation. It also has walls, which means scientists can fill it with water and create accurate, large-scale simulations of various oceanographic scenarios.
Peacock and his team built a carbon-fiber resin scale model of the Luzon Strait, including the islands and surrounding ocean floor topography. Then they filled the platform with water of varying salinity to replicate the different densities found at the strait, with denser, saltier water below and lighter, less briny water above. Small particles were added to the solution and illuminated with lights from below in order to track how the liquid moved. Finally, they re-created tides using two large plungers to see how the internal waves themselves formed.
The Luzon Strait’s underwater topography, with a distinct double-ridge shape, turns out to be responsible for generating the underwater waves. As the tide rises and falls and water moves through the strait, colder, denser water is pushed up over the ridges into warmer, less dense layers above it.
This action results in bumps of colder water trailed by warmer water that generate an internal wave. As these waves move toward land, they become steeper—much the same way waves at the beach become taller before they hit the shore—until they break on a continental shelf.
The researchers were also able to devise a mathematical model that describes the movement and formation of these waves. Whereas the model is specific to the Luzon Strait, it can still help researchers understand how internal waves are generated in other places around the world.
Eventually, this information will be incorporated into global climate models, making them more accurate. “It’s very clear, within the context of these [global climate] models, that internal waves play a role in driving ocean circulations,” Peacock says.
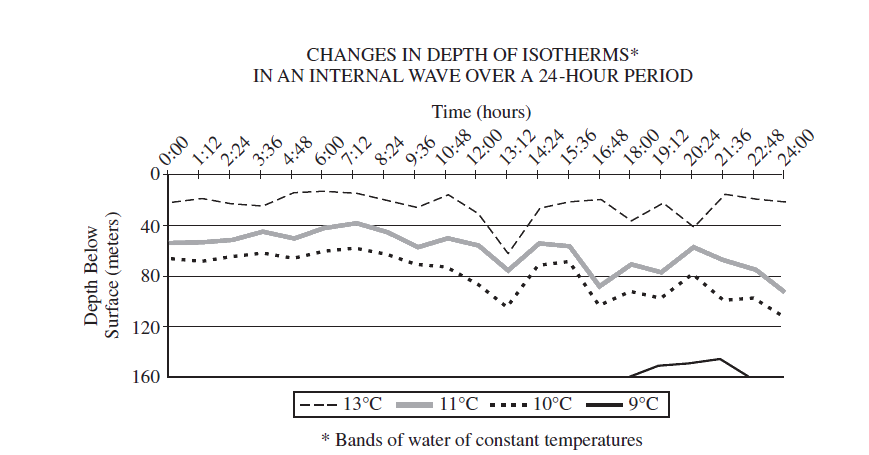
Adapted from Justin Small et al., “Internal Solitons in the Ocean: Prediction from SAR.” ©1998 by Oceanography, Defence Evaluation and Research Agency.
Which concept is supported by the passage and by the information in the graph?
View SolutionThis passage is adapted from Geoffrey Giller, “Long a Mystery, How 500-Meter-High Undersea Waves Form Is Revealed.” ©2014 by Scientific American.
nearly impossible to see. Unlike other large waves, these rollers, called internal waves, do not ride the ocean surface. Instead, they move underwater, undetectable without the use of satellite imagery or sophisticated monitoring equipment. Despite their hidden nature, internal waves are fundamental parts of ocean water dynamics, transferring heat to the ocean depths and bringing up cold water from below. And they can reach staggering heights—some as tall as skyscrapers.
Because these waves are involved in ocean mixing and thus the transfer of heat, understanding them is crucial to global climate modeling, says Tom Peacock, a researcher at the Massachusetts Institute of Technology. Most models fail to take internal waves into account. “If we want to have more and more accurate climate models, we have to be able to capture processes such as this,” Peacock says.
Peacock and his colleagues tried to do just that. Their study, published in November in Geophysical Research Letters, focused on internal waves generated in the Luzon Strait, which separates Taiwan and the Philippines. Internal waves in this region, thought to be some of the largest in the world, can reach about 500 meters high. “That’s the same height as the Freedom Tower that’s just been built in New York,” Peacock says.
the South China Sea and beyond, they didn’t know exactly how internal waves formed. To find out, Peacock and a team of researchers from M.I.T. and Woods Hole Oceanographic Institution worked with France’s National Center for Scientific Research using a giant facility there called the Coriolis Platform. The rotating platform, about 15 meters (49.2 feet) in diameter, turns at variable speeds and can simulate Earth’s rotation. It also has walls, which means scientists can fill it with water and create accurate, large-scale simulations of various oceanographic scenarios.
Peacock and his team built a carbon-fiber resin scale model of the Luzon Strait, including the islands and surrounding ocean floor topography. Then they filled the platform with water of varying salinity to replicate the different densities found at the strait, with denser, saltier water below and lighter, less briny water above. Small particles were added to the solution and illuminated with lights from below in order to track how the liquid moved. Finally, they re-created tides using two large plungers to see how the internal waves themselves formed.
The Luzon Strait’s underwater topography, with a distinct double-ridge shape, turns out to be responsible for generating the underwater waves. As the tide rises and falls and water moves through the strait, colder, denser water is pushed up over the ridges into warmer, less dense layers above it.
This action results in bumps of colder water trailed by warmer water that generate an internal wave. As these waves move toward land, they become steeper—much the same way waves at the beach become taller before they hit the shore—until they break on a continental shelf.
The researchers were also able to devise a mathematical model that describes the movement and formation of these waves. Whereas the model is specific to the Luzon Strait, it can still help researchers understand how internal waves are generated in other places around the world.
Eventually, this information will be incorporated into global climate models, making them more accurate. “It’s very clear, within the context of these [global climate] models, that internal waves play a role in driving ocean circulations,” Peacock says.
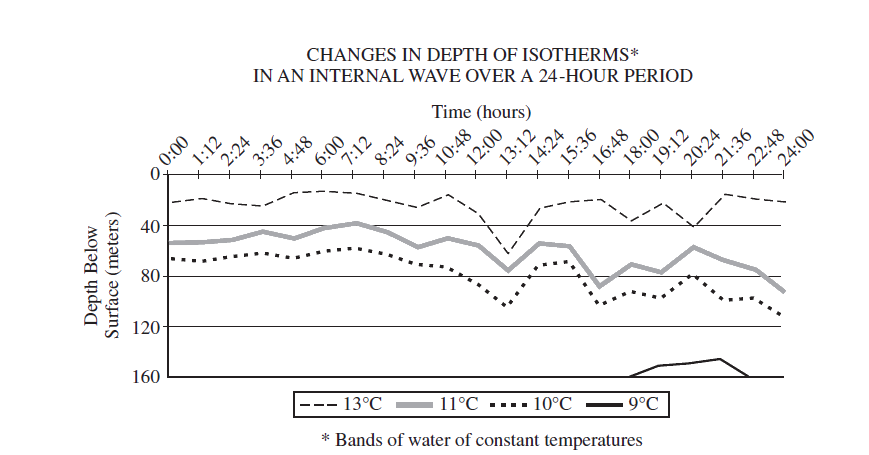
Adapted from Justin Small et al., “Internal Solitons in the Ocean: Prediction from SAR.” ©1998 by Oceanography, Defence Evaluation and Research Agency.
According to Peacock, the ability to monitor internal waves is significant primarily because
View SolutionThis passage is adapted from Geoffrey Giller, “Long a Mystery, How 500-Meter-High Undersea Waves Form Is Revealed.” ©2014 by Scientific American.
nearly impossible to see. Unlike other large waves, these rollers, called internal waves, do not ride the ocean surface. Instead, they move underwater, undetectable without the use of satellite imagery or sophisticated monitoring equipment. Despite their hidden nature, internal waves are fundamental parts of ocean water dynamics, transferring heat to the ocean depths and bringing up cold water from below. And they can reach staggering heights—some as tall as skyscrapers.
Because these waves are involved in ocean mixing and thus the transfer of heat, understanding them is crucial to global climate modeling, says Tom Peacock, a researcher at the Massachusetts Institute of Technology. Most models fail to take internal waves into account. “If we want to have more and more accurate climate models, we have to be able to capture processes such as this,” Peacock says.
Peacock and his colleagues tried to do just that. Their study, published in November in Geophysical Research Letters, focused on internal waves generated in the Luzon Strait, which separates Taiwan and the Philippines. Internal waves in this region, thought to be some of the largest in the world, can reach about 500 meters high. “That’s the same height as the Freedom Tower that’s just been built in New York,” Peacock says.
the South China Sea and beyond, they didn’t know exactly how internal waves formed. To find out, Peacock and a team of researchers from M.I.T. and Woods Hole Oceanographic Institution worked with France’s National Center for Scientific Research using a giant facility there called the Coriolis Platform. The rotating platform, about 15 meters (49.2 feet) in diameter, turns at variable speeds and can simulate Earth’s rotation. It also has walls, which means scientists can fill it with water and create accurate, large-scale simulations of various oceanographic scenarios.
Peacock and his team built a carbon-fiber resin scale model of the Luzon Strait, including the islands and surrounding ocean floor topography. Then they filled the platform with water of varying salinity to replicate the different densities found at the strait, with denser, saltier water below and lighter, less briny water above. Small particles were added to the solution and illuminated with lights from below in order to track how the liquid moved. Finally, they re-created tides using two large plungers to see how the internal waves themselves formed.
The Luzon Strait’s underwater topography, with a distinct double-ridge shape, turns out to be responsible for generating the underwater waves. As the tide rises and falls and water moves through the strait, colder, denser water is pushed up over the ridges into warmer, less dense layers above it.
This action results in bumps of colder water trailed by warmer water that generate an internal wave. As these waves move toward land, they become steeper—much the same way waves at the beach become taller before they hit the shore—until they break on a continental shelf.
The researchers were also able to devise a mathematical model that describes the movement and formation of these waves. Whereas the model is specific to the Luzon Strait, it can still help researchers understand how internal waves are generated in other places around the world.
Eventually, this information will be incorporated into global climate models, making them more accurate. “It’s very clear, within the context of these [global climate] models, that internal waves play a role in driving ocean circulations,” Peacock says.
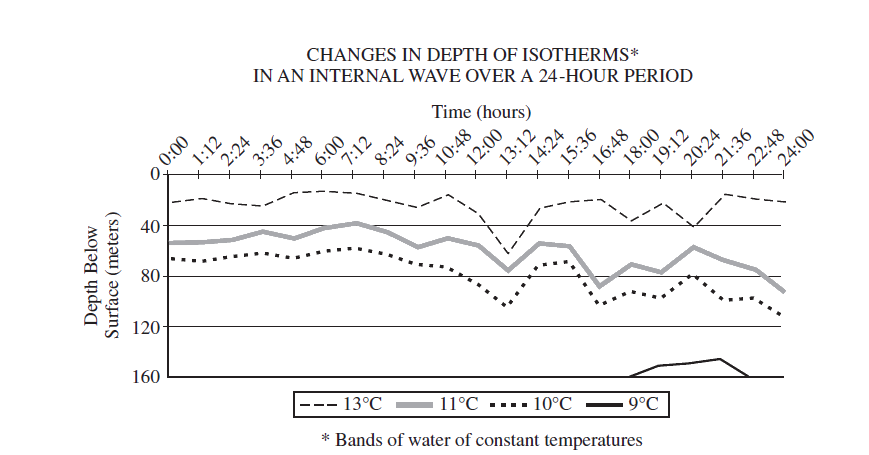
Adapted from Justin Small et al., “Internal Solitons in the Ocean: Prediction from SAR.” ©1998 by Oceanography, Defence Evaluation and Research Agency.
As used in line 19, “capture” is closest in meaning to
View Solution

