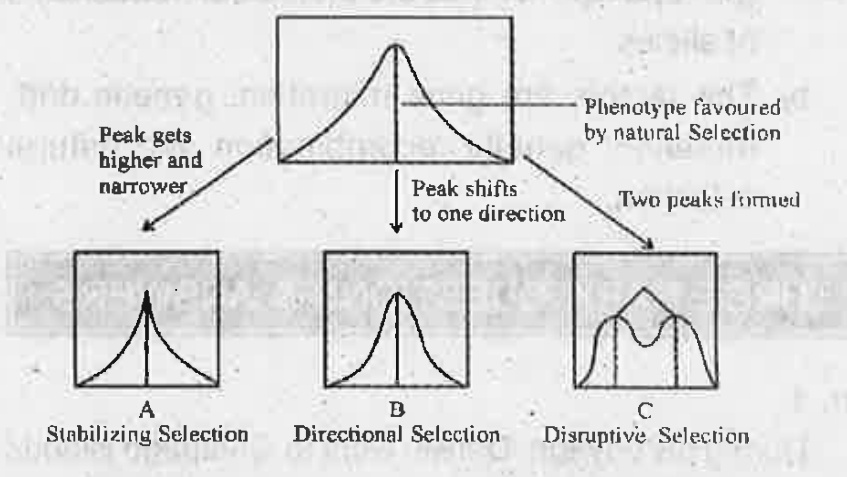
The diagrams shown below represents the operation of natural selection on different traits. Observe the diagrams and answer the following:
Why graph C shows a marked difference from graph A.
 .Solution in Malayalam
Step by step video & image solution for The diagrams shown below represents the operation of natural selection on different traits. Observe the diagrams and answer the following: Why graph C shows a marked difference from graph A. . by Biology experts to help you in doubts & scoring excellent marks in Class 12 exams.
Updated on:21/07/2023Topper's Solved these Questions
Similar Questions
CPCB STAND FOR
View SolutionThe immunoglobulin present in mother's milk is
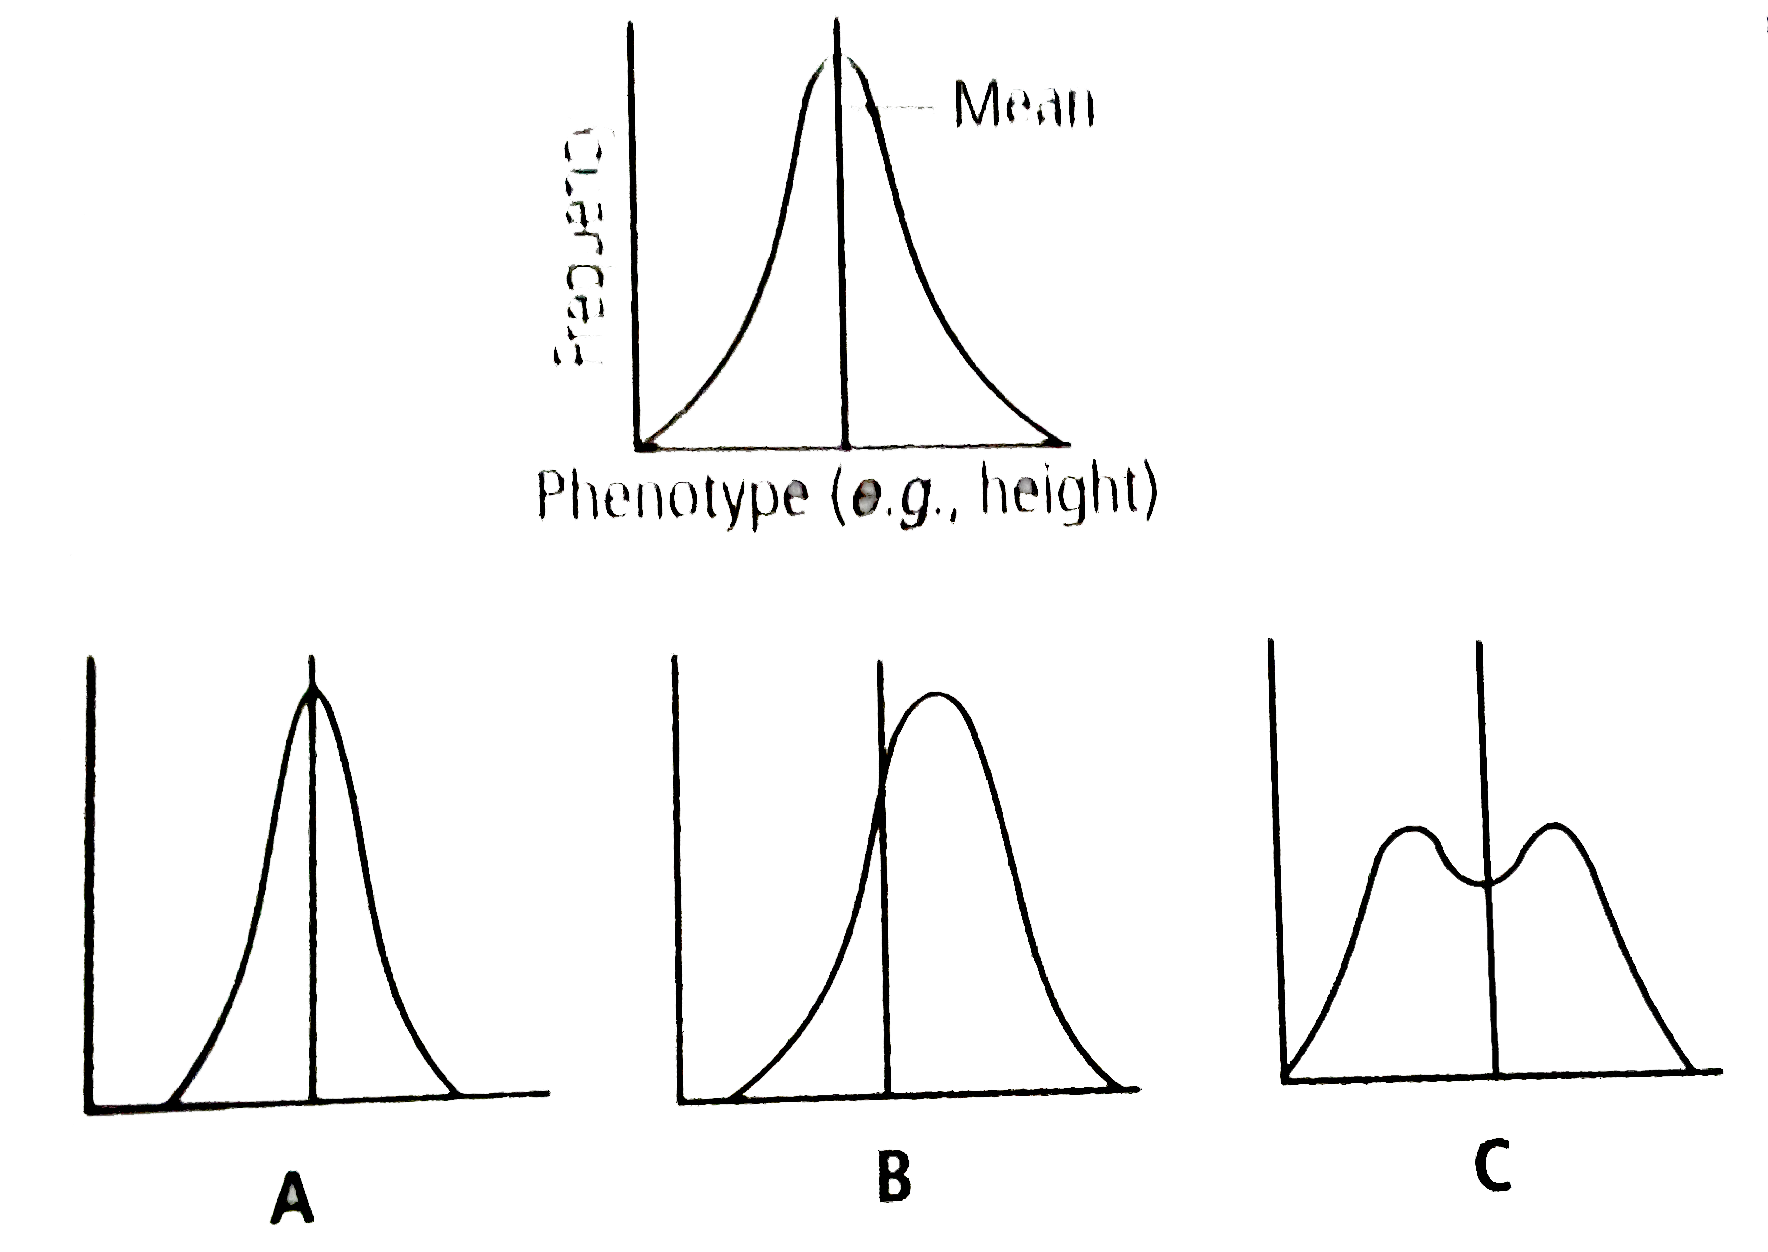
View SolutionFollowing is the digrammatic representation of the operation of natural selection on different traits. Which of the following options correctly identifies all the three graphs A,B and C?
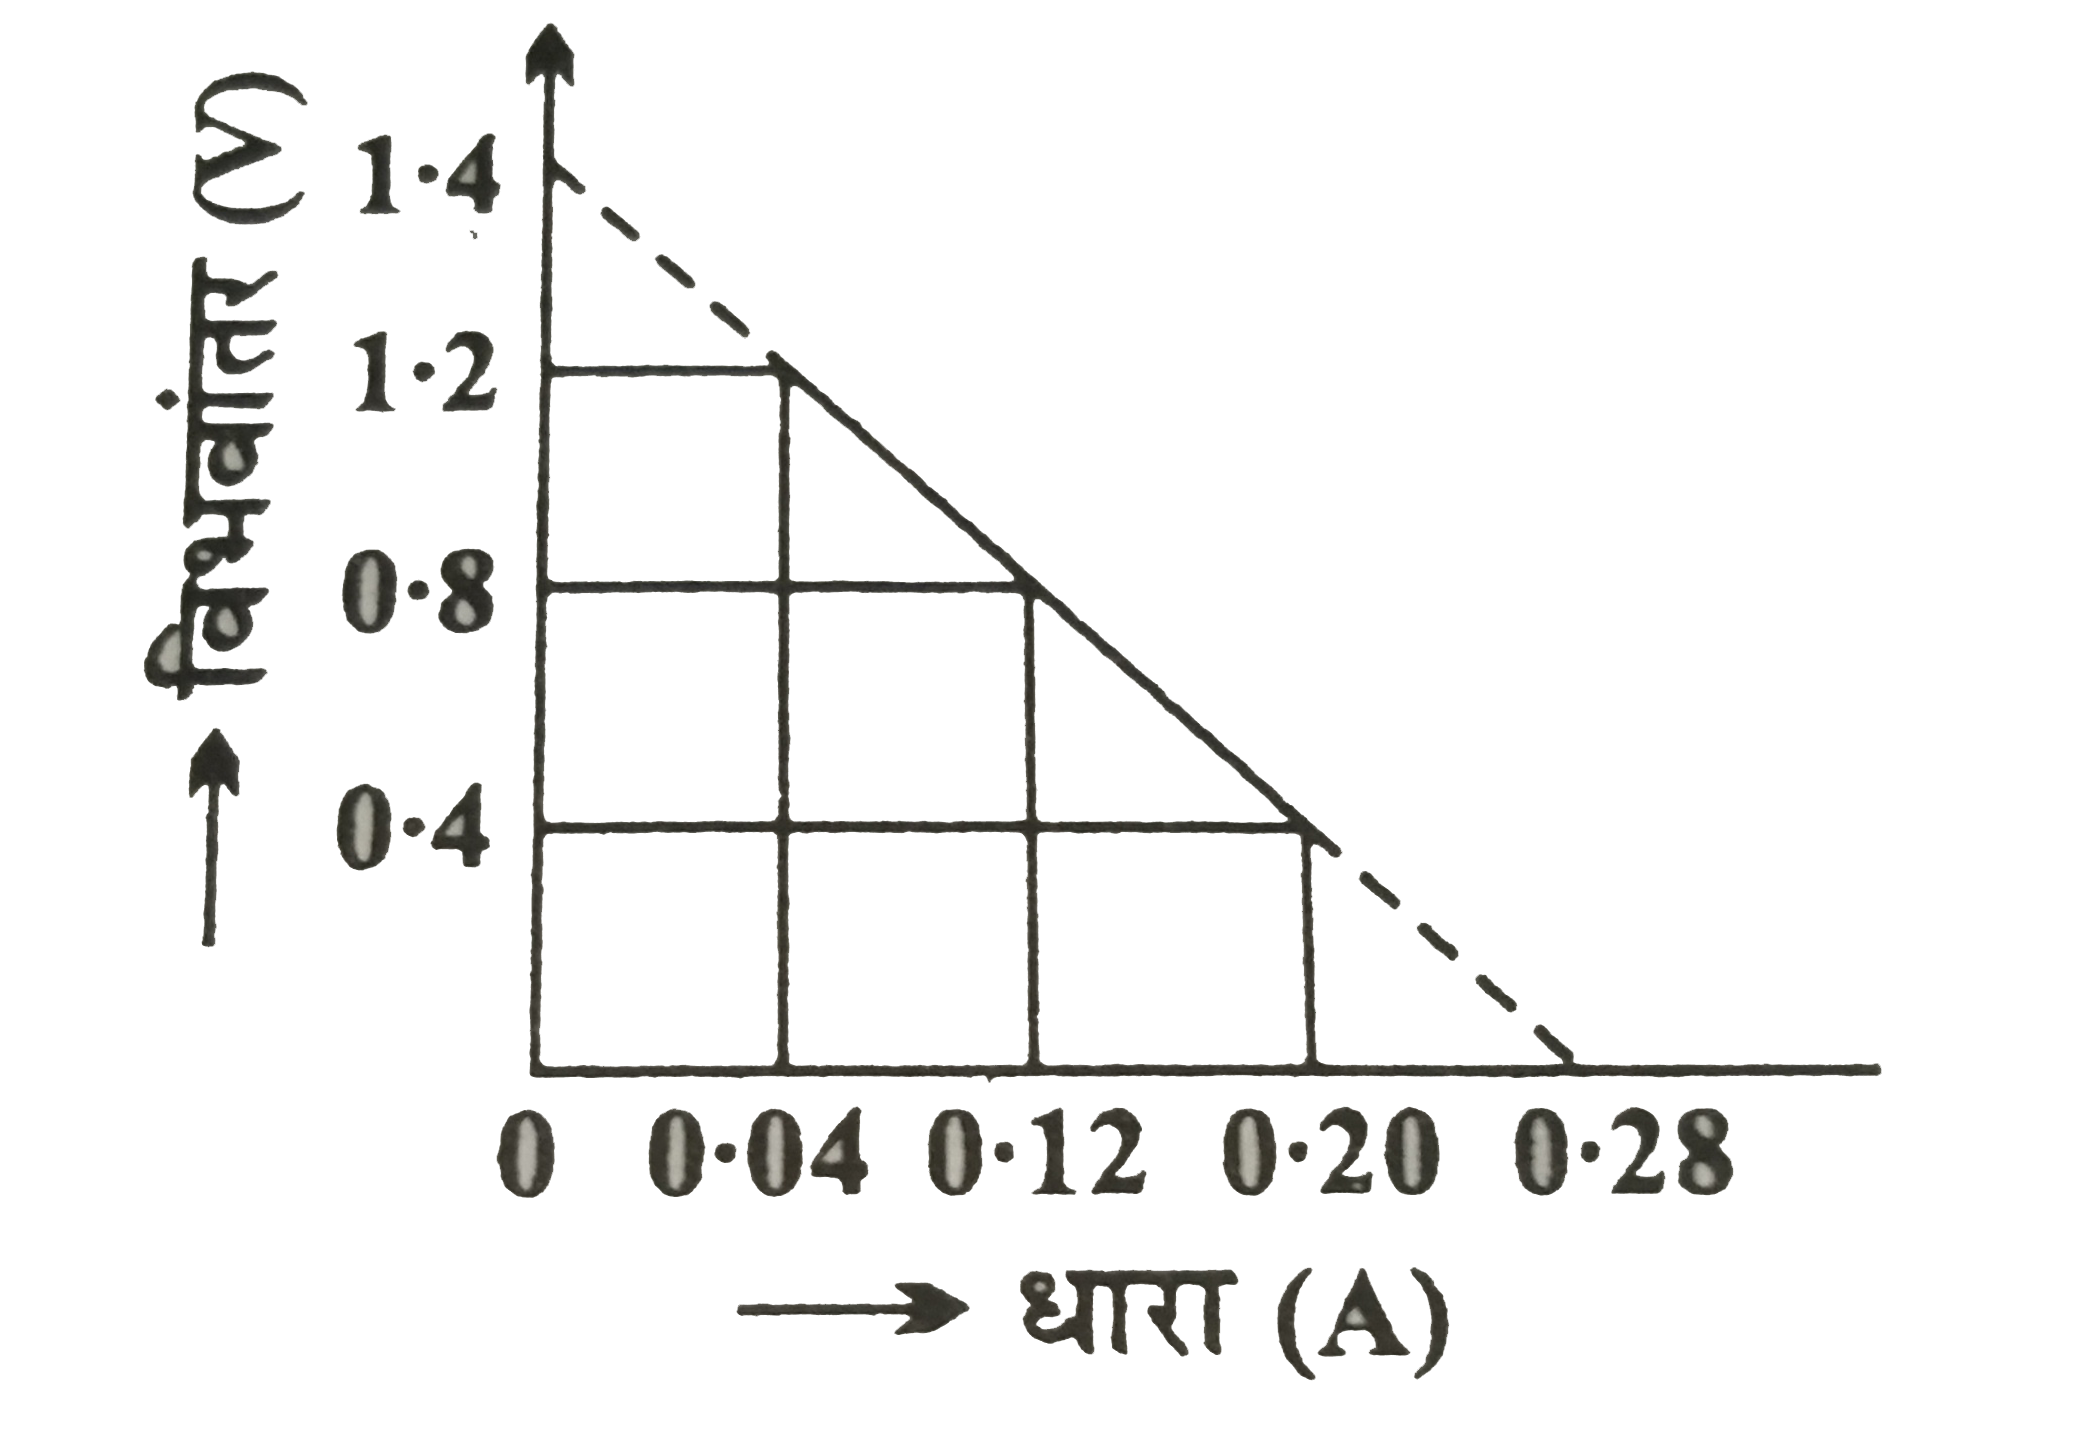
View Solutionचित्र में किसी सेल के टर्मिनल विभवांतर V और उससे ली गई धारा I के बीच ग्राफ प्रदर्शित किया गया है। इस ग्राफ की सहायता से अग्र का निर्धारण कीजिए-
वि. वा. बल
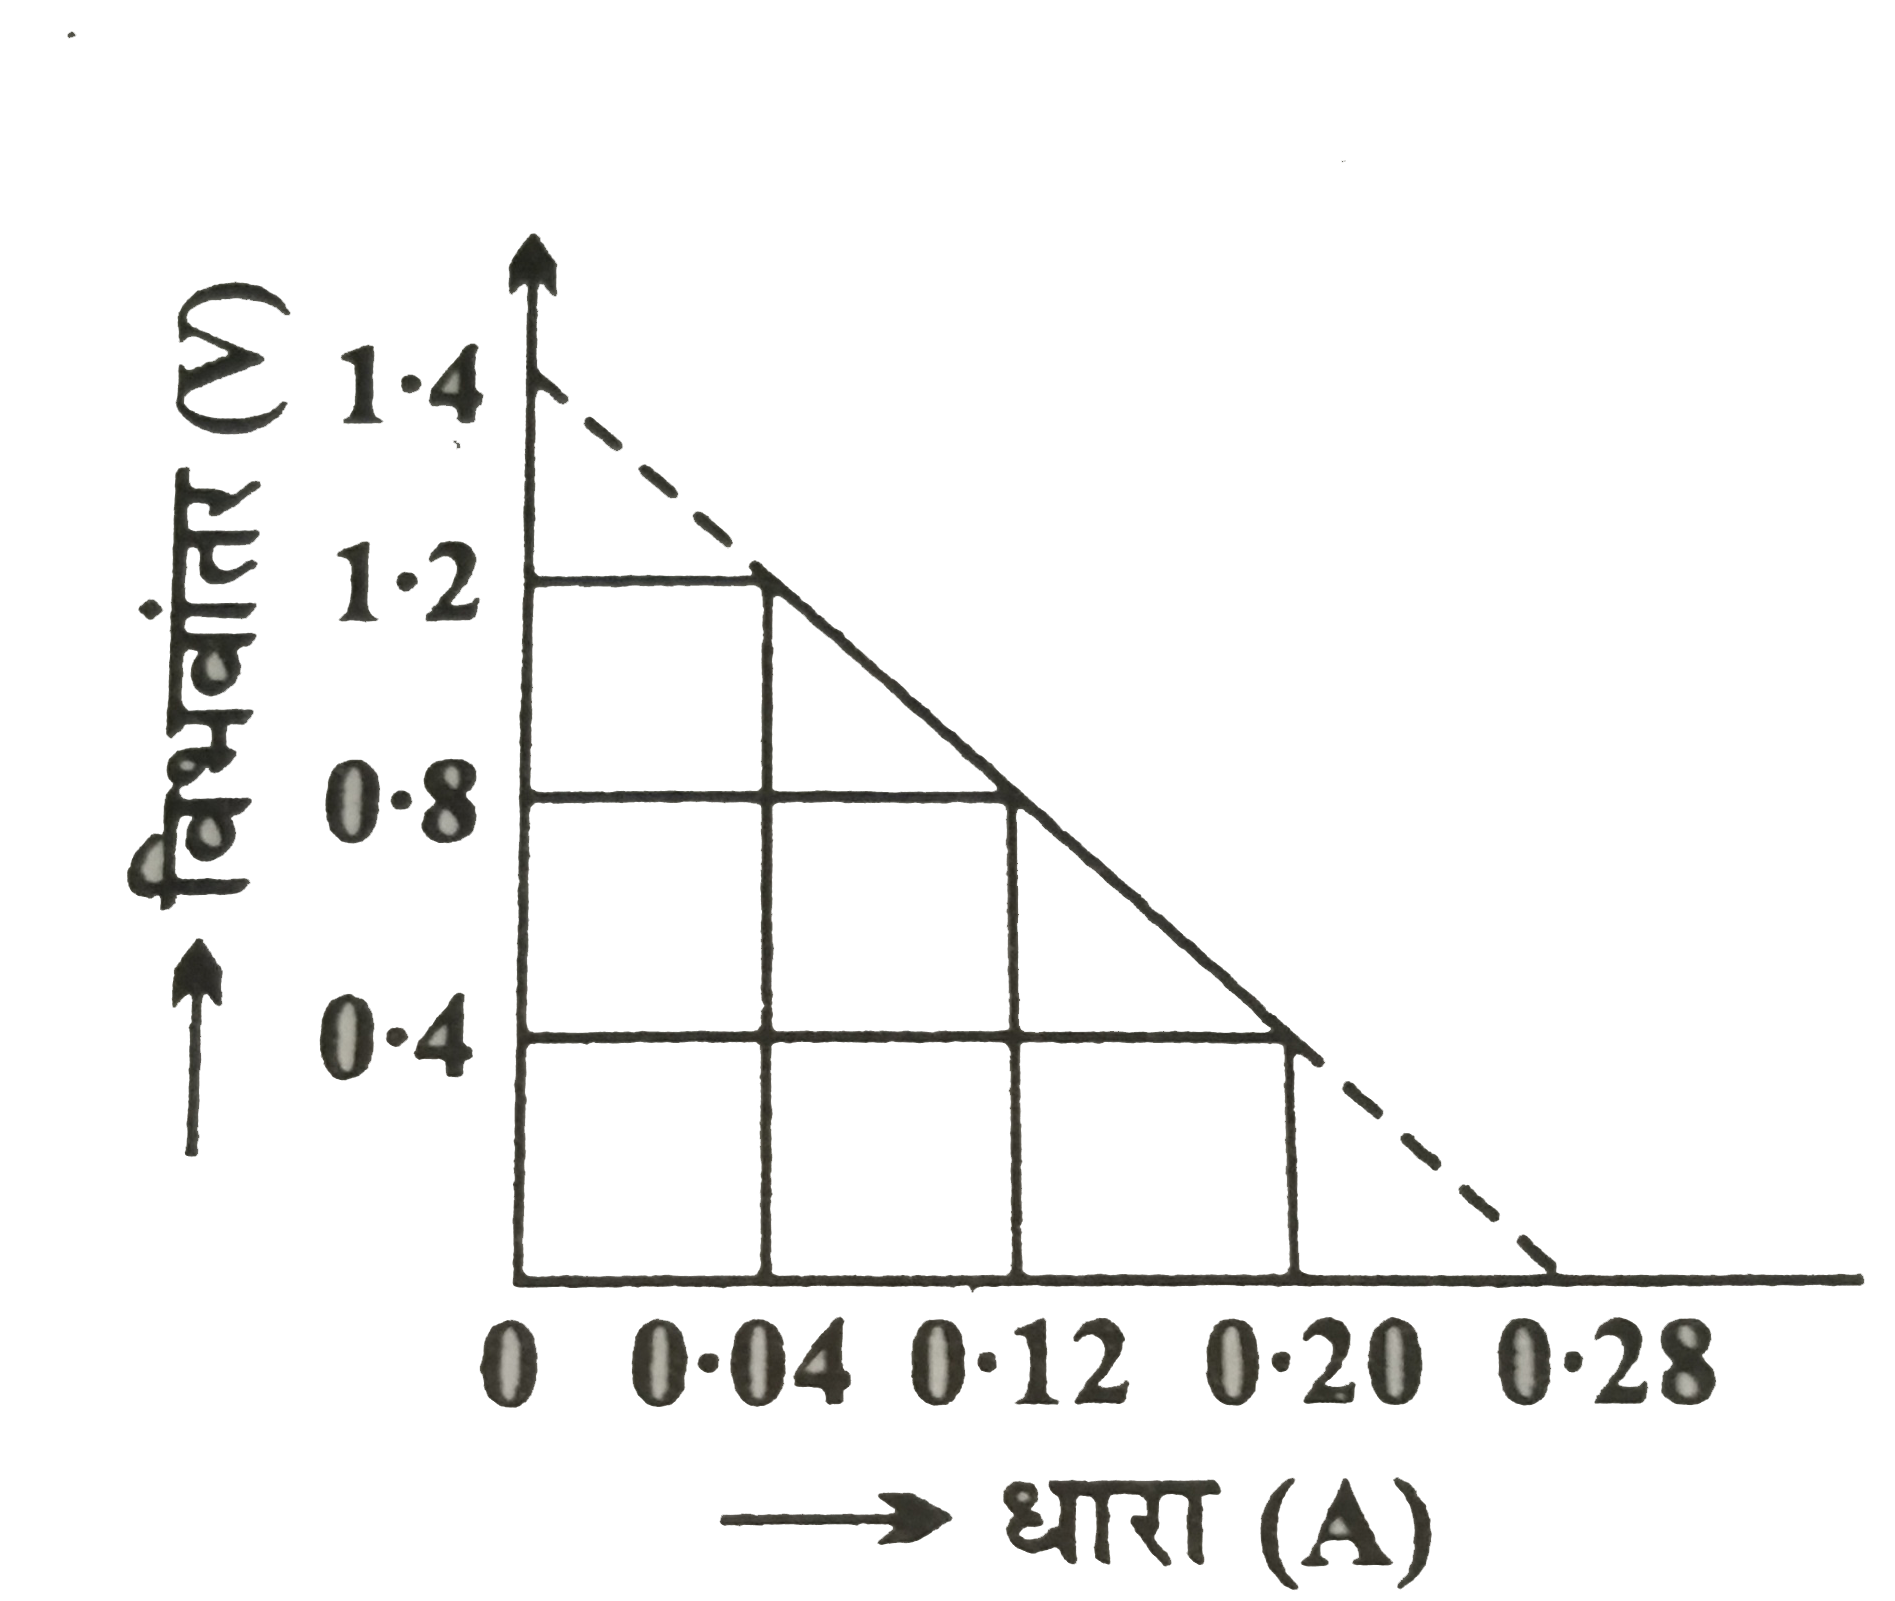
View Solutionचित्र में किसी सेल के टर्मिनल विभवांतर V और उससे ली गई धारा I के बीच ग्राफ प्रदर्शित किया गया है। इस ग्राफ की सहायता से अग्र का निर्धारण कीजिए-
सेल का आंतरिक प्रतिरोध।
View SolutionEllingham diagram represents a graph of
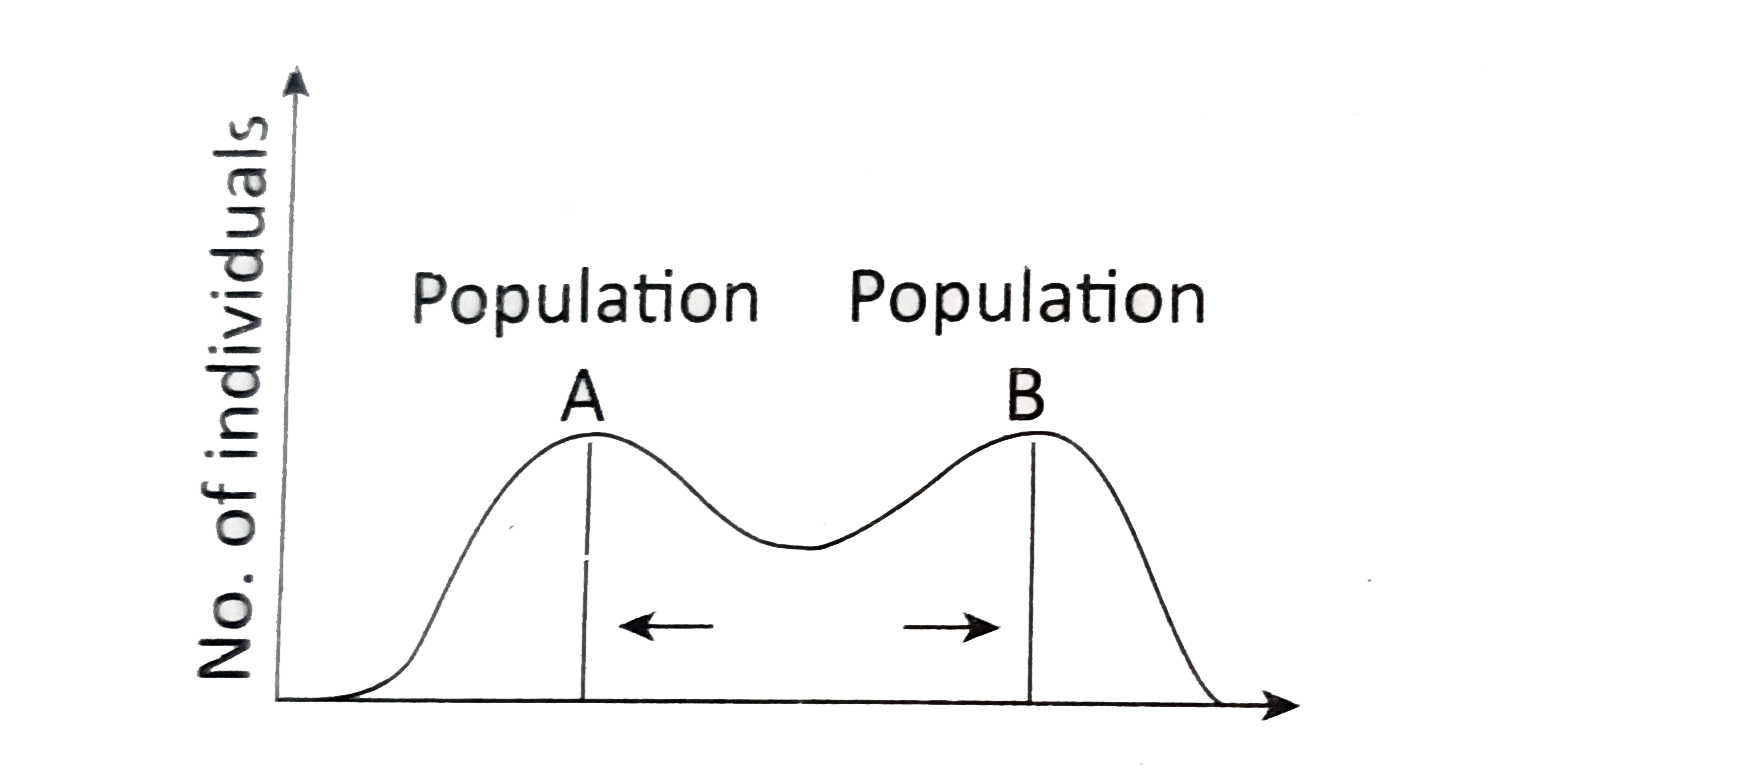
View SolutionObserve the given graph and answer the following question.
(a) Which type of natural selection is represented by the graph?
(b) Under which condition does this type of selection operates.
(c ) Give an example for this type of natural selection.
View SolutionFollowing is the diagrammatic representation of the operation of natural selection on different traits. Which of the following options correctly identifies all the three graphs A, B and C.
View SolutionFollowing is the digrammatic representation of the operation of natural selection on different traits. Which of the following options correctly identifies all the three graphs A,B and C?

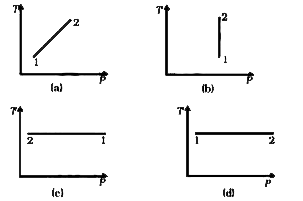
View Solutionदर्शाए गए किसी आदर्श गैस के PV आरेख पर विचार कीजिए।
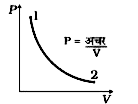 दिए गए आरेखों में से कौन-सा ग्राफ इसके संगत T-P आरेख को निरुपित करता है?
View SolutionThe diagram below shows the method of natural selection on different treets. Which of the following options correctly identifies the three graphs A, B and C?
View SolutionGiven below the diagramatic representation of the operation of natural selection on different traits.
Identify the type of natural selection A,B and C with explanation of each.
View SolutionGiven below is a bar graph showing the heights of six mountain peaks.
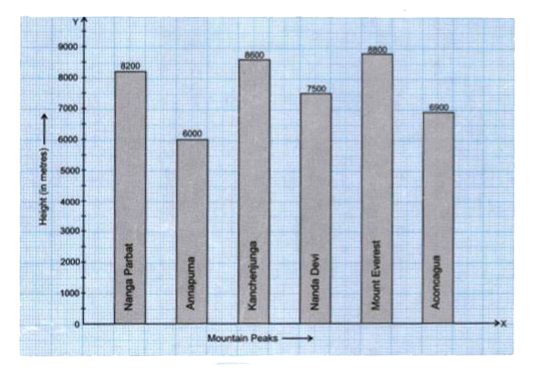
Read the above bar diagram and answer the following questions :
what is information given in the graph
View SolutionGiven above is the bar diagram showing age structure of three different populations. Observe the diagram carefully and answer the following questions. Select the stable population.
View SolutionDiagrams given below represent hearts of three different animals. Observe it and answer the question. Among these, which heart is helpful to the animals that require more energy? Why?
View Solution
