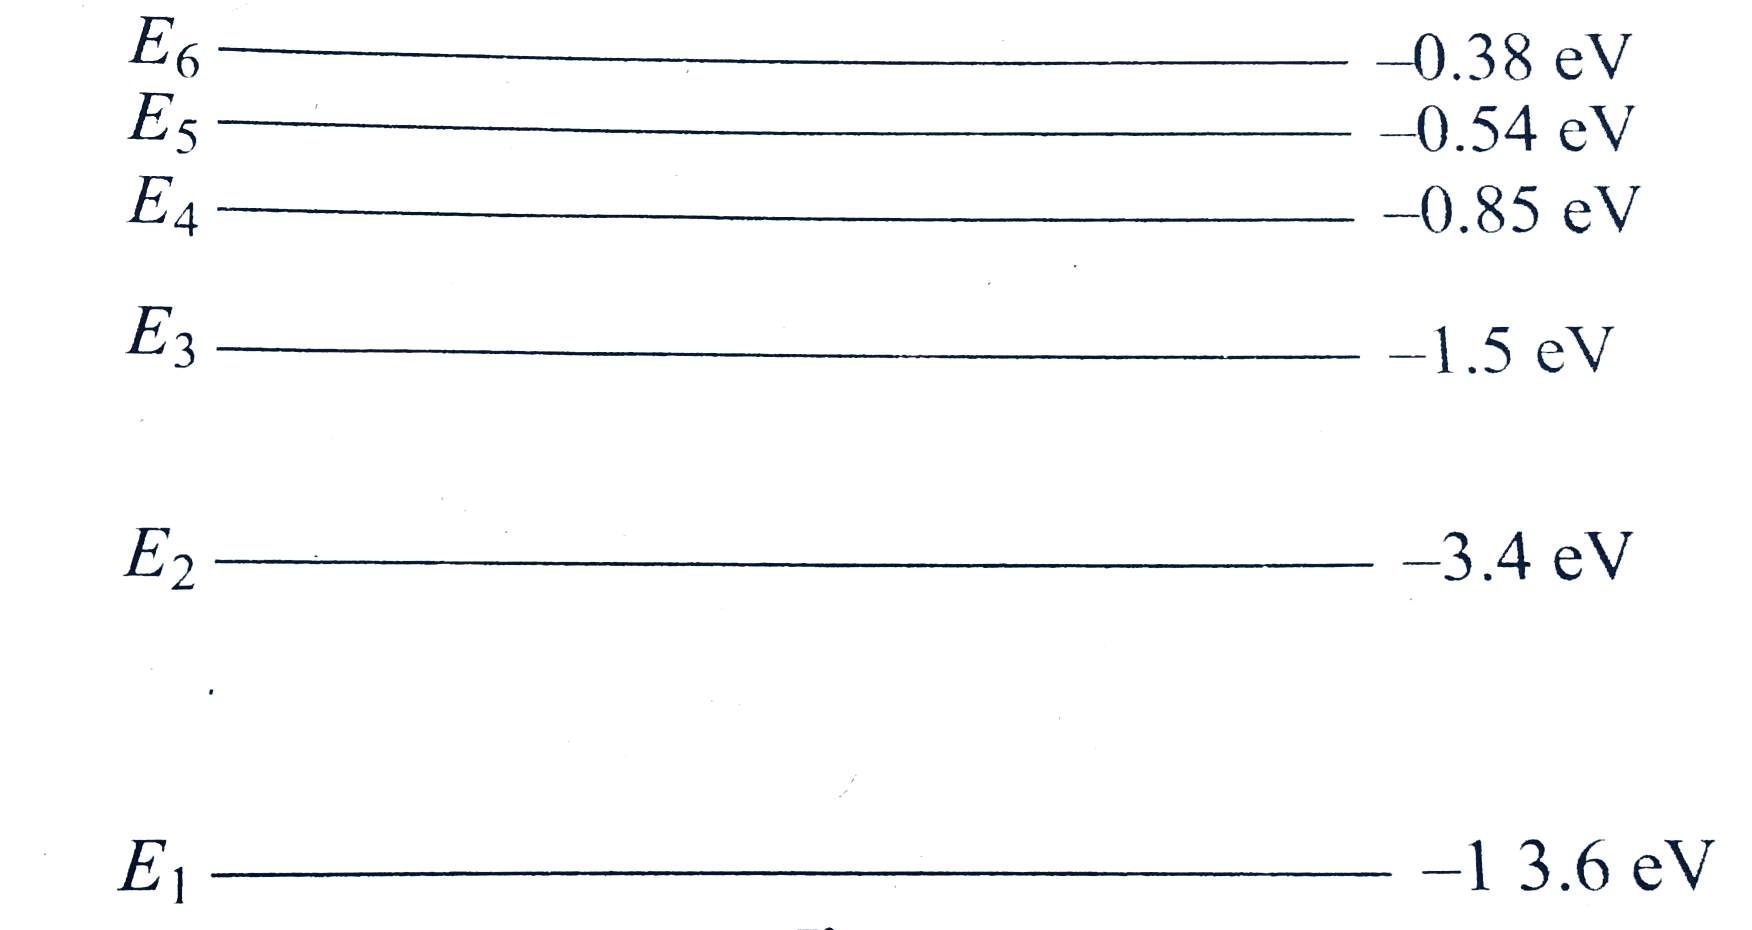
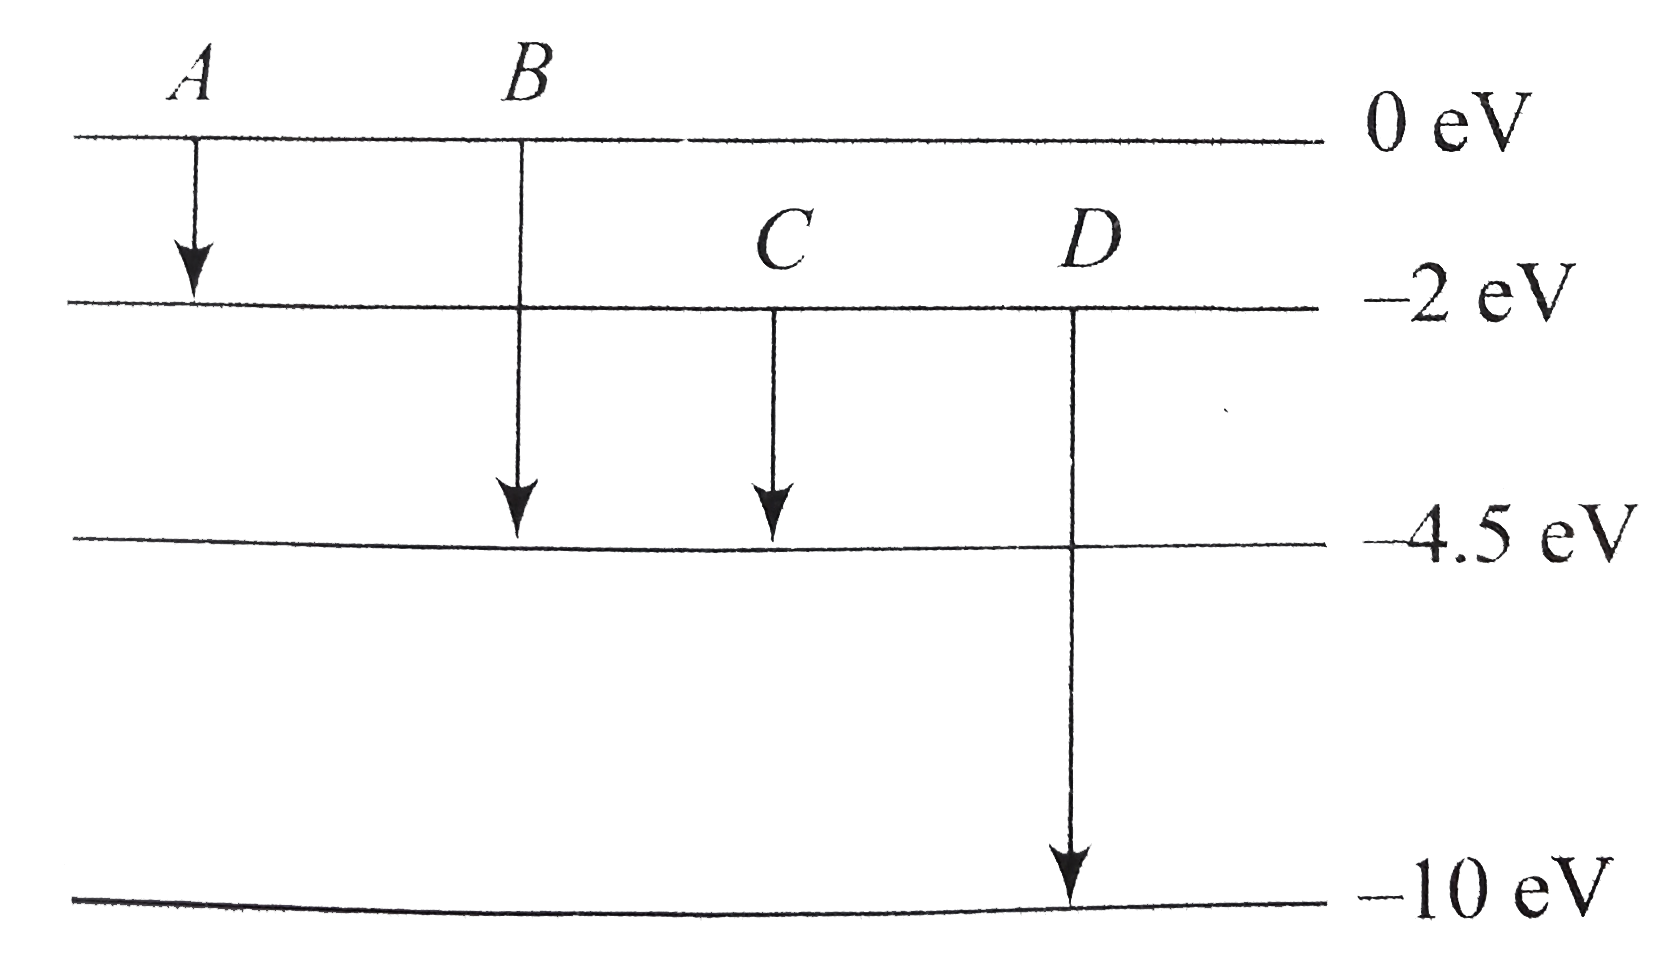
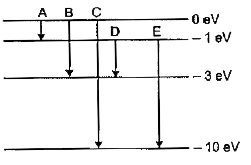
In the following figure the energy levels of hydroge atom have been shown along with some transitions marked A, B,C,D and E.The transitionsy A,B and C respectively represent: 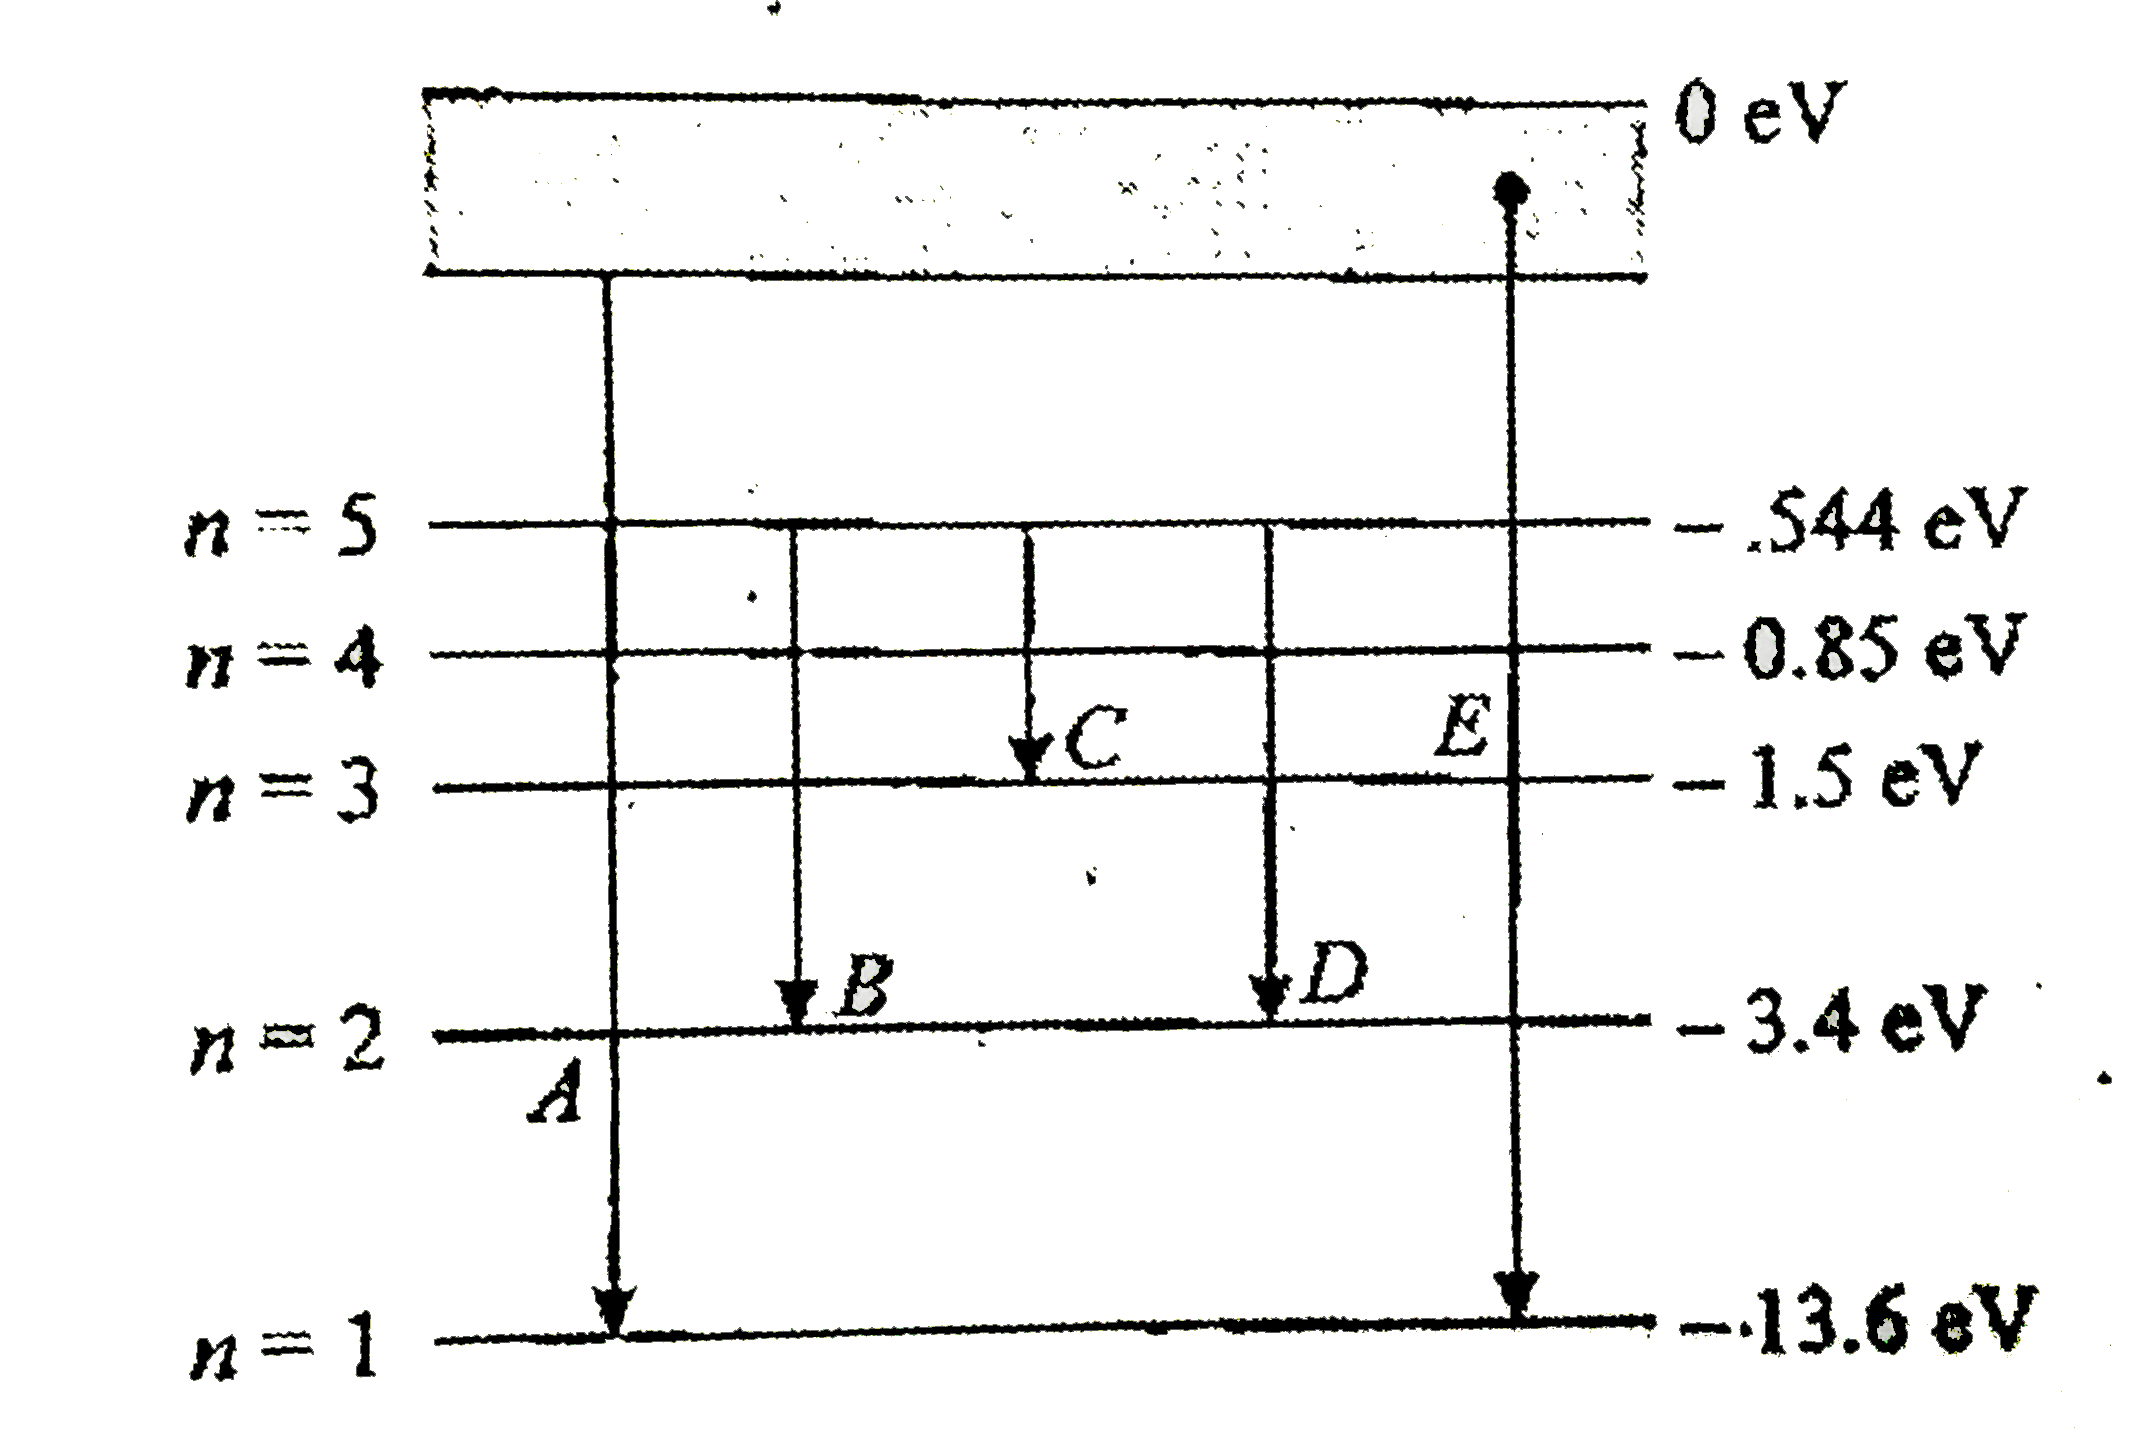
the first member of the Lyman series, third member of Balmer series and second member of Paschen series
the ionisation potential of H, second member of Blamer series and third member of Pachend sereis
the series limit of Lyman series, second member of Balmer series and second member of Paschen series
the series limit of Lyman series, third member of Balmer series and second member of Paschen series
The correct Answer is:D
The transition marked as A represents sseries limit of Lyman series, B represent third member of Balmer series and c represents second of Paschenn series.
Topper's Solved these Questions
- BOOK - DC PANDEY ENGLISHCHAPTER - ATOMSEXERCISE - ASSERTION AND REASON10videos
ATOMS
- BOOK - DC PANDEY ENGLISHCHAPTER - ATOMSEXERCISE - MATCH THE COLUMNS4videos
ATOMS
- BOOK - DC PANDEY ENGLISHCHAPTER - ATOMSEXERCISE - Check point 12.315videos
ATOMS
- BOOK - DC PANDEY ENGLISHCHAPTER - ALTERNATING CURRENTEXERCISE - JEE MAIN62videos
ALTERNATING CURRENT
- BOOK - DC PANDEY ENGLISHCHAPTER - CAPACITORSEXERCISE - OBJECTIVE_TYPE1videos
CAPACITORS
Similar Questions
Knowledge Check
- Question 1 - Select One
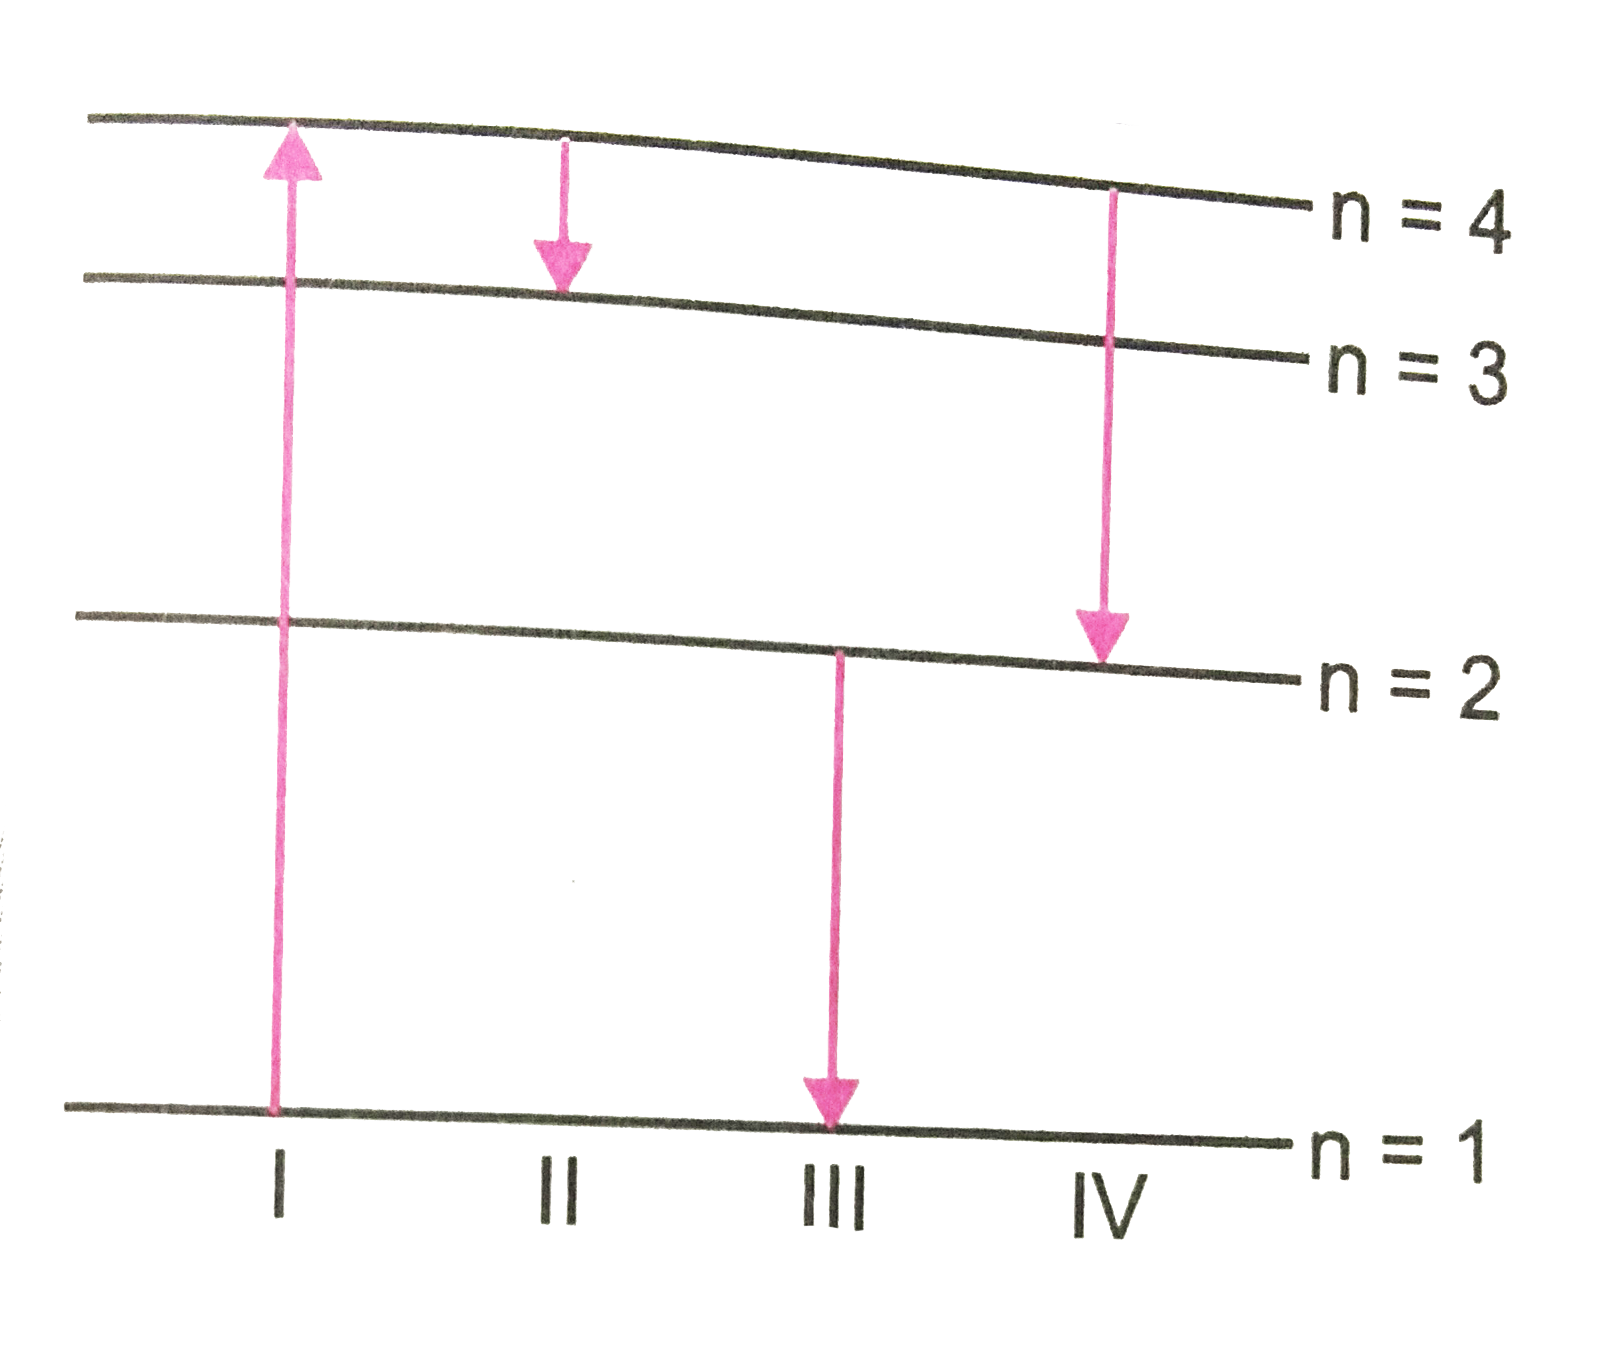
The diagram shows the energy levels for an electron in a certain atom. Which transition shown represents the emission of photon with the most enegy ?
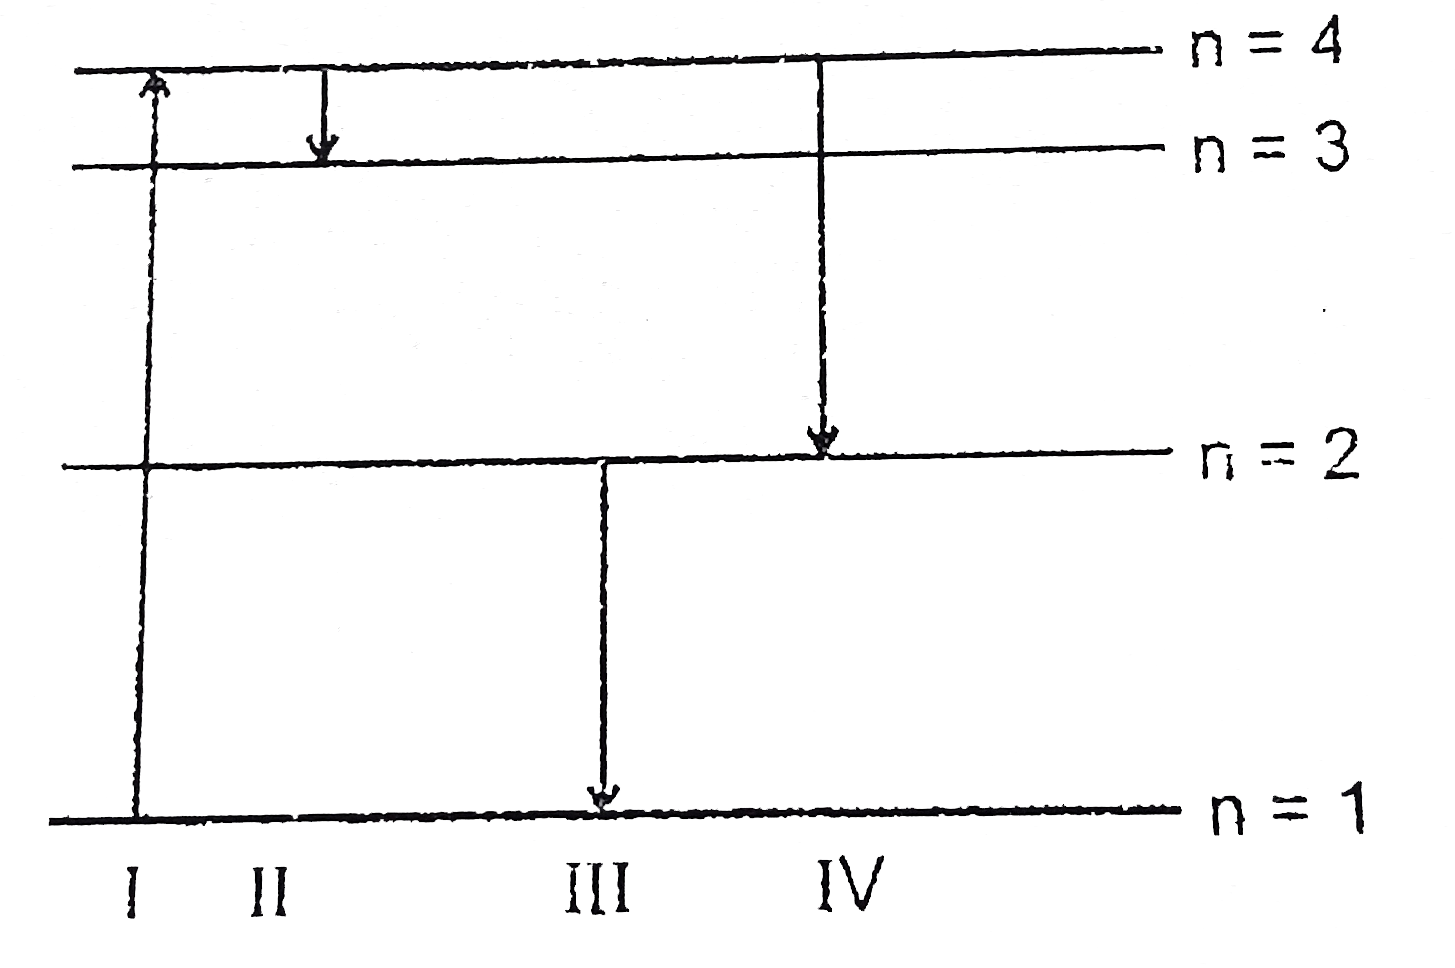 AIBIICIIIDIV
The energy levels of an atom are as shown in figure . Which one of those transition will result in the emission of a photon of wavelength 275nm?
 View Solution
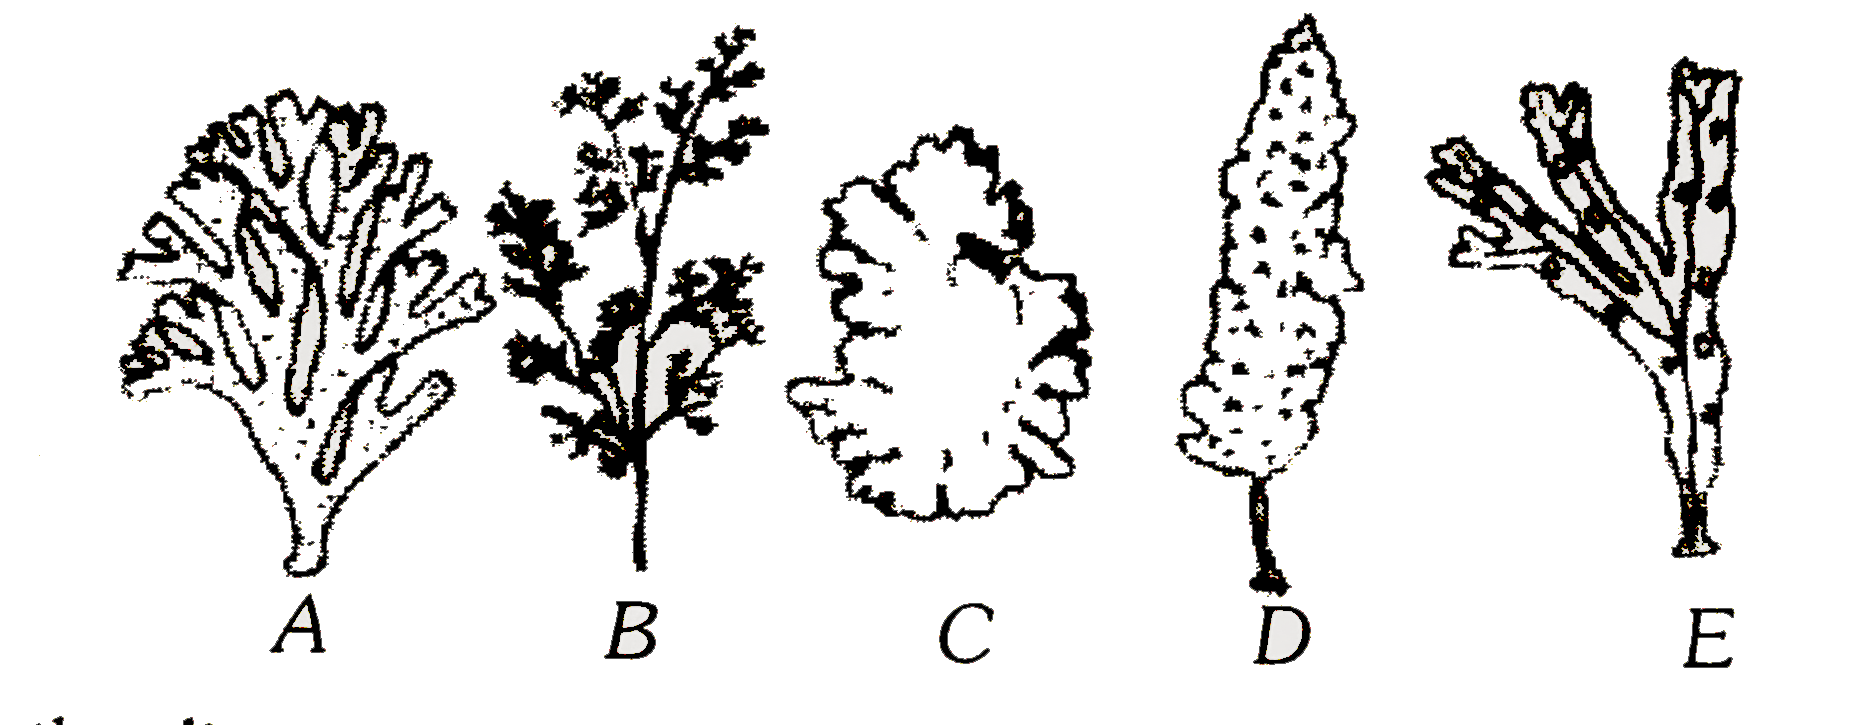 In the diagram given above, some of the algae have been labelled as 'A','B','C','D' and 'E' These are respectively identified as View Solution
Shows the energy levels for an electron in a certain atom. Which transition shown represented the emission of a photon with the most energy?
 View Solution
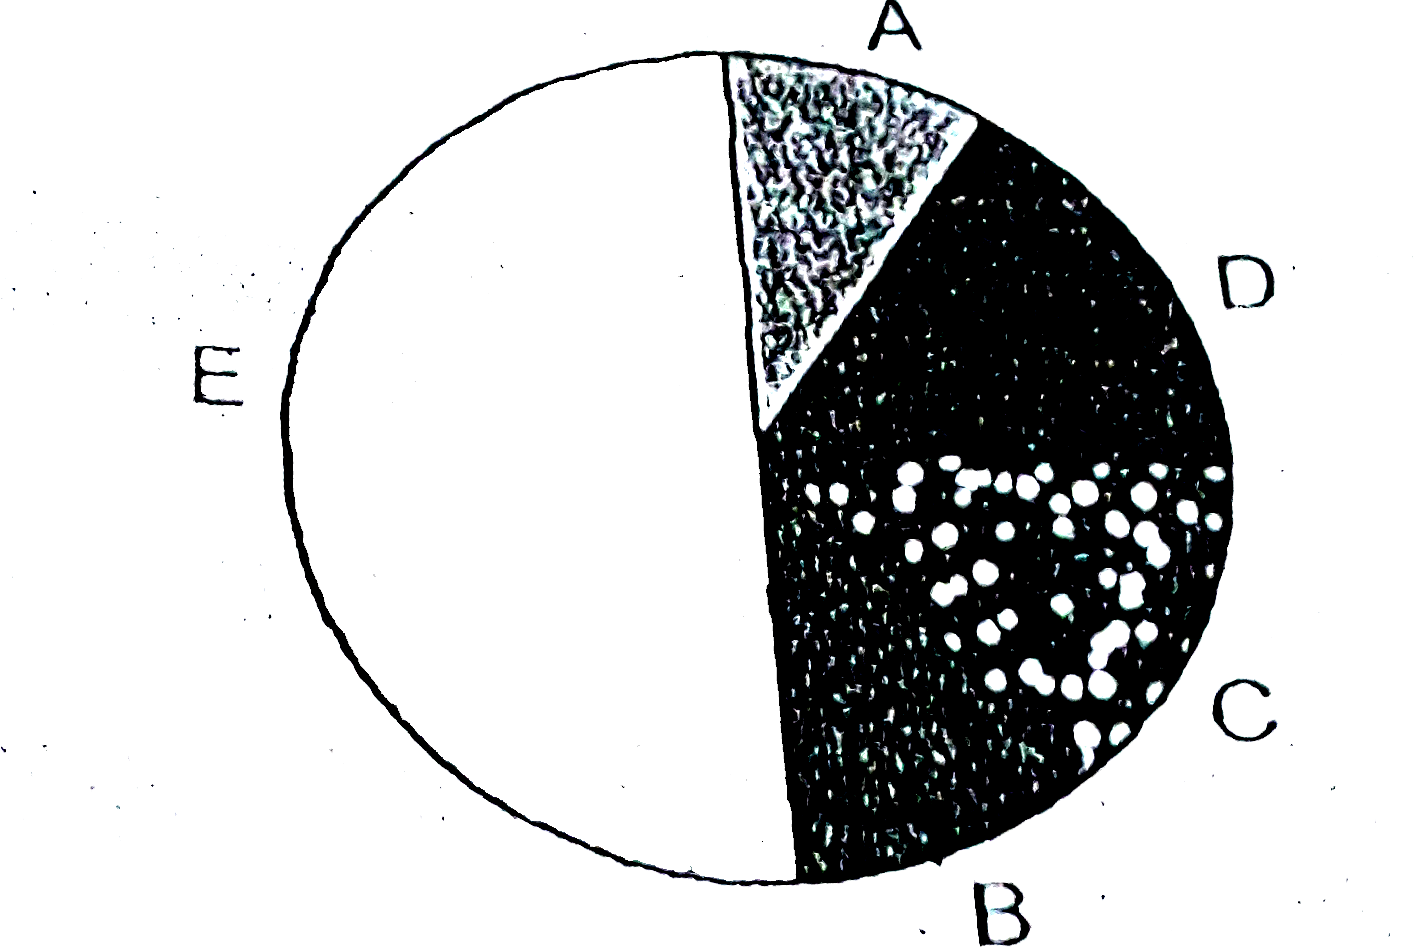
In the following pie chart of global vertebrate diversity, what does A,B,C,D and E represent respectively?
 View Solution
The diagram shows the energy levels for an electron in a certain atom. Which transition shown represents the emission of photon with the most enegy ?
 View Solution
The energy levels of an atom of a certain element are shown in the given figure below. Which one of the transitions A, B, C, D or E will result in the emission of photons of electromagnetic radiation of wavelength 618.75 nm ? Support your answer with mathematical calculations.
 View Solution
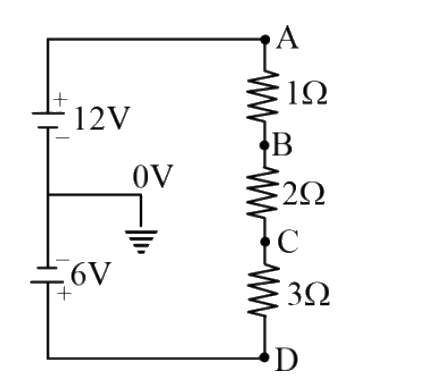
In the circuit diagram shown in Figure , the potentials of the points B, C and D are respectively -
 View Solution

