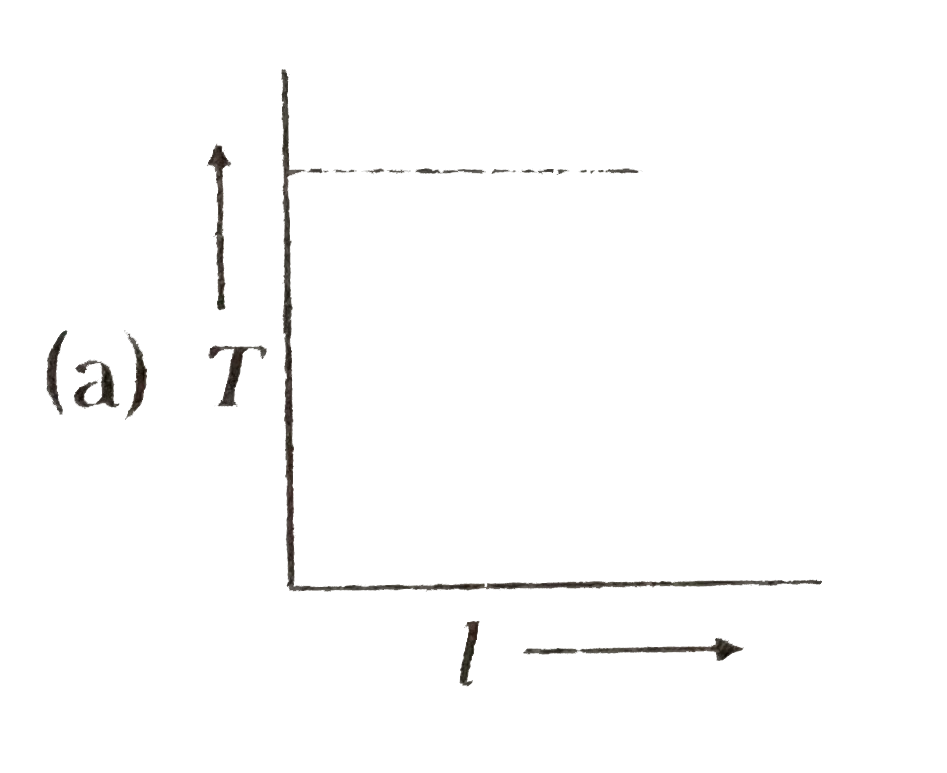
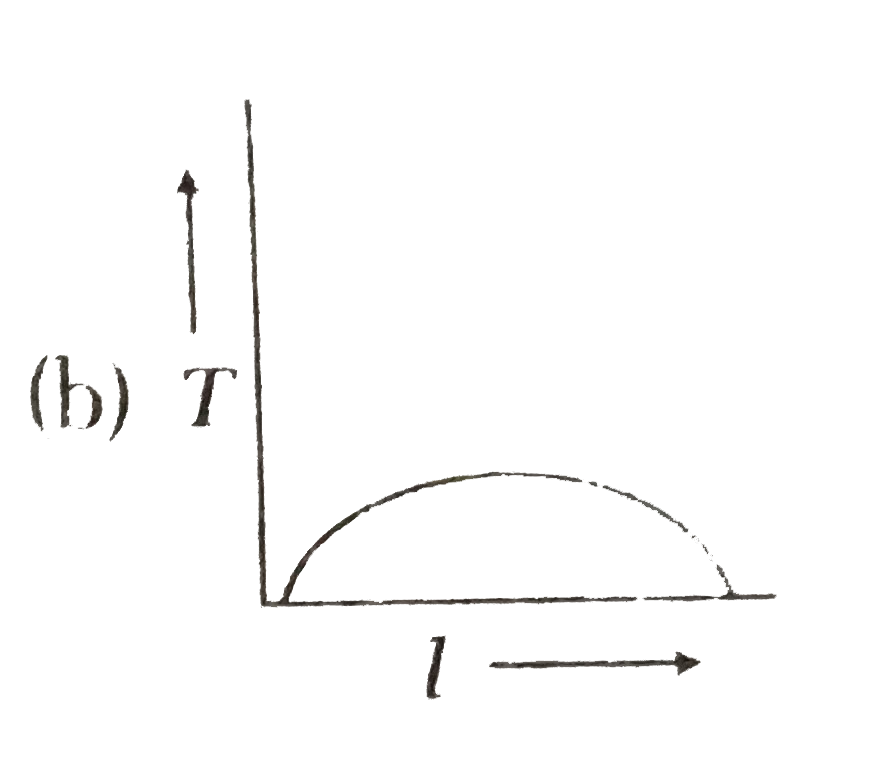
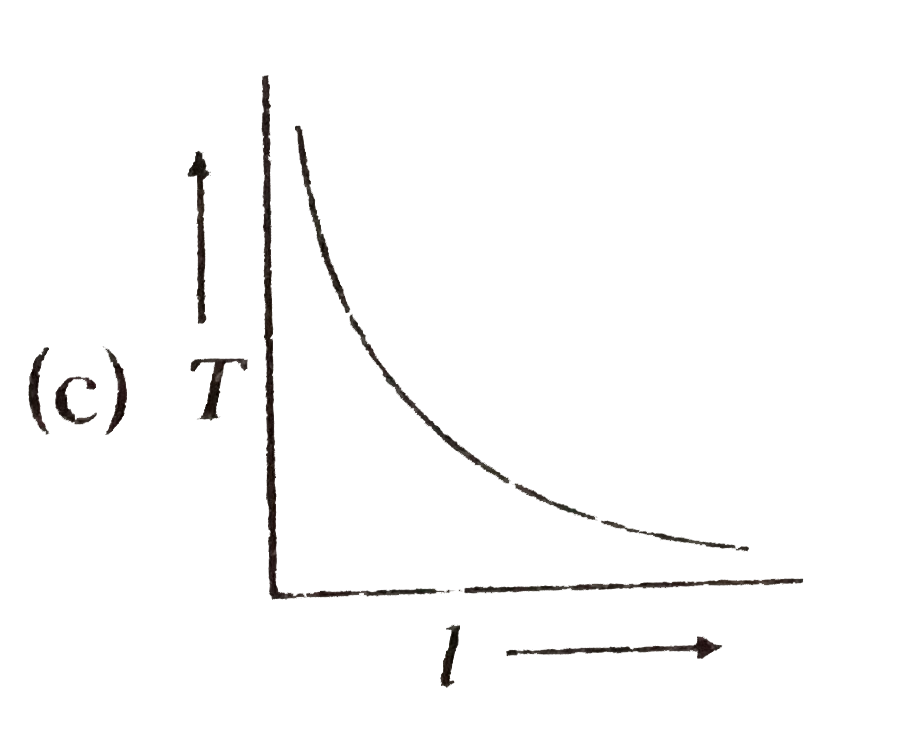
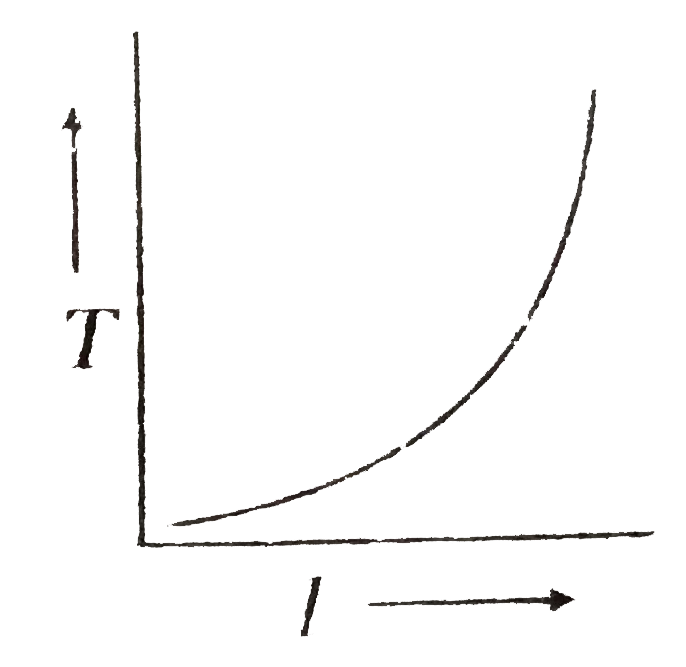
In case of a simple pendulum, time period versus length is depicted by


The correct Answer is:B
To find the relationship between the time period (T) and the length (L) of a simple pendulum, we start with the formula for the time period of a simple pendulum:
T=2π√Lg
Where:
- T is the time period,
- L is the length of the pendulum,
- g is the acceleration due to gravity (approximately 9.8m/s2).
Step 1: Rearranging the Formula
We can express the time period T in terms of L:
T=2π√Lg
Step 2: Identifying Variables
In this equation:
- T is the dependent variable (y-axis),
- L is the independent variable (x-axis).
Step 3: Expressing T in Terms of L
We can rewrite the equation to highlight the relationship between T and L:
T=2π⋅1√g⋅√L
Step 4: Identifying the Form of the Equation
This equation can be expressed in the form of y=mx1/2, where:
- y=T,
- x=L,
- m=2π⋅1√g.
Step 5: Squaring Both Sides
To find a linear relationship, we can square both sides:
T2=(2π⋅1√g)2⋅L
This gives us:
T2=4π2g⋅L
Step 6: Identifying the Graph
This equation T2=kL (where k=4π2g) is a linear equation in terms of T2 and L. However, if we plot T versus L, it will yield a parabolic shape because T is proportional to the square root of L.
Conclusion
Thus, the graph of the time period T versus the length L of a simple pendulum is a parabola opening upwards in the first quadrant.
The correct answer is option B, which depicts a parabolic relationship.
---
- T is the time period,
- L is the length of the pendulum,
- g is the acceleration due to gravity (approximately 9.8m/s2).
We can express the time period T in terms of L:
In this equation:
- T is the dependent variable (y-axis),
- L is the independent variable (x-axis).
We can rewrite the equation to highlight the relationship between T and L:
This equation can be expressed in the form of y=mx1/2, where:
- y=T,
- x=L,
- m=2π⋅1√g.
To find a linear relationship, we can square both sides:
This equation T2=kL (where k=4π2g) is a linear equation in terms of T2 and L. However, if we plot T versus L, it will yield a parabolic shape because T is proportional to the square root of L.
Thus, the graph of the time period T versus the length L of a simple pendulum is a parabola opening upwards in the first quadrant.
Similar Questions
The time period of oscillations of a simple pendulum is 1 minute. If its length is increased b 44% then its new time period of oscillation will be
View SolutionThe time period of a simple pendulum is 2s. If its length is increased by 4 times, then its period becomes
(a) 16s (b) 12s (c) 8s (d) 4s
View SolutionThe time period of oscillation of a simple pendulum is √2s. If its length is decreased to half of initial length, then its new period is
View SolutionState how does the time period of a simple pendulum depend on length of pendulum.
View SolutionHow would the time period of a simple pendulum be affected if (a) the length is doubled (b) the amplitude is doubled ?
View SolutionWhat is the period of a simple pendulum whose length is 50 cm?
View SolutionThe time period of a simple pendulum of length 9.8 m is
View SolutionIn a simple pendulum the period of oscillation (T) is related to the length of the pendulum (L) as
View SolutionA simple pendulum of length L has a period T. If length is changed by ΔL, the change in period ΔT is proportional to
View SolutionIn an experiment of simple pendulum, the errors in the measurement of length of the pendulum (L) and time period (T) are 3% and 2% respectively. The maximum percentage error in the value of L/T2 is
View Solution

