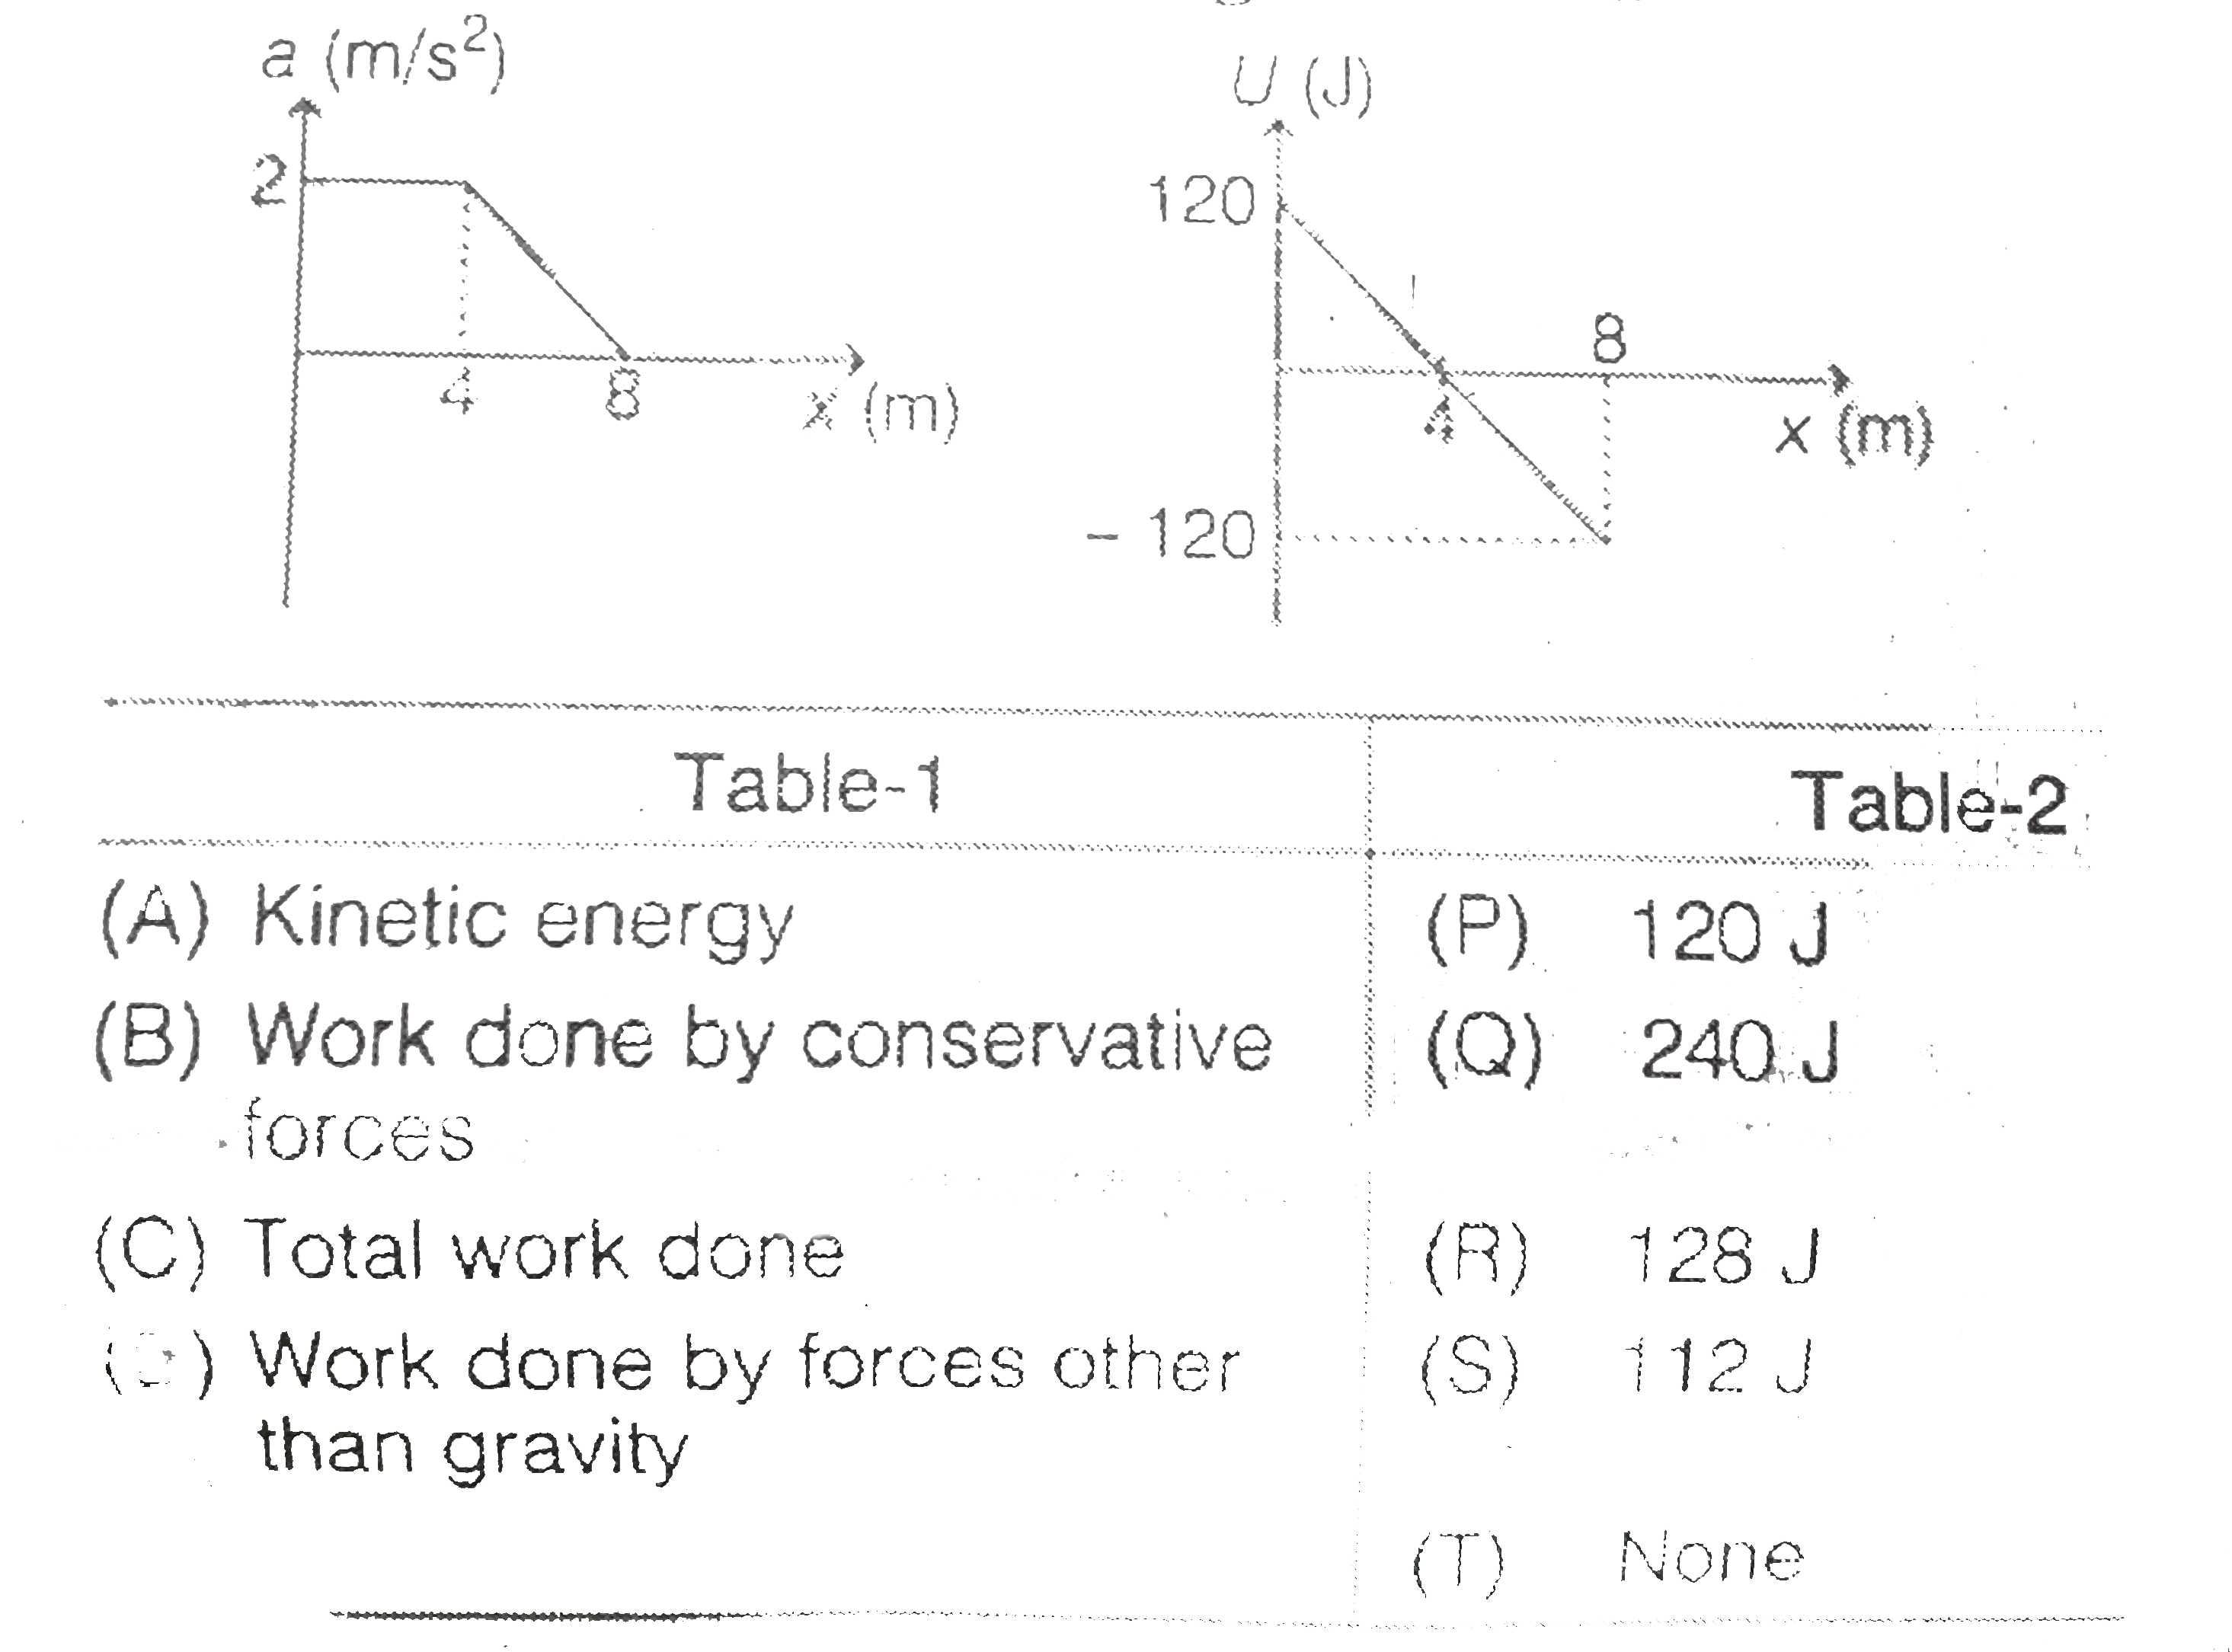
Acceleration versus x and potential energy versus x graph of a particle moving along x-axis is as shown in figure. Mass of the particle is 1 kg and velocity at x = 0 is 4m/s. Match the following at x = 8 m.
The correct Answer is:(A→s,B→q,C→p,D→r)
vf−vi=area of a-s graph=12 ms−1
∴Vf=12+4=16ms−1
ΔKE=12m(v2f−v2i)=120J
Work done by all the forces =ΔKE=120J
Kf=12mv2f=128J
Work done conservative forces =Ui−Uf=240J
Work done by external force
=total work done -work done by conservative forces
=-112J
Topper's Solved these Questions
- WORK, ENERGY AND POWERBook:DC PANDEY ENGLISHChapter:WORK, ENERGY AND POWERExercise:MEDICAL ENTRACES GALLERY
Explore 33 Videos
- WORK, ENERGY AND POWERBook:DC PANDEY ENGLISHChapter:WORK, ENERGY AND POWERExercise:MEDICAL ENTRANCE SPECIAL QUESTIONS
Explore 16 Videos
- WORK, ENERGY & POWERBook:DC PANDEY ENGLISHChapter:WORK, ENERGY & POWERExercise:Level 2 Comprehension Based
Explore 2 Videos
- WORK, POWER AND ENERGYBook:DC PANDEY ENGLISHChapter:WORK, POWER AND ENERGYExercise:E Integer Type Questions
Explore 11 Videos
Similar Questions
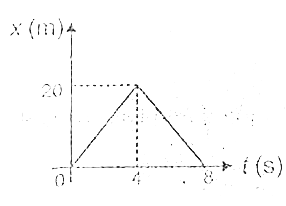
The x-t graph of a particle moving along a straight line is shown in figure

The v-t graph of the particle is correctly shown by
View SolutionThe x-t graph of a particle moving along a straight line is shown in figure
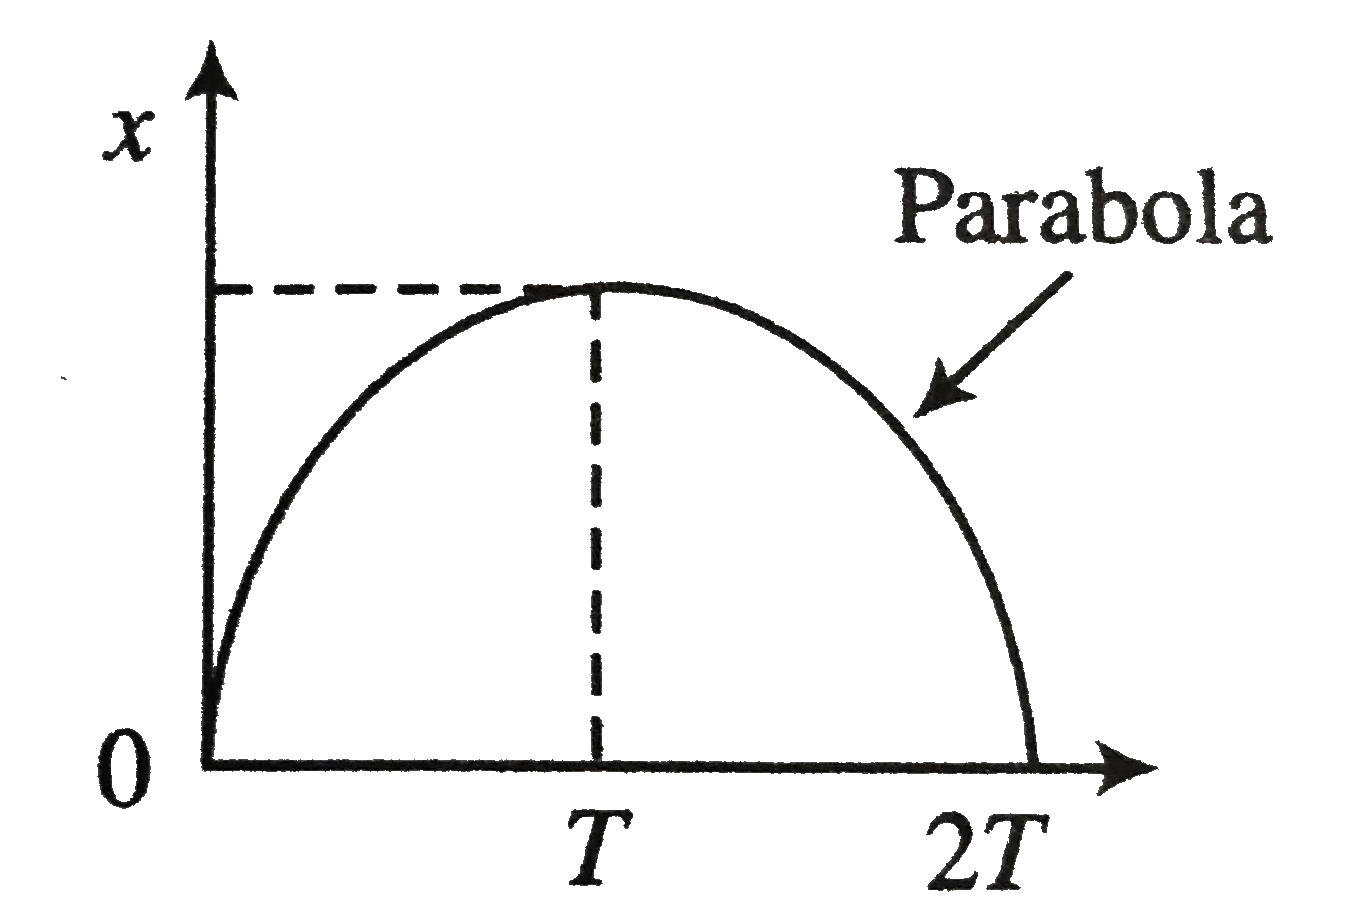
The a-t graph of the particle is correctly shown by
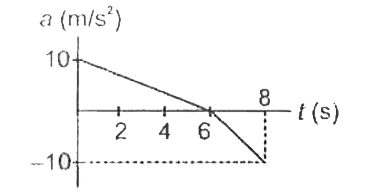
View SolutionThe acceleration - time graph for a particle moving along x - axis is shown in figure, If the initial velocity of particle is −5m/s, the velocity at t = 8 s is
View SolutionVelocity versus displacement graph of a particle moving in a straight line as shown in figure.
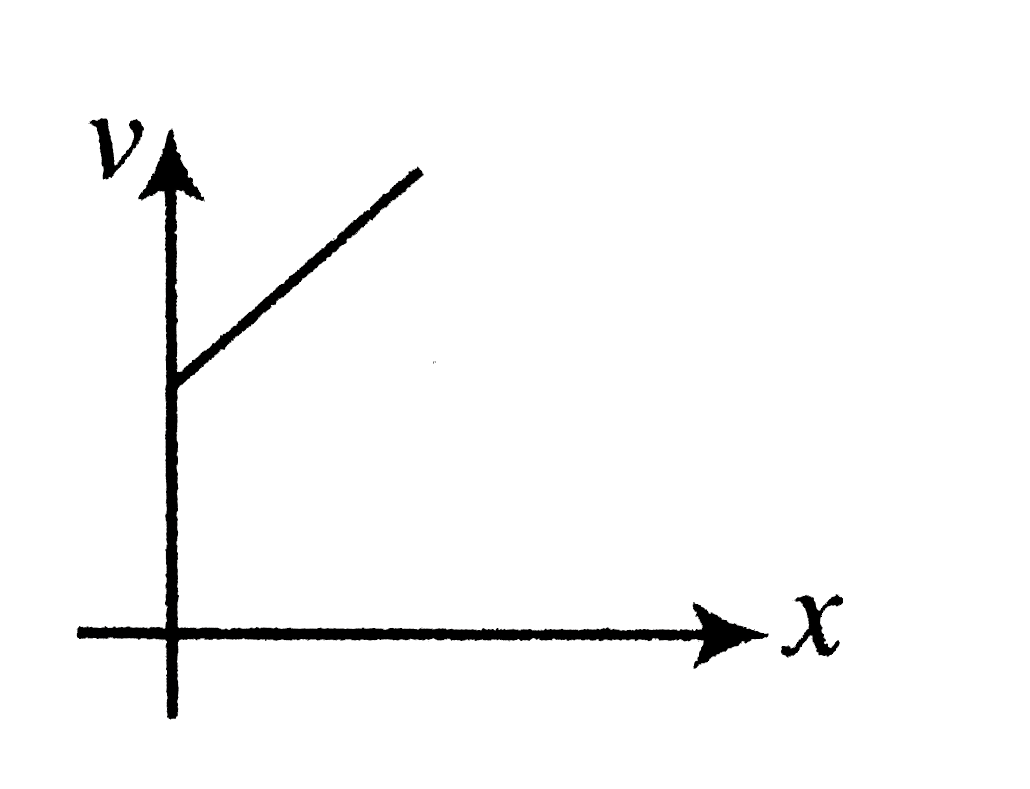
The acceleration of the particle.
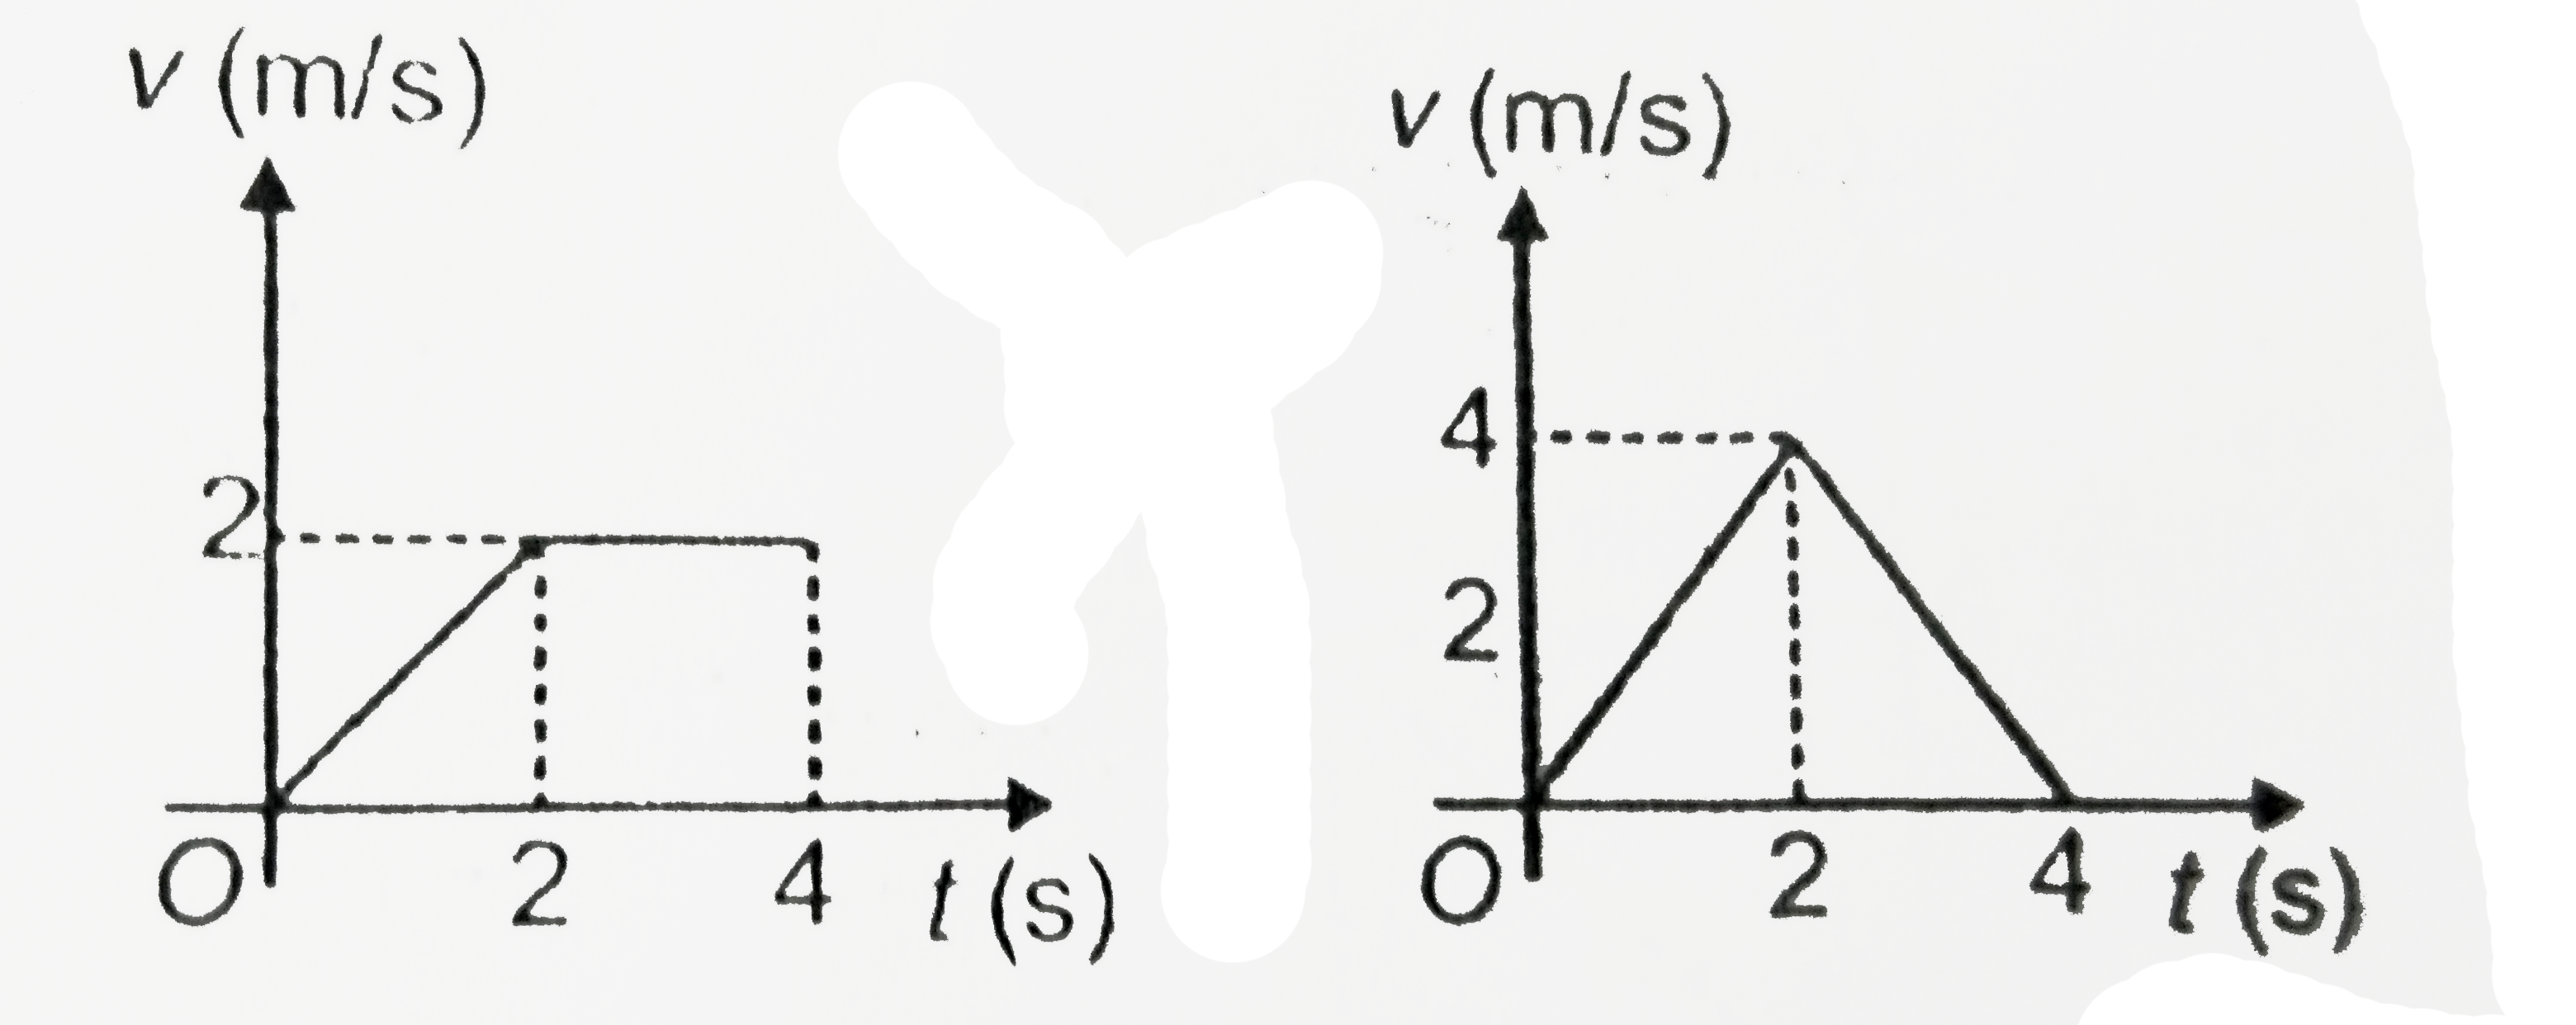
View SolutionThe velocity versus time graph of two particles moving along x-axis varies are shown in the following two plots. Then
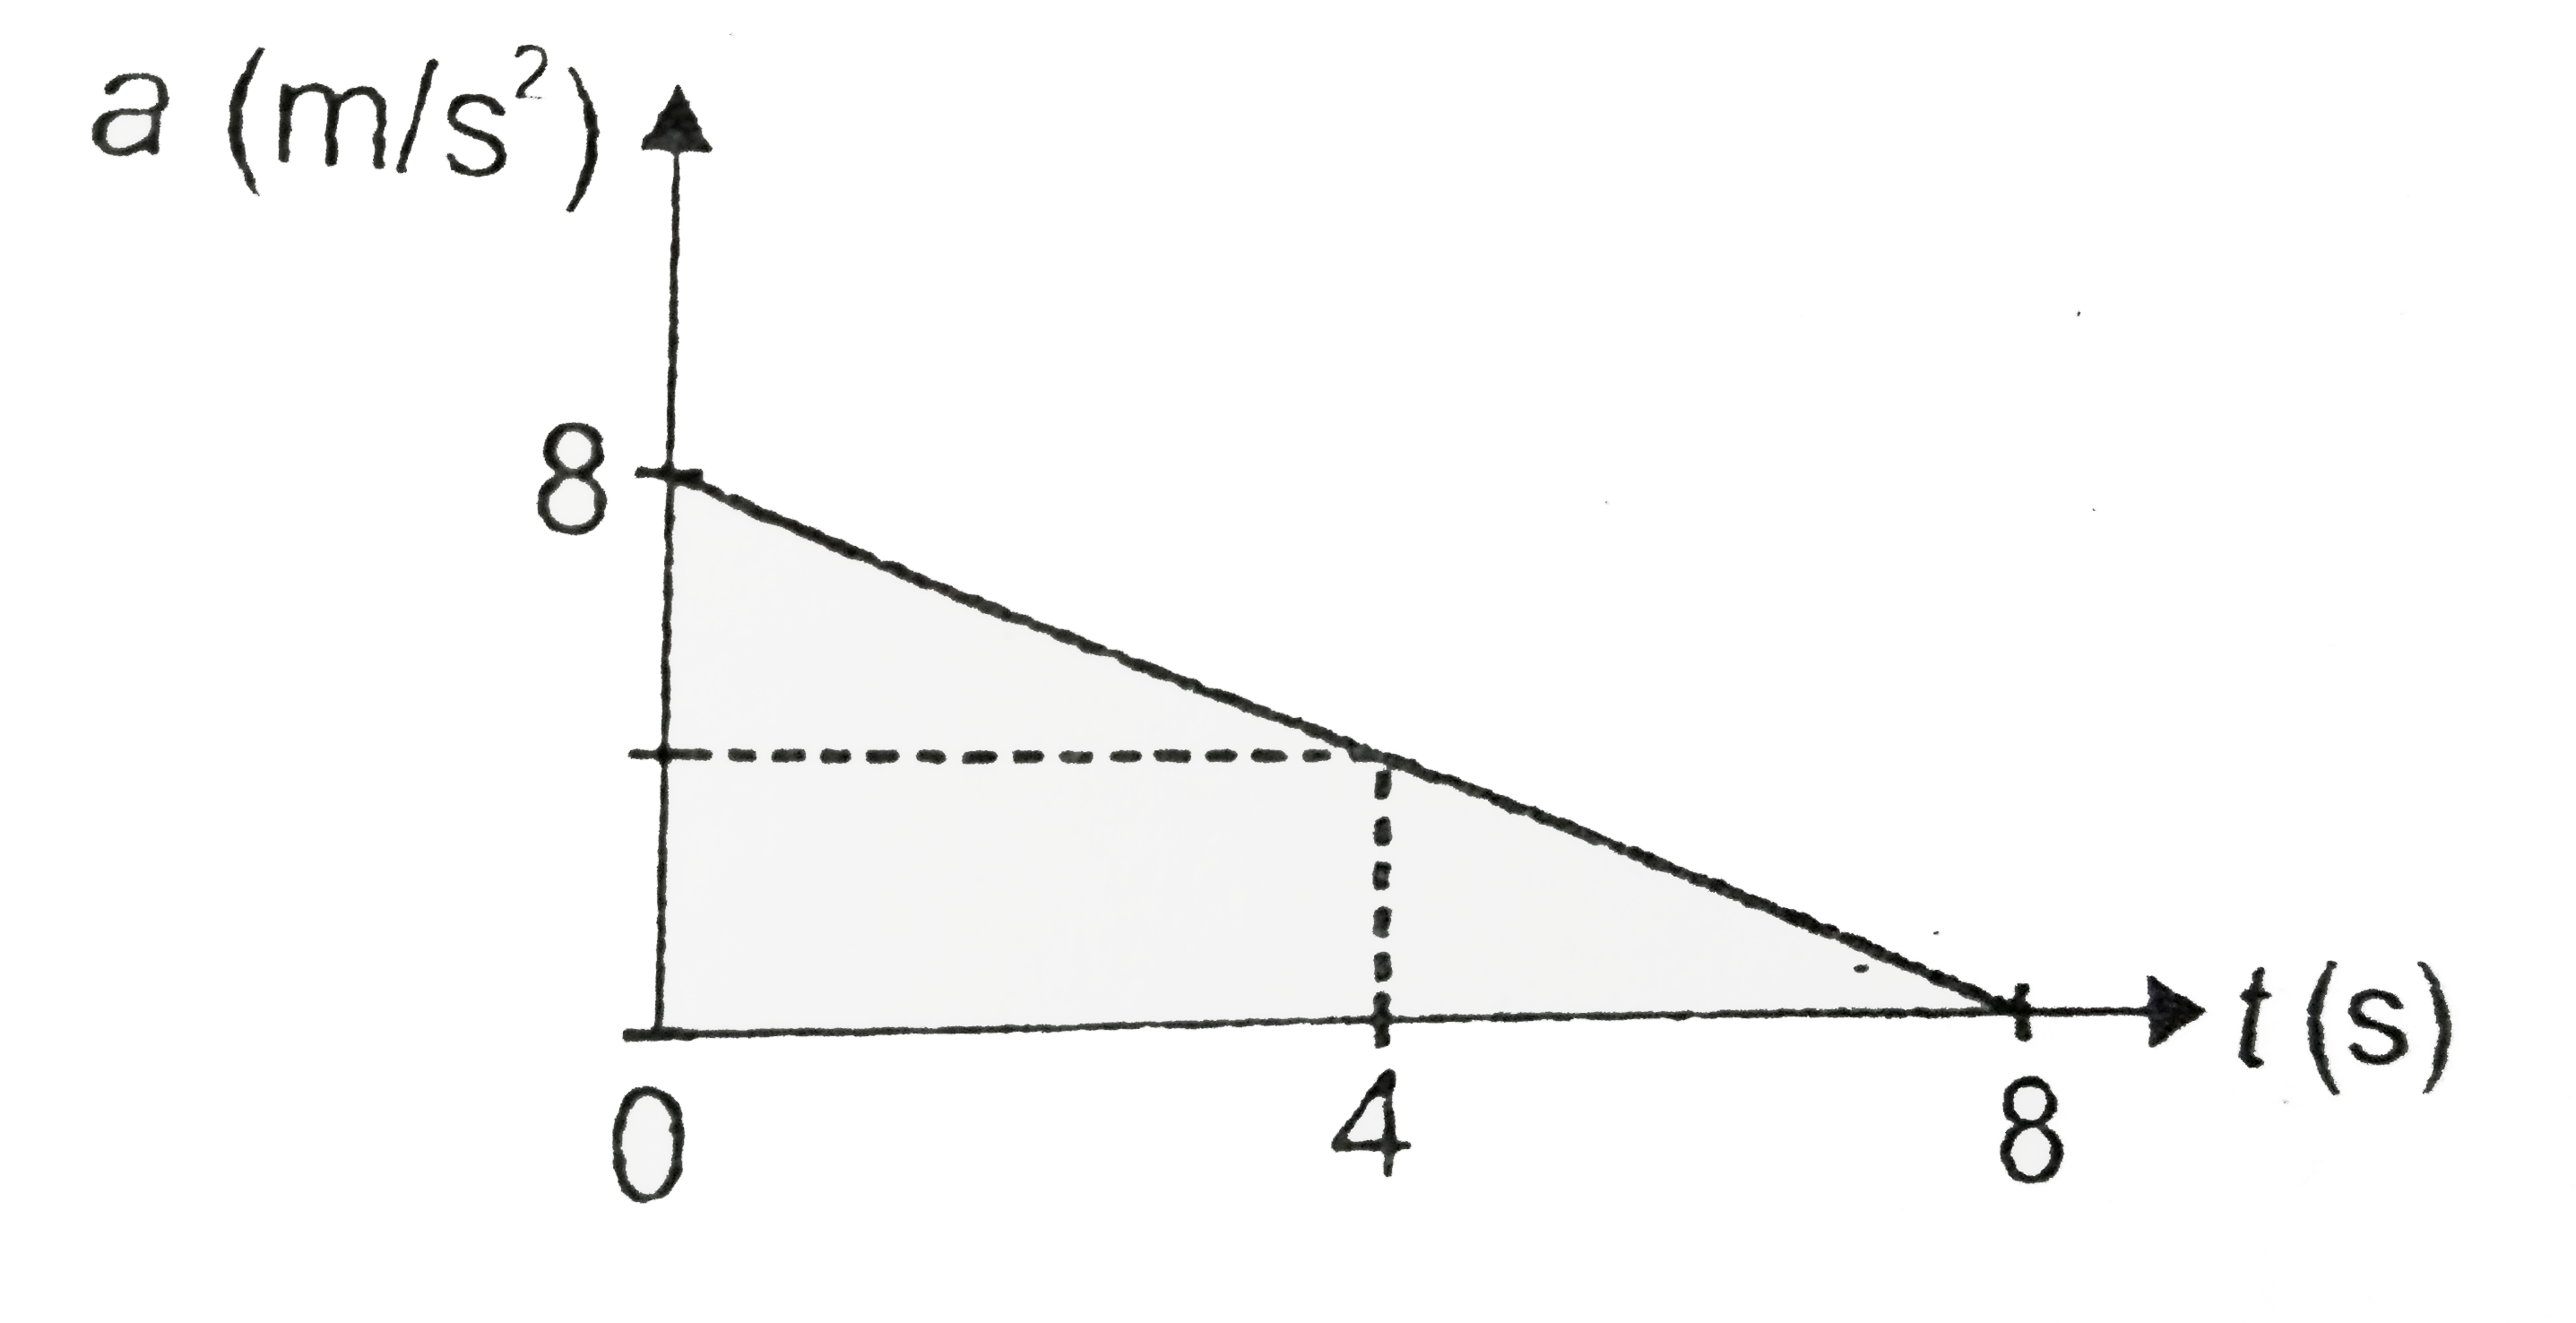
View SolutionThe acceleration-time graph of a particle moving along x-axis is shown in the figure. If the particle starts with velocity 3 m/s at t = 0, find the velocity of particle at t = 4 s.
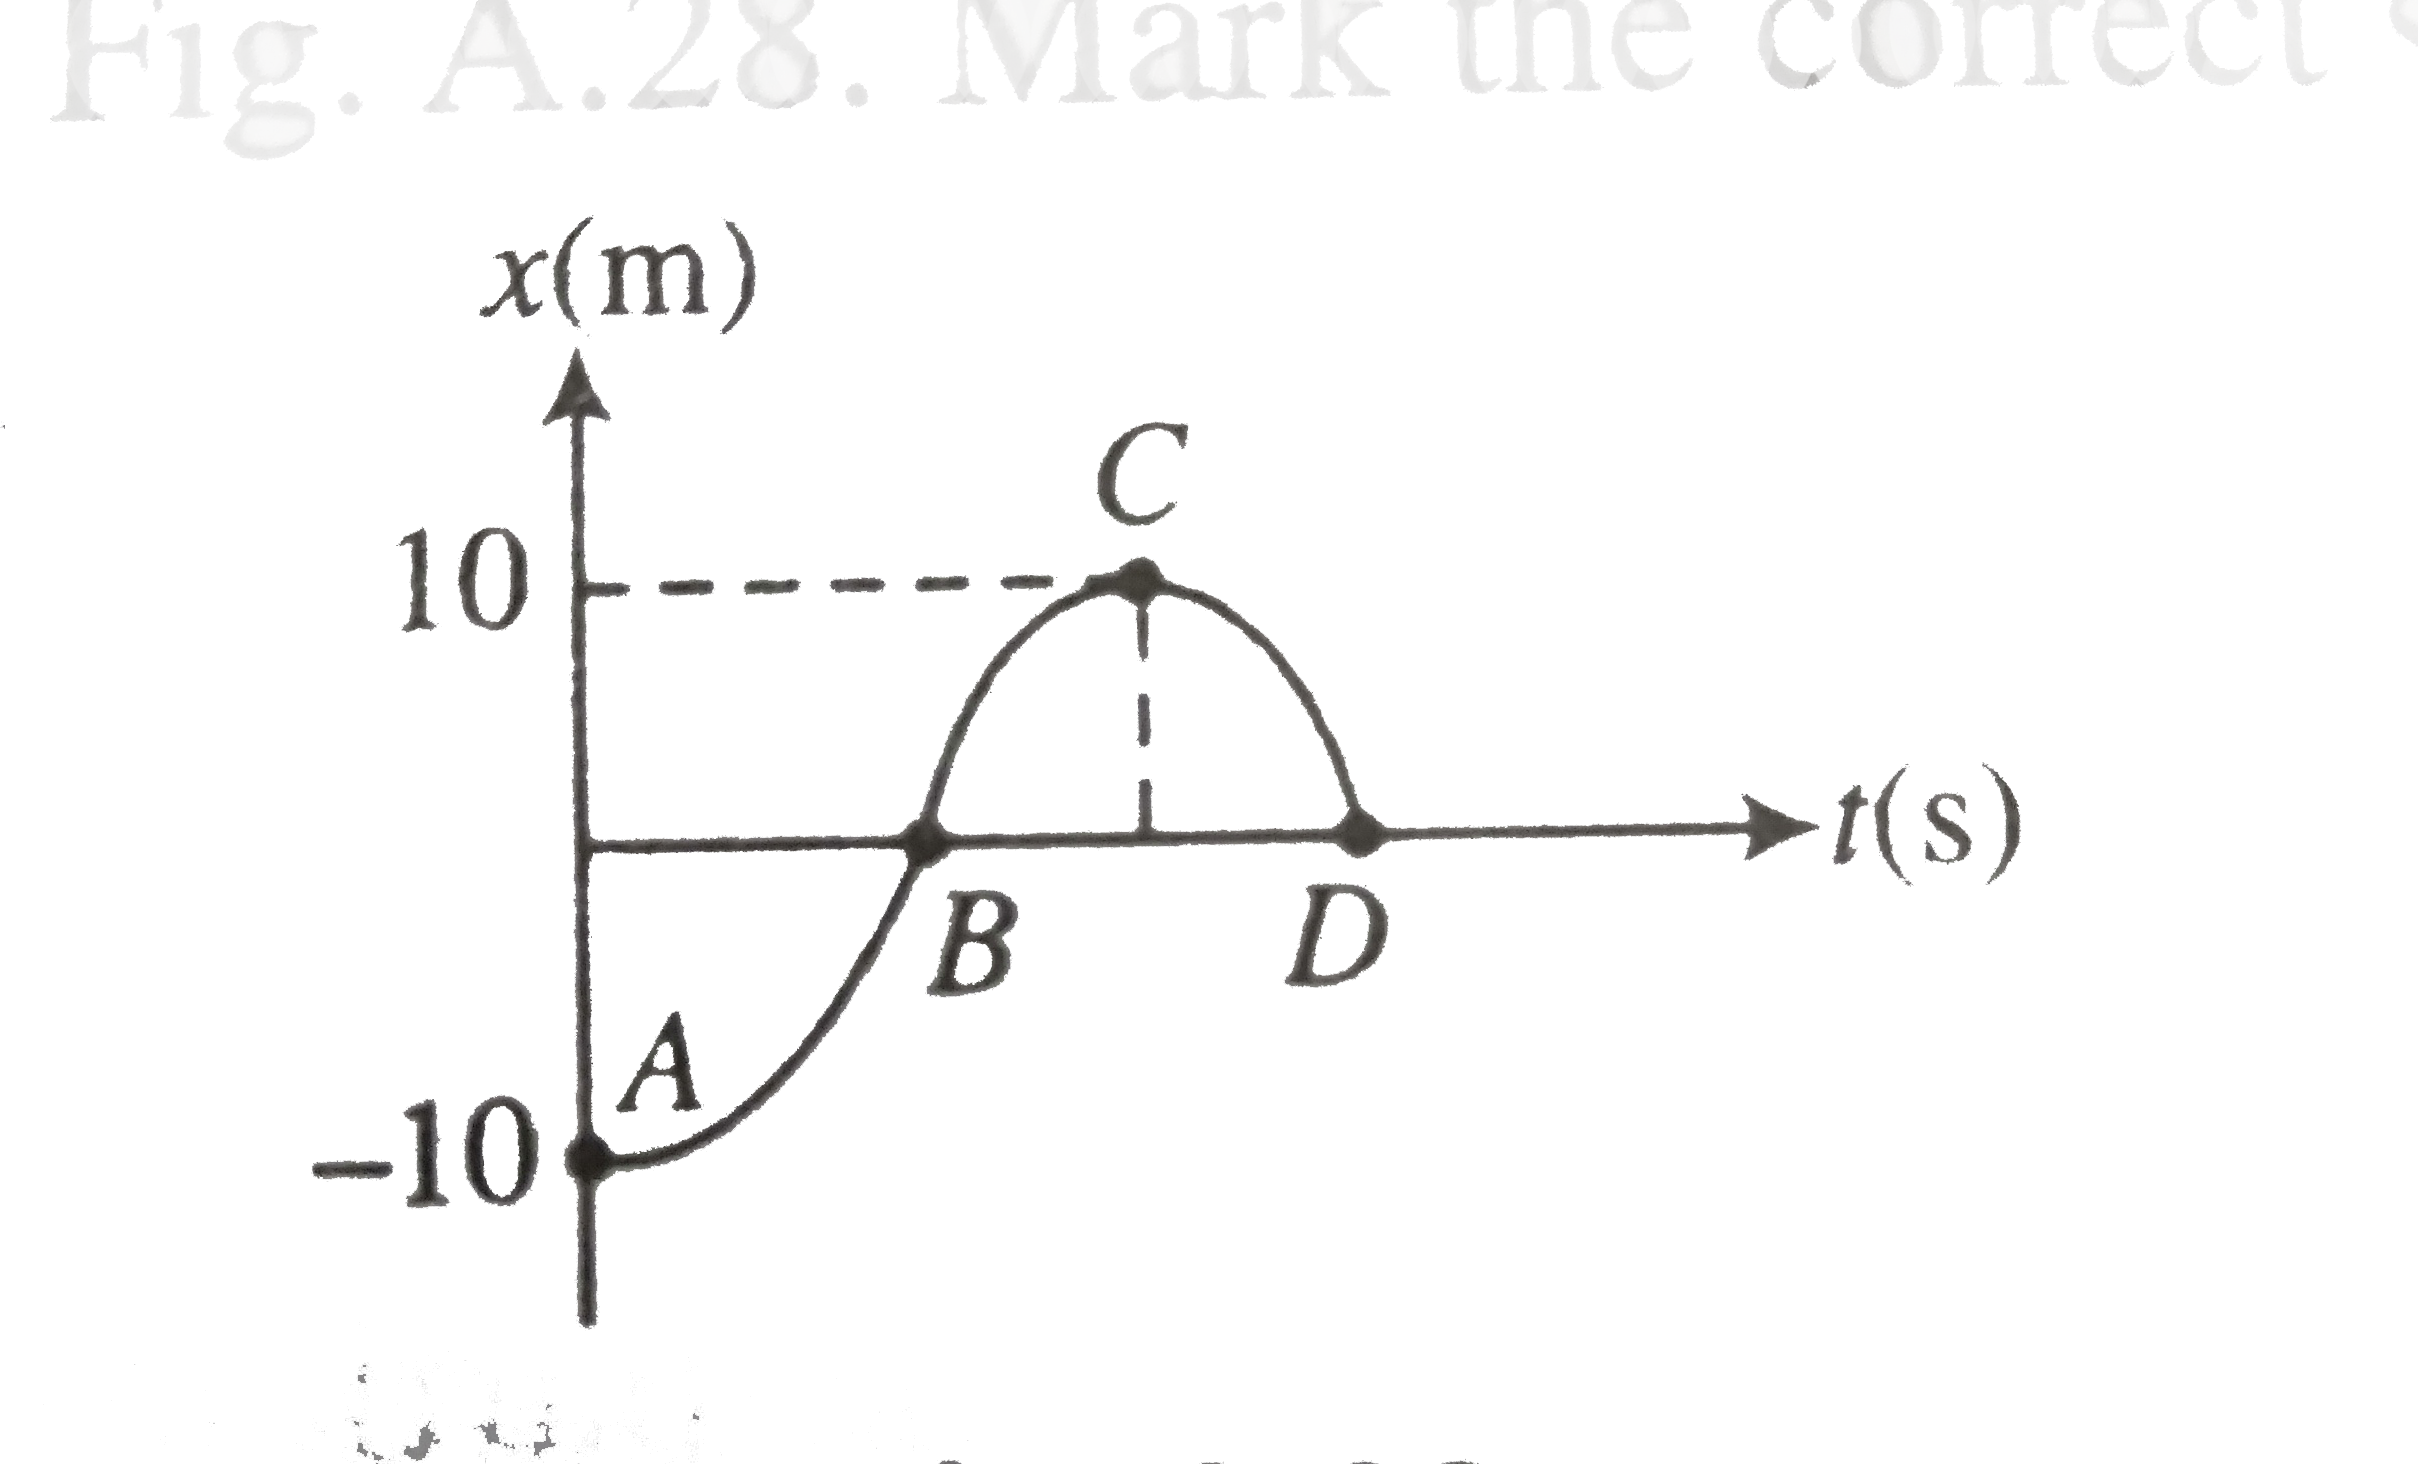
View SolutionFor a particle moving along x-axis, a scaled x-6 graph is shown in figure. Mark the correct statement (s).
View SolutionThe x-t graph of a particle moving along a straight line is shown in figure
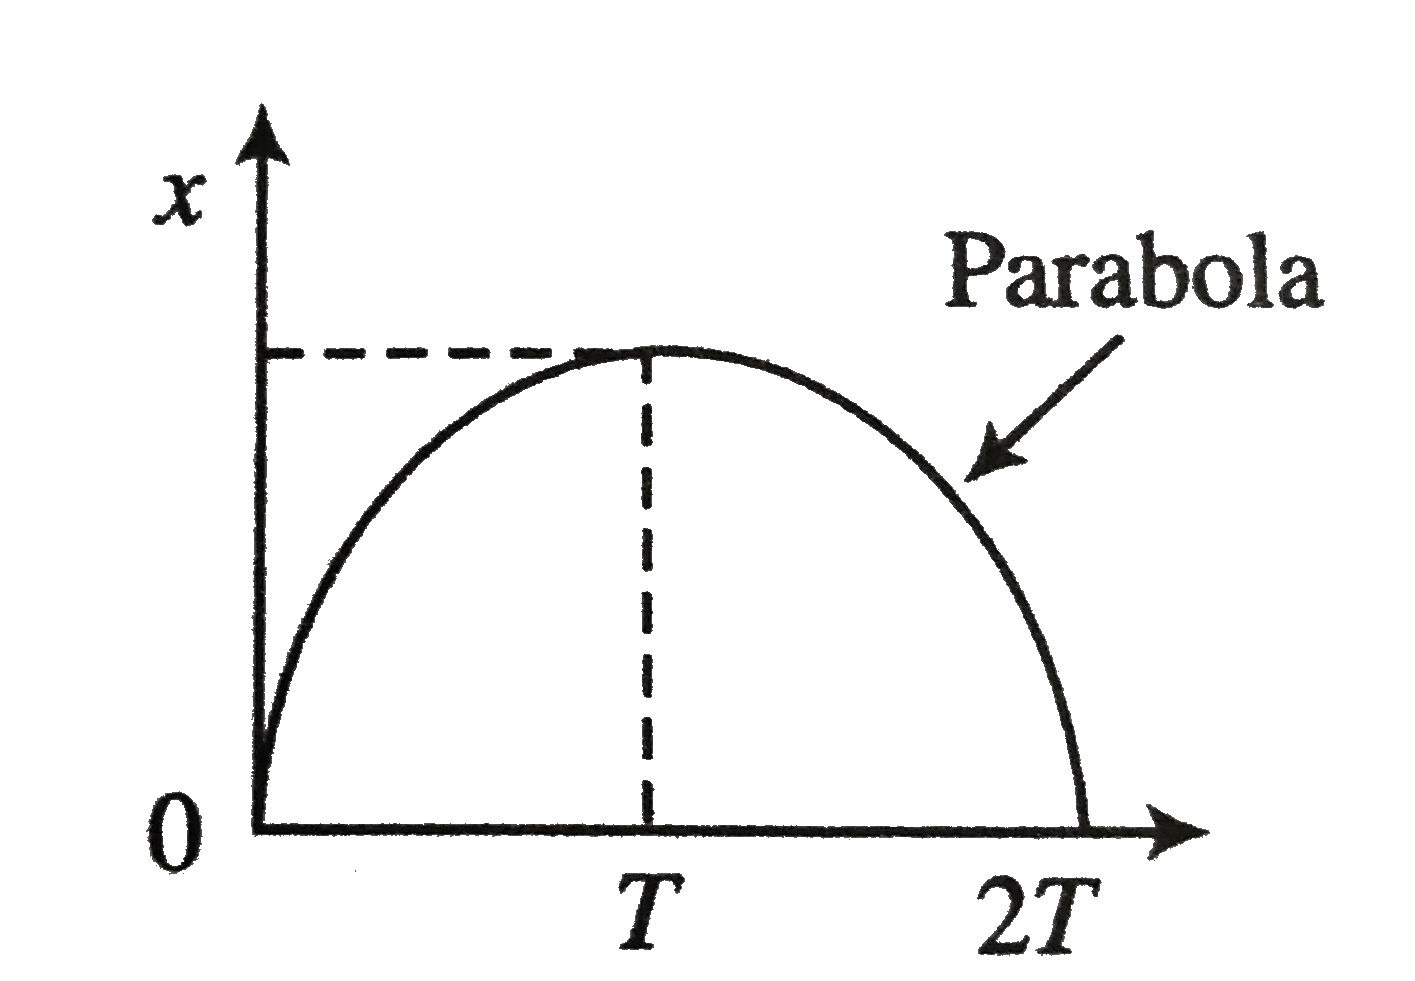
The speed-time graph of the particle is correctly shown by
View SolutionThe position (X)-time (t) graph for a particle of mass 1 kg moving along x-axis is shown in figure. Find impulse on particle at t = 4 s.
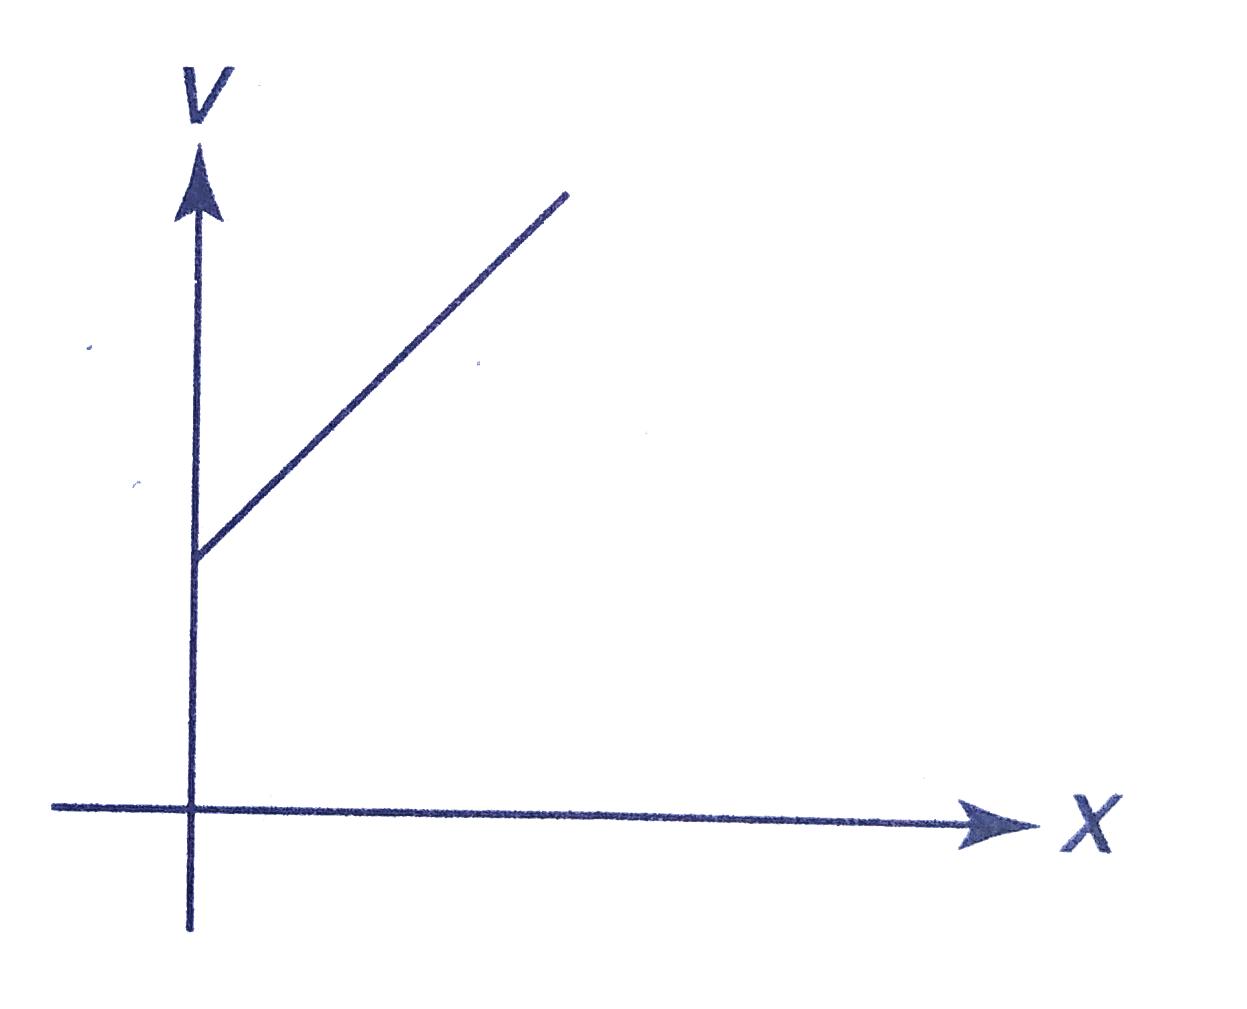
View SolutionGraph of velocity versus displacement of a particle moving in a straight line is as shown in figure.
The acceleration of the particle is.
View Solution