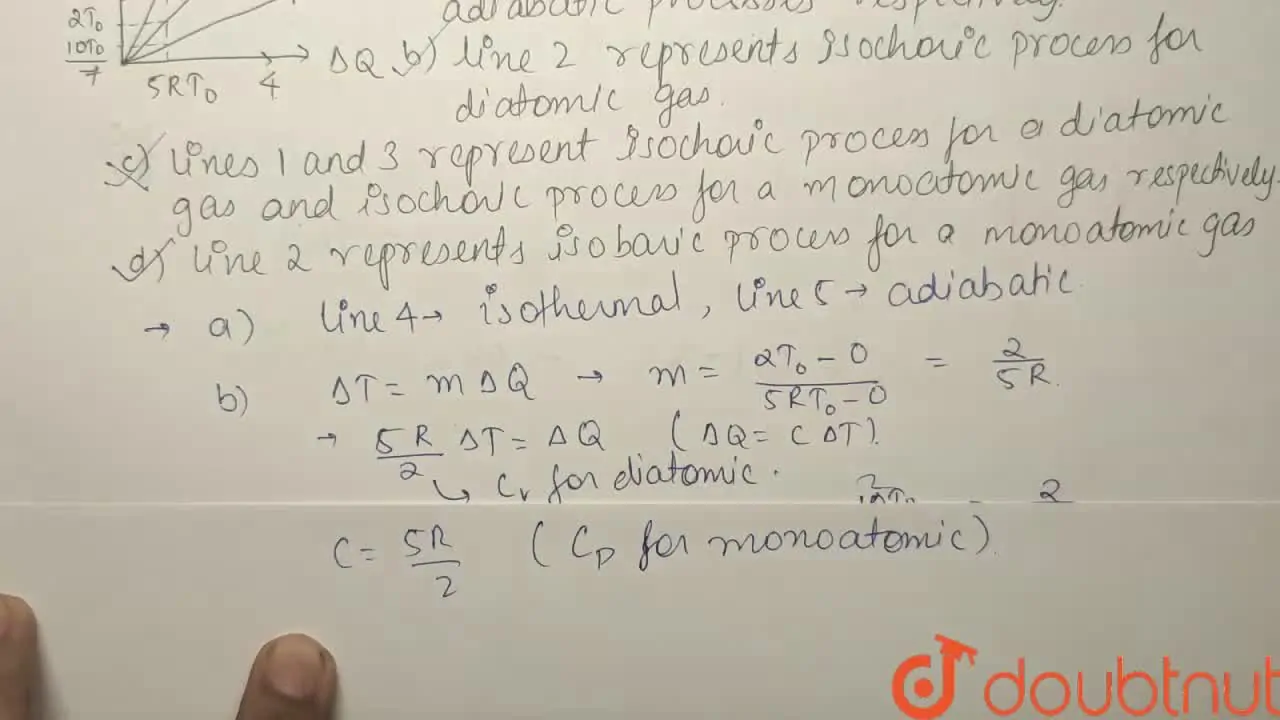
Figure (Five straight line numbered 1, 2, 3, 4 and 5) shows graph of change in temperature ΔT verusus heat supplied ΔQ for different process performed on a gas of one mole.
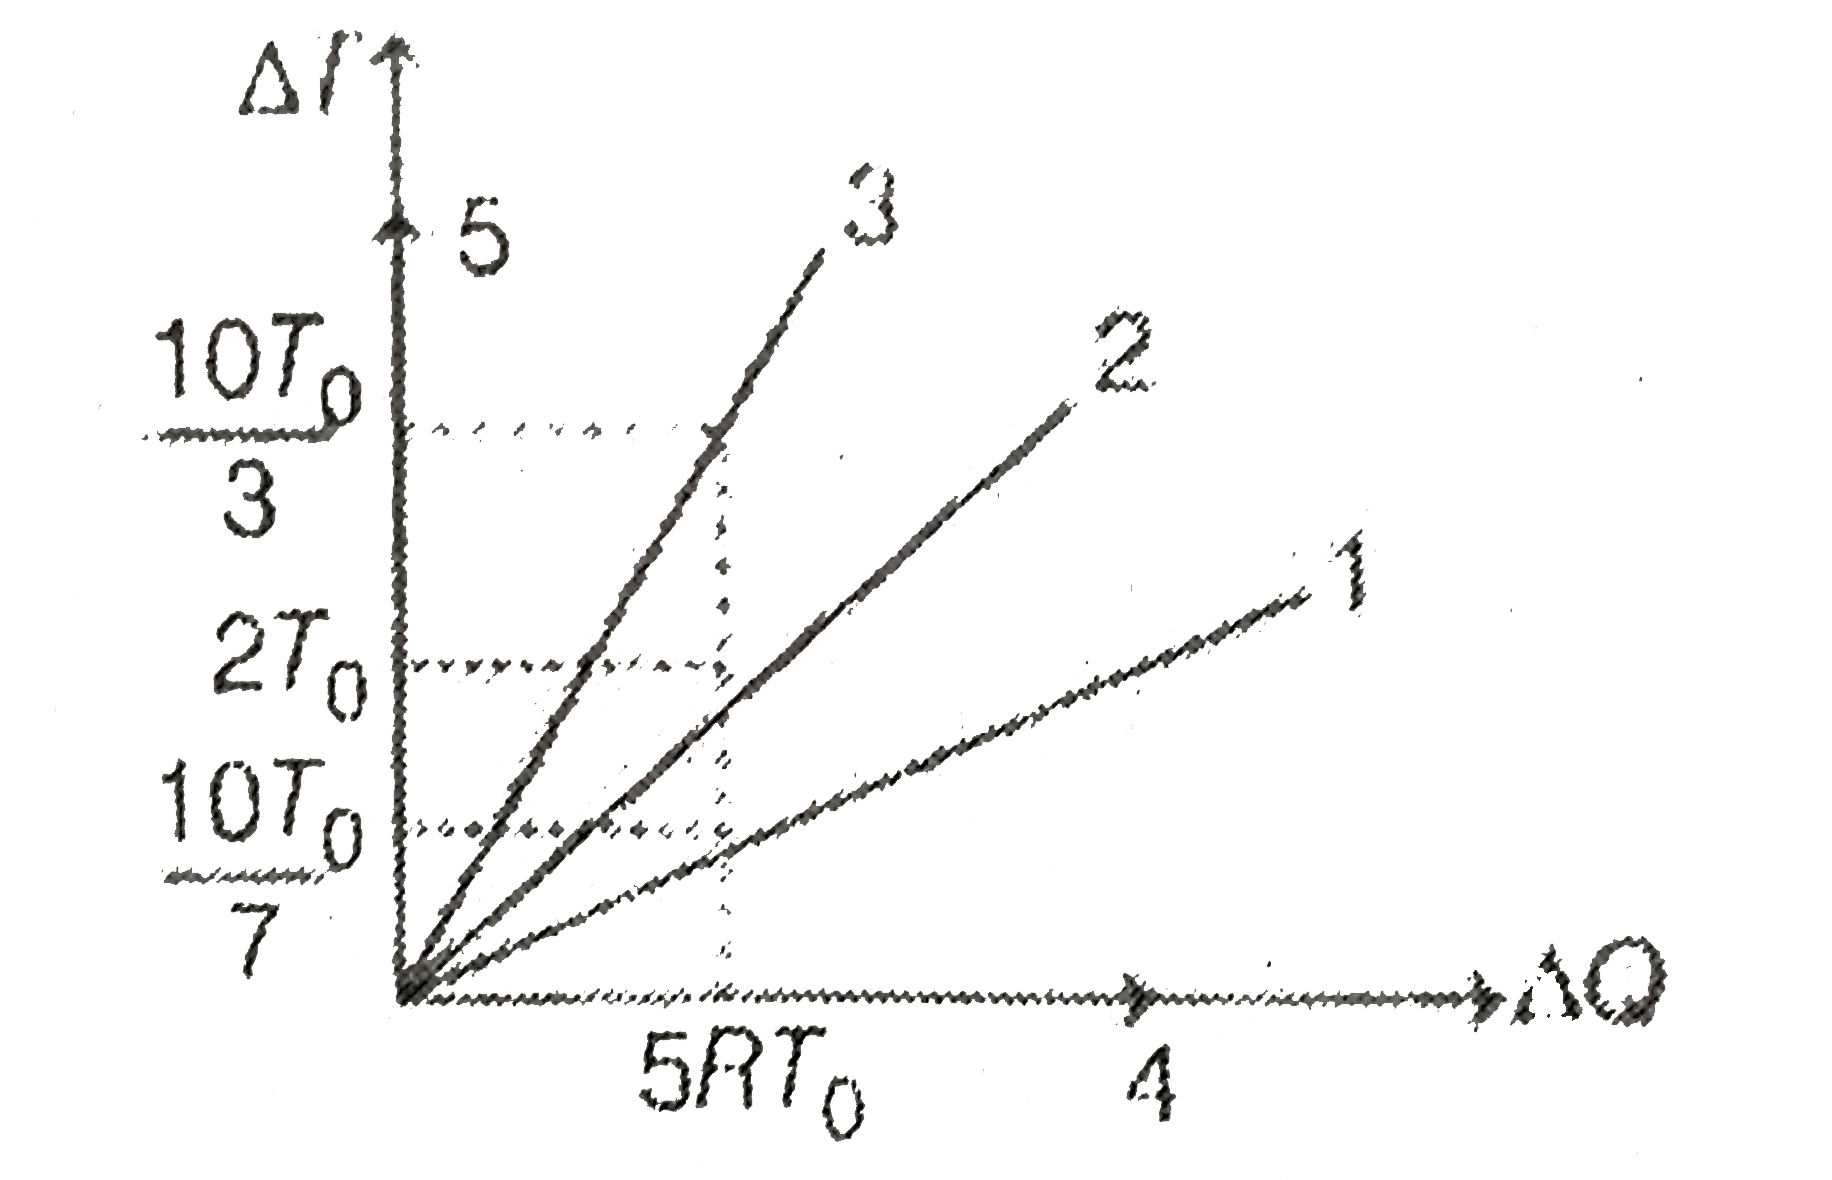
lines 4 and 5 (coinciding with ΔQ and ΔT axis respectively) represent isothermal and adiabatic processes respectively
line 2 respesents isochoric process for diatomic gas
lines 1 and 3 represent isochoric process for a diatomic gas and isochoric process for a monoatomic gas respectively
line 2 represents isobaric process for a monoatomic gas.
The correct Answer is:A, B, C, D
Step by step video & image solution for Figure (Five straight line numbered 1, 2, 3, 4 and 5) shows graph of change in temperature Delta T verusus heat supplied Delta Q for different process performed on a gas of one mole. by Physics experts to help you in doubts & scoring excellent marks in Class 11 exams.
Related Playlists
Similar Questions
Figure shows volume - temperature (V-T) graph for same mass of an ideal gas at two different pressures P1and P2. Hence
View SolutionThe straight lines in the figure depict the variations in temperature ΔT as a function of the amount of heat supplied Q is different process involving the change of state of a monoatomic and a diatomic ideal gas . The initial states, (P,V,T) of the two gases are the same . Match the processes as described, with the straight lines in the graph as numbered.
_E01_155_Q01.png)
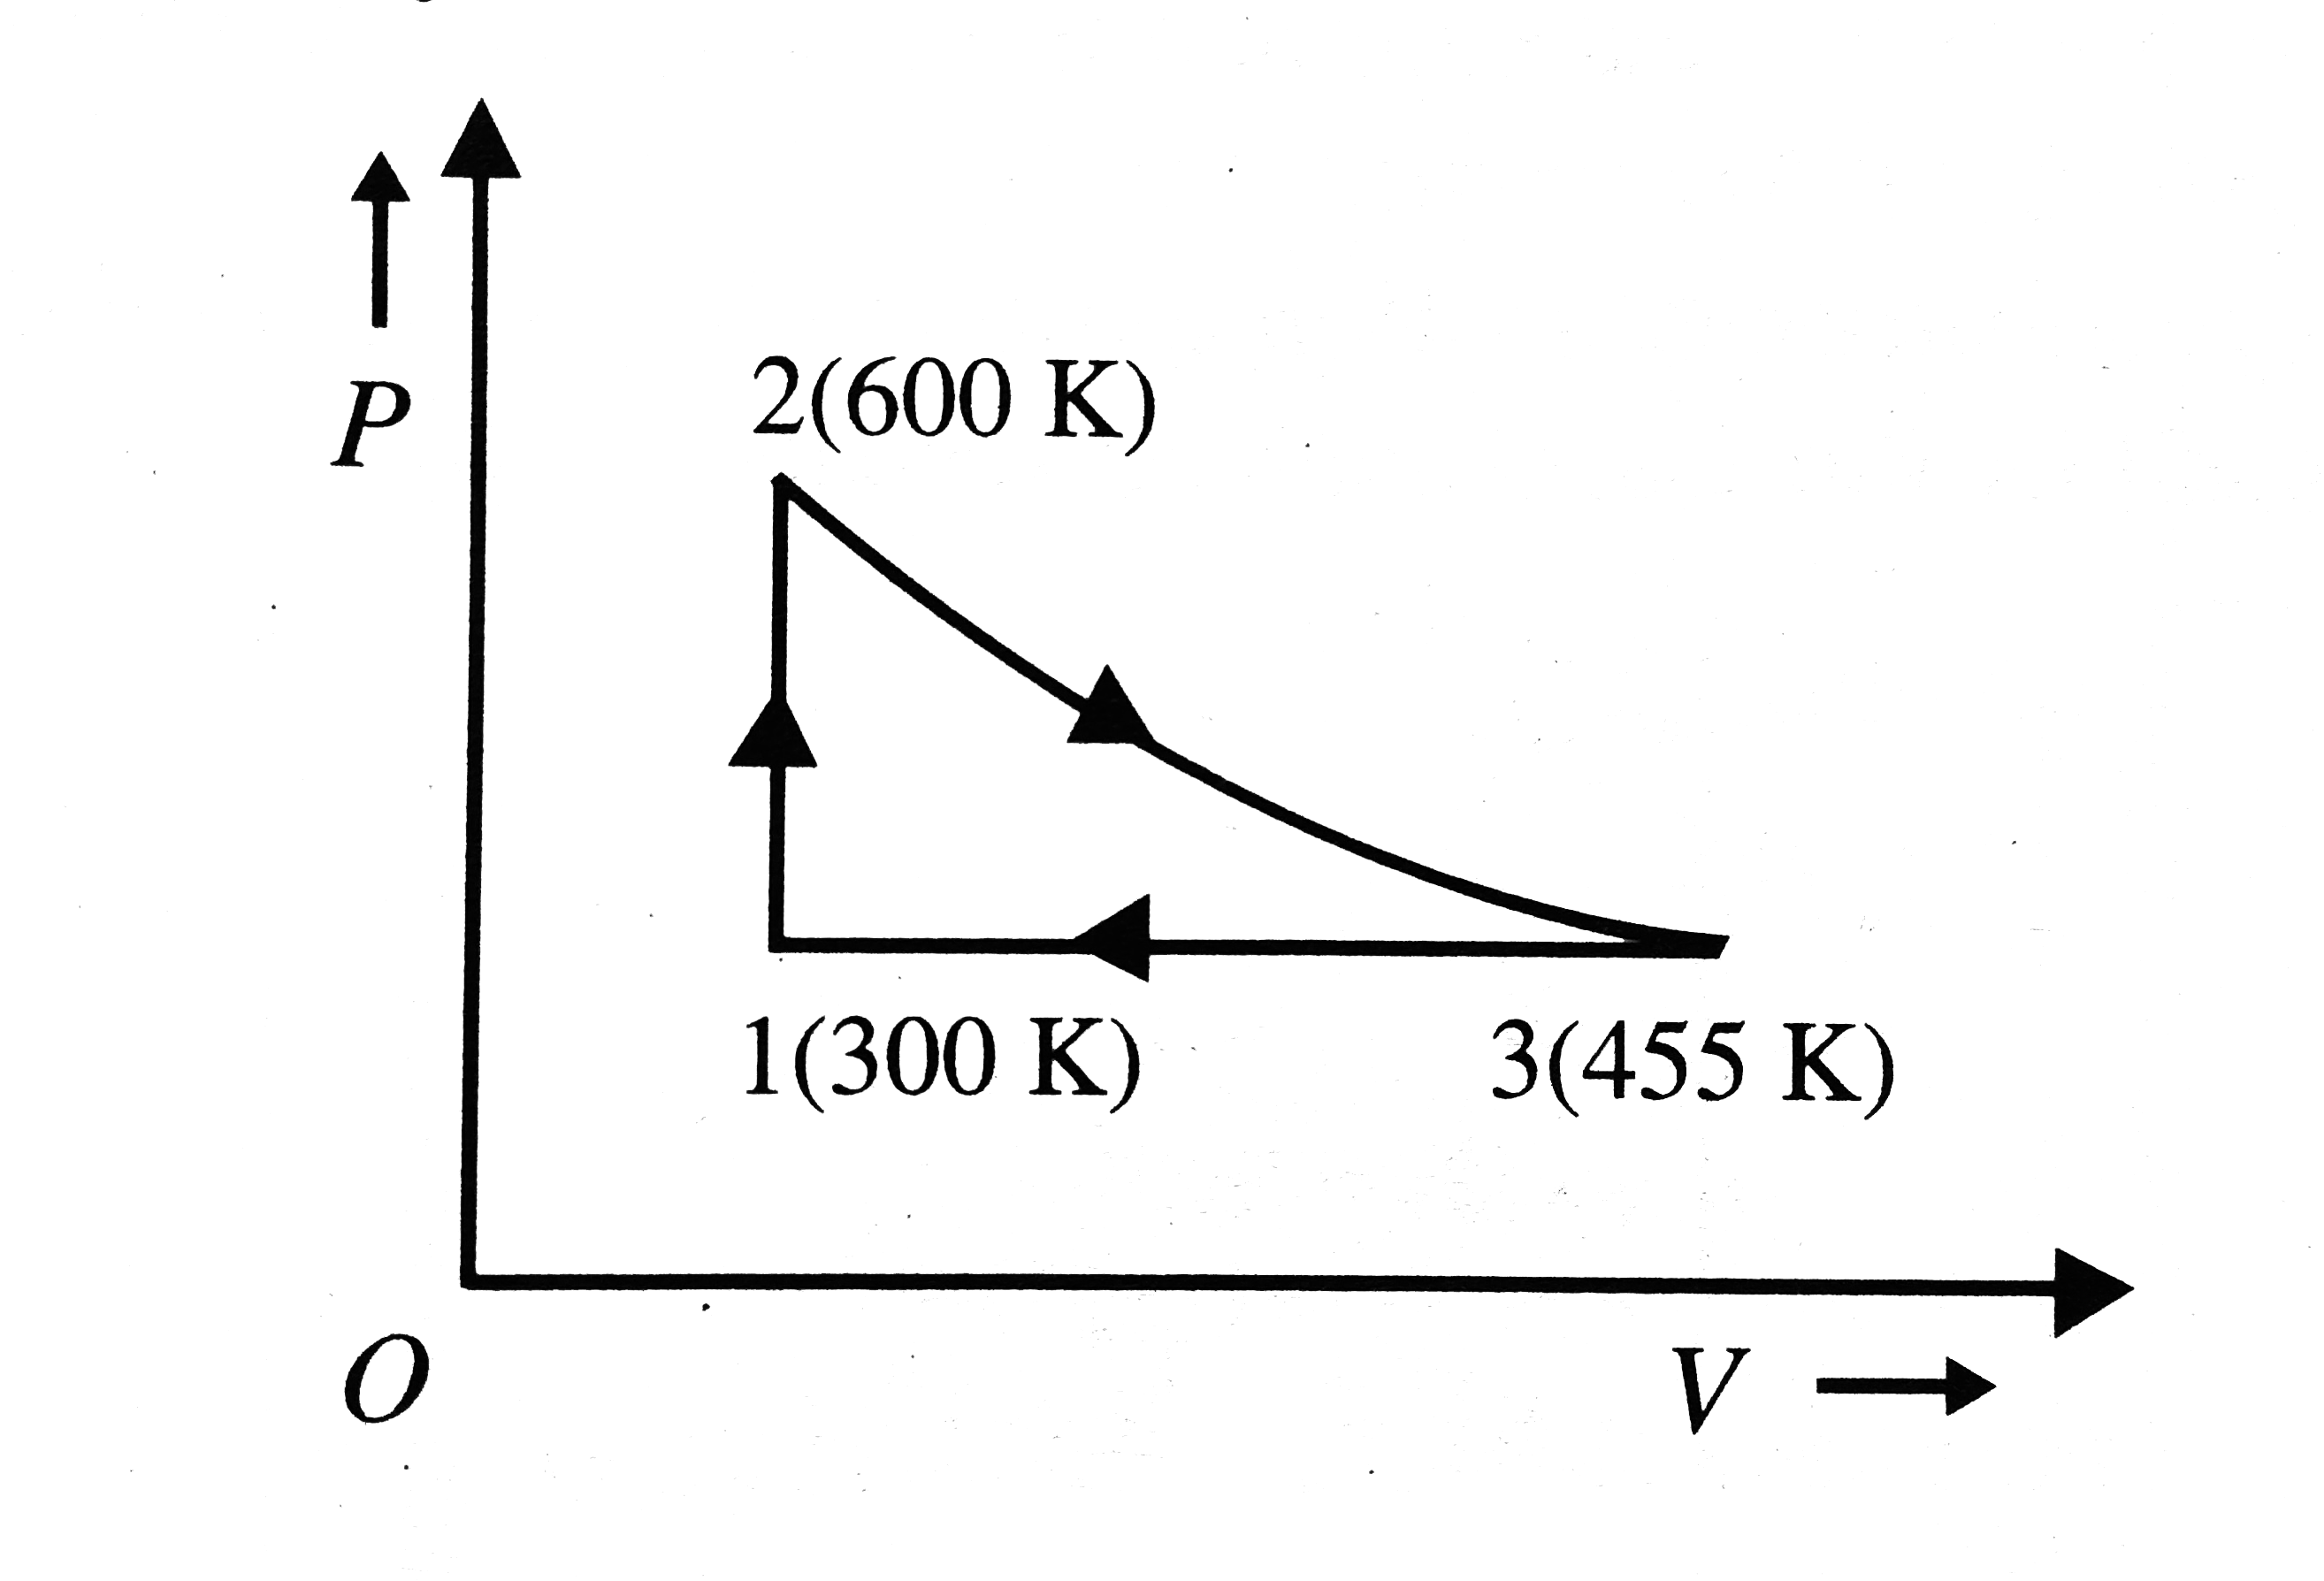
Column-IColumn-II(A)Isobaric process of monoatomic gas.(p)1(B)Isobaric process of diatomic gas(q)2(C)Isochoric process of monoatomic gas(r)Minimum at section B(D)Isochoric process of diatomic gas(s)x-axis (i.e.'Q' axis)View SolutionA reversible heat engine carries 1 mole of an ideal monatomic gas around the cycle 1-2-3-1. Process 1-2 takes place at constant volume, process 2-3 is adiabatic, and process 3-1 takes place at constant pressure. Complete the values for the heat ΔQ, the change in internal energy ΔU, and the work done Δ, for each of the three processes and for the cycle as a whole.
 View Solution
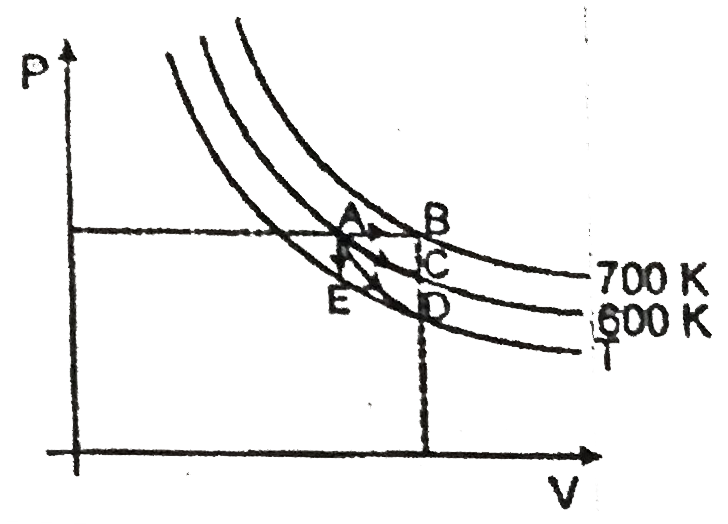
For an ideal gas four processes are marked as 1,2,3 and 4 on P-V diagram as shown in figure. The amount of heat supplied to the gas in the process 1,2,3 and 4 are Q1,Q2,Q3 and Q4 respectively, then correct order of heat supplied to the gas is : [AB is process-1, AC is process-2, AD is adiabatic process-3 and AE is process-4]
 View Solution
Consider one mole of an ideal gas whose volume changes with temeperature as V=αT, where α is a constant. Heat is supplied to the gas to raise its temperature by ΔT. If γ adiabatic constant then choose the correct options.
View SolutionThree moles of an diatomic gas are in a closed rigid container at temperature T (in K). 1 mole of diatomic gas gets dissociated into atoms without appreciable change in temperature. Now heat is supplied to the gas and temperature becomes 2T. If the heat supplied to the gas is x(RT), find the value of x.
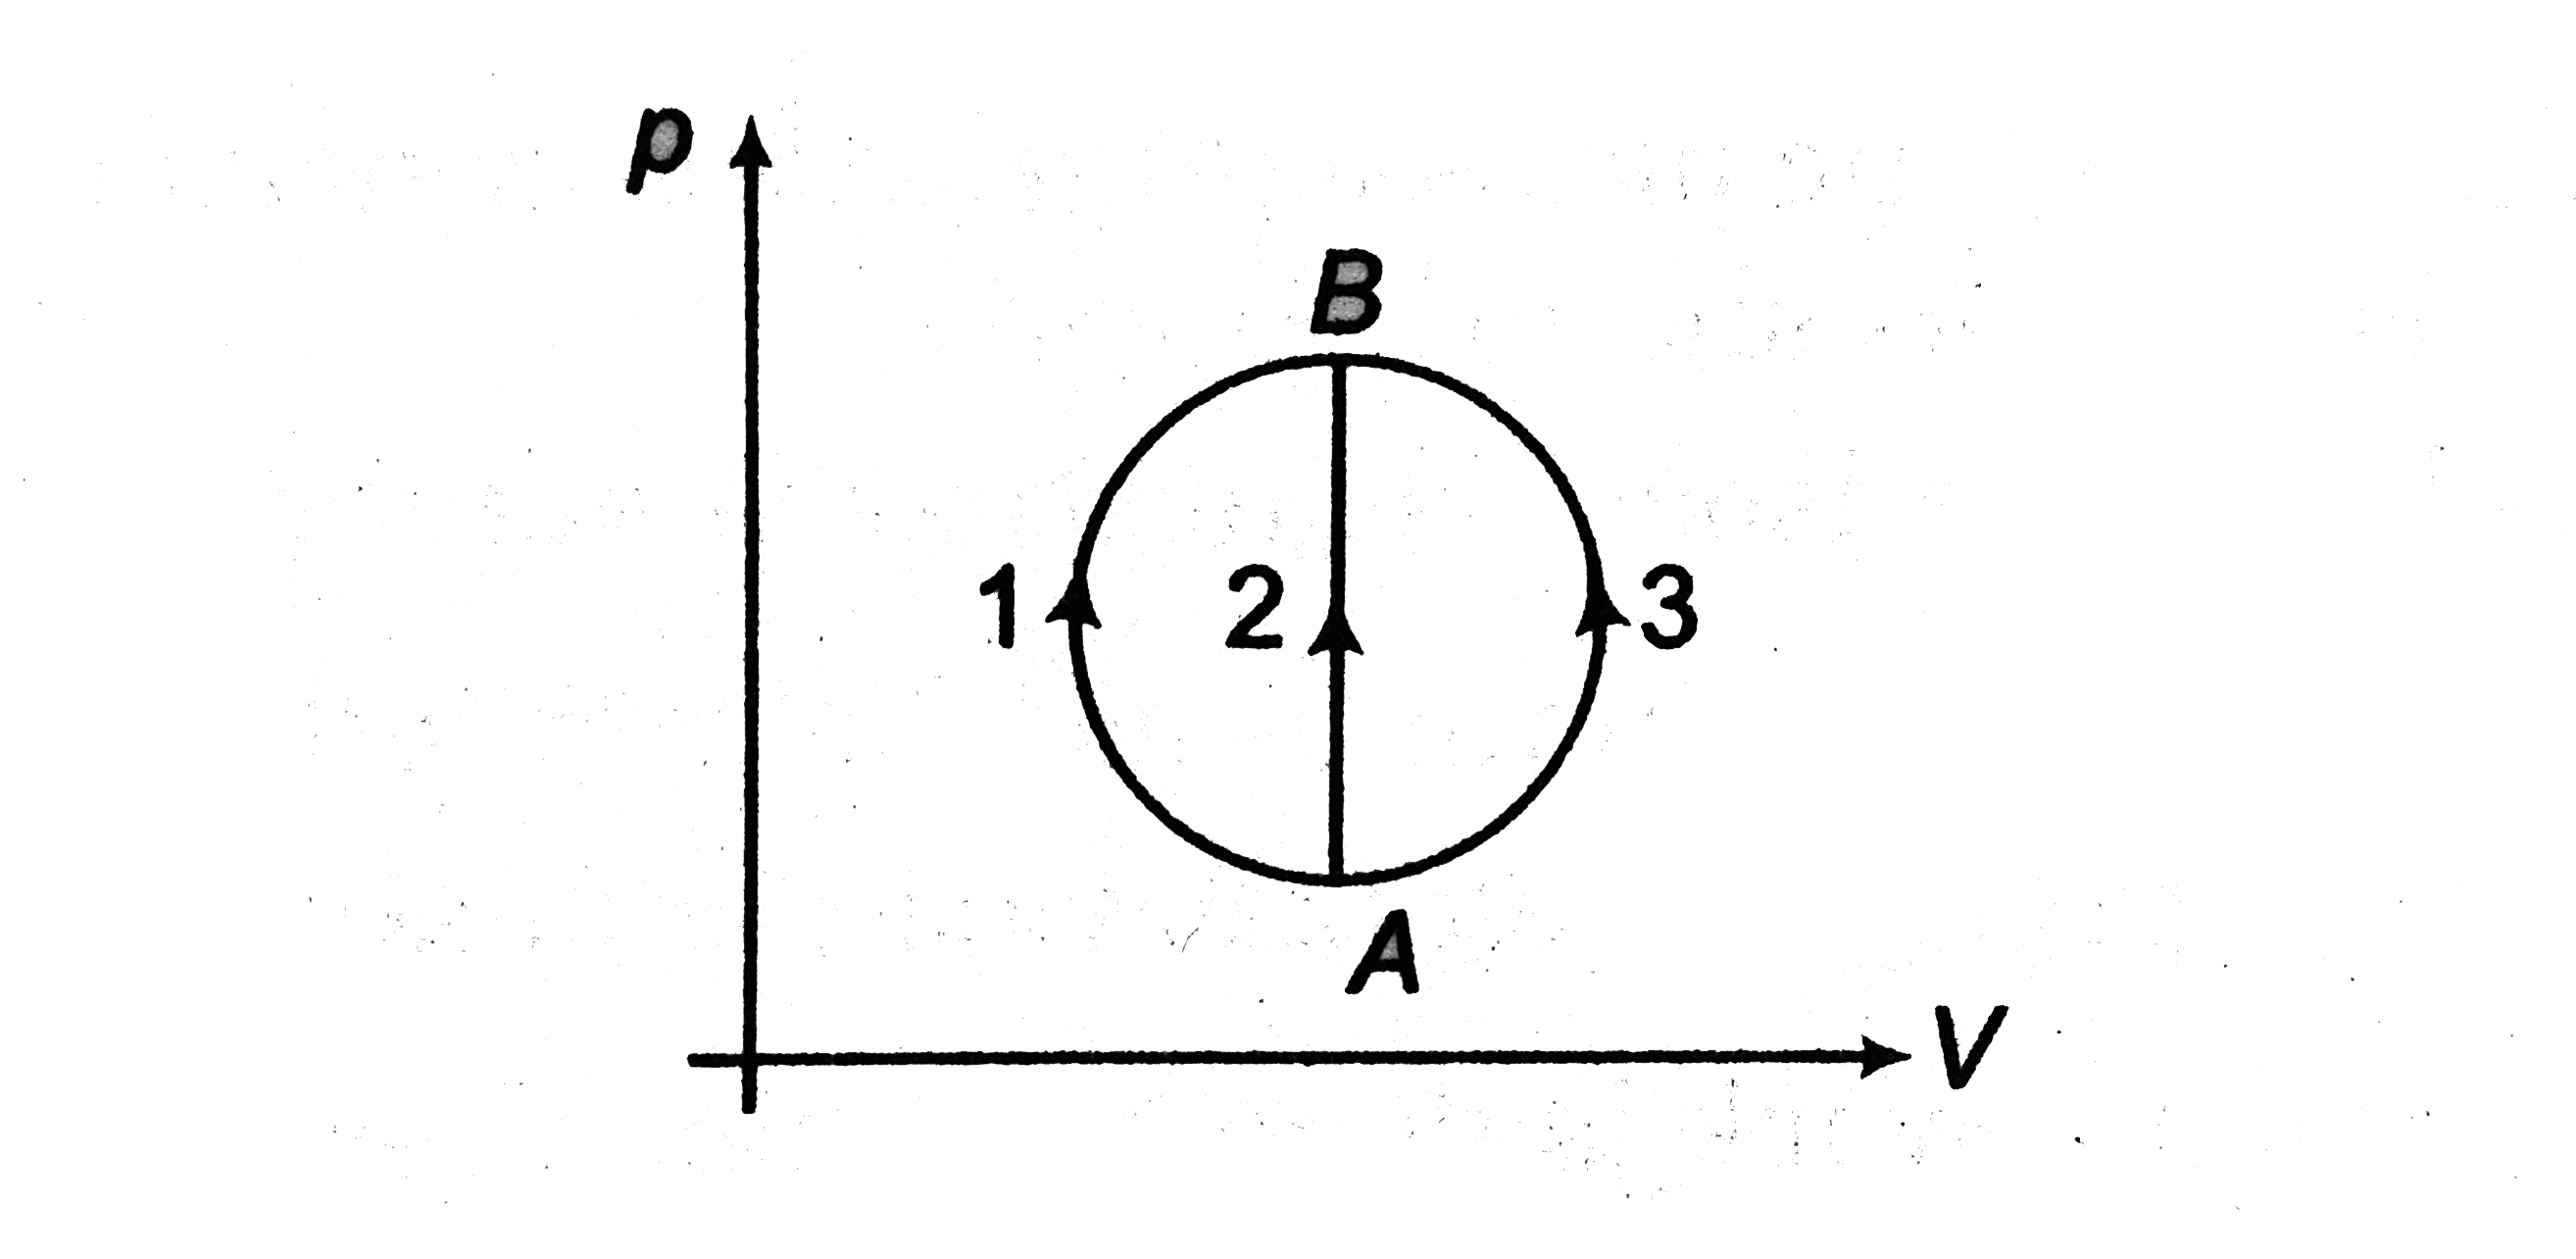
View SolutionA gas undergoes A to B through three different processes 1,2 and 3 as shown in the figure. The heat supplied to the gas is Q1, Q2 and Q3 respectively, then
 View Solution
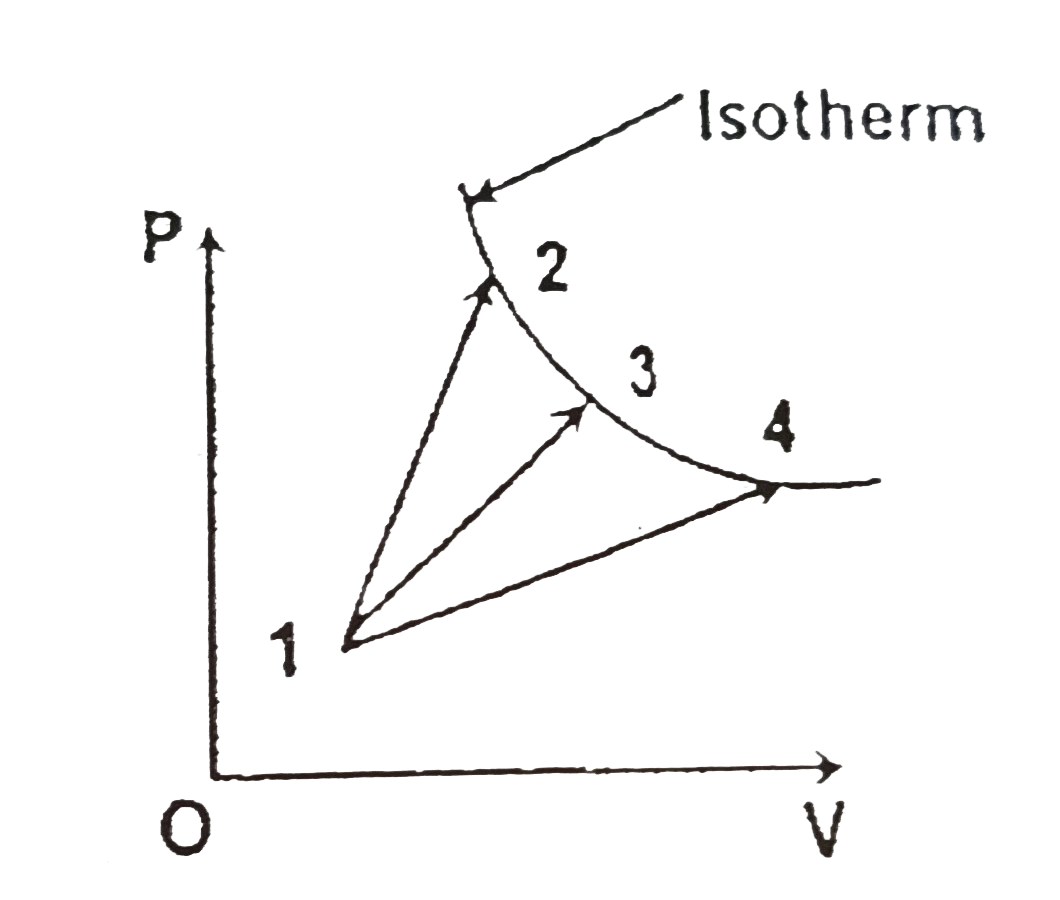
A gas took part in three thermal processes in which it is heated from the same initial state to the same final temperature. The process are shown in the P−V diagram by straight lines 1−2, 1−3 and 1−4. Q1, Q2 and Q3 are amount of heat supplied to the gas in the process 1→2, 1→3, 1→4. respectively.
 View Solution
Consider PT graph of cyclic process shown in the figure. Maximum pressure during the cycle is twice the minimum pressure. The heat received by the gas in the process 1-2 is equal to the heat received in the process 3-4. The process is done on one mole of monoatomic gas.
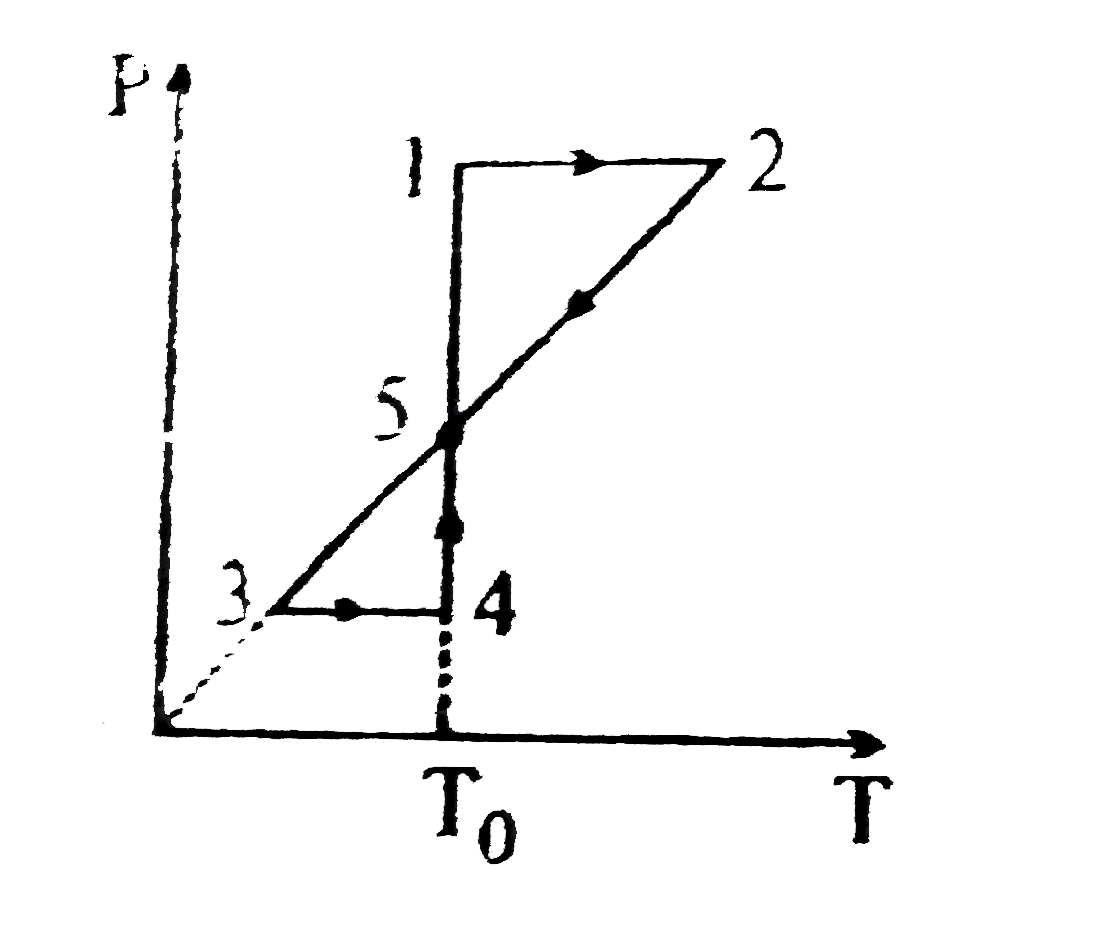
Correct PV diagram for the process is-View SolutionOne mole of an ideal monoatomic gas at temperature T0 expands slowly according to the law pV = constant. If the final temperature is 2T0, heat supplied to the gas is
View Solution

