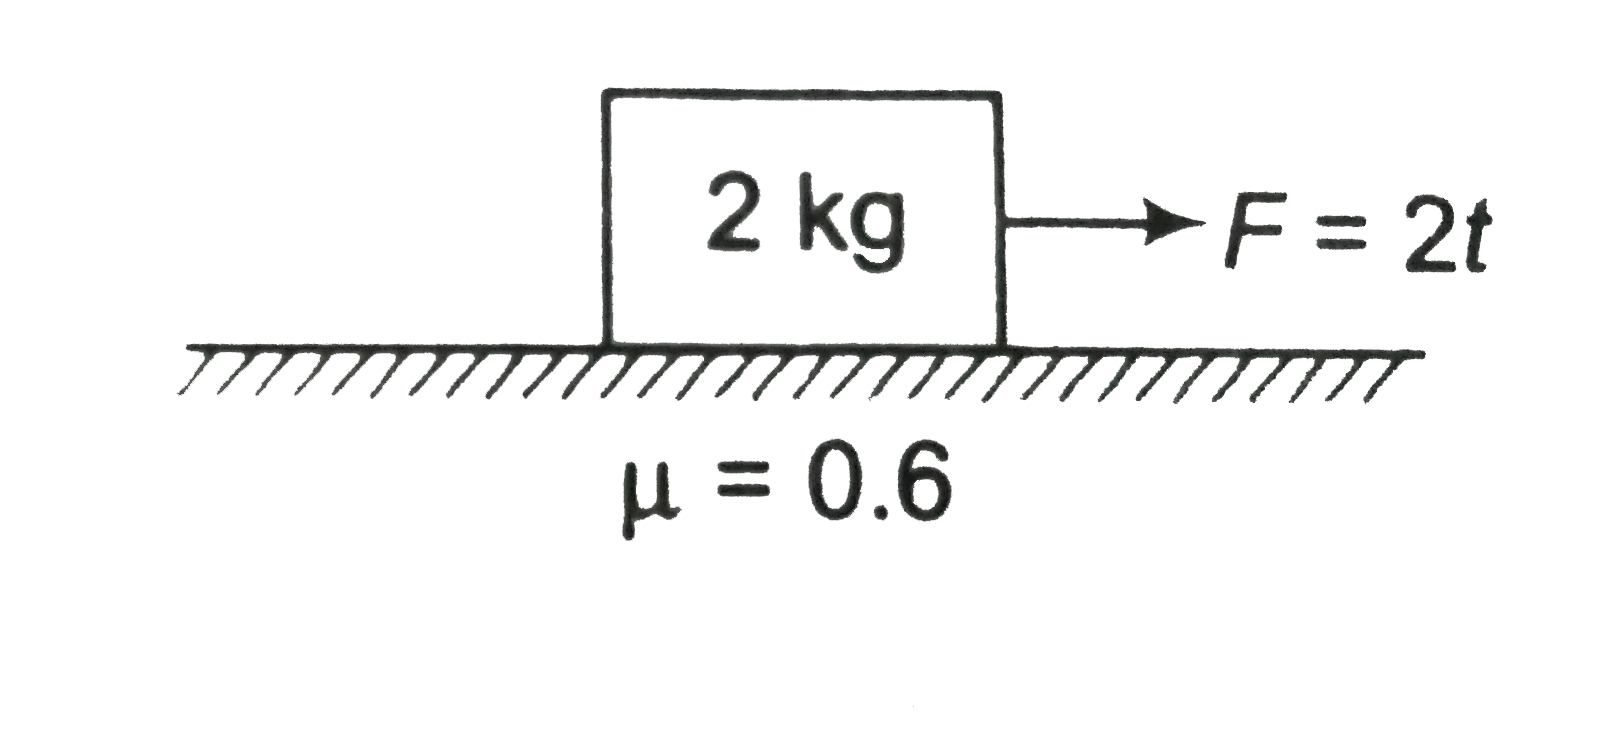
In the figure shown, F is in newton and t in seconds, Take g=10m/s2.
(a) Plot acceleration of the block versus time graph.
(b) Find force of friction at,t=2sandt=8s.

(a) Normal reation, R=mg=20N. Limiting value of friction ,f1=μR=0.6×20=12N The applied force F(=2t) crosses this limiting value of friction at 6s, therefore ,upto 6s block remain stationary and after 6s it starts moving. After 6s friction becomes constant at 12N but the applied force keeps on increasing. Therefore, acceleration keeps on increasing.
For t≤6s
f=F=2t ...(i)
Fnet=F−f=0
a=Fnetm=0
For t>6s
f=2t
f=12N=f1 ...(ii)
Fnet=F−f=2t−12
a=Fnetm=2t−122=(t−6)
∴a−t graph is a straight line with slop =1 and intercept =−6. Corresponding a−t graph is as shown.
(b) At t=2s,f=4N [fromEq. (i)]
At t=8s,f=12N [fromEq. (ii)]
Topper's Solved these Questions
- LAWS OF MOTIONBook:DC PANDEY ENGLISHChapter:LAWS OF MOTIONExercise:Miscellaneous Examples
Explore 9 Videos
- LAWS OF MOTIONBook:DC PANDEY ENGLISHChapter:LAWS OF MOTIONExercise:Exercise 8.1
Explore 10 Videos
- LAWS OF MOTIONBook:DC PANDEY ENGLISHChapter:LAWS OF MOTIONExercise:Medical entrances gallery
Explore 39 Videos
- KINEMATICS 1Book:DC PANDEY ENGLISHChapter:KINEMATICS 1Exercise:INTEGER_TYPE
Explore 15 Videos
- LAWS OF THERMODYNAMICSBook:DC PANDEY ENGLISHChapter:LAWS OF THERMODYNAMICSExercise:Level 2 Subjective
Explore 18 Videos
Similar Questions
In the figure shown q is in coulomb and t in second. At time t=1s

View SolutionIn the figure shown ,find :(g=10m/s2)
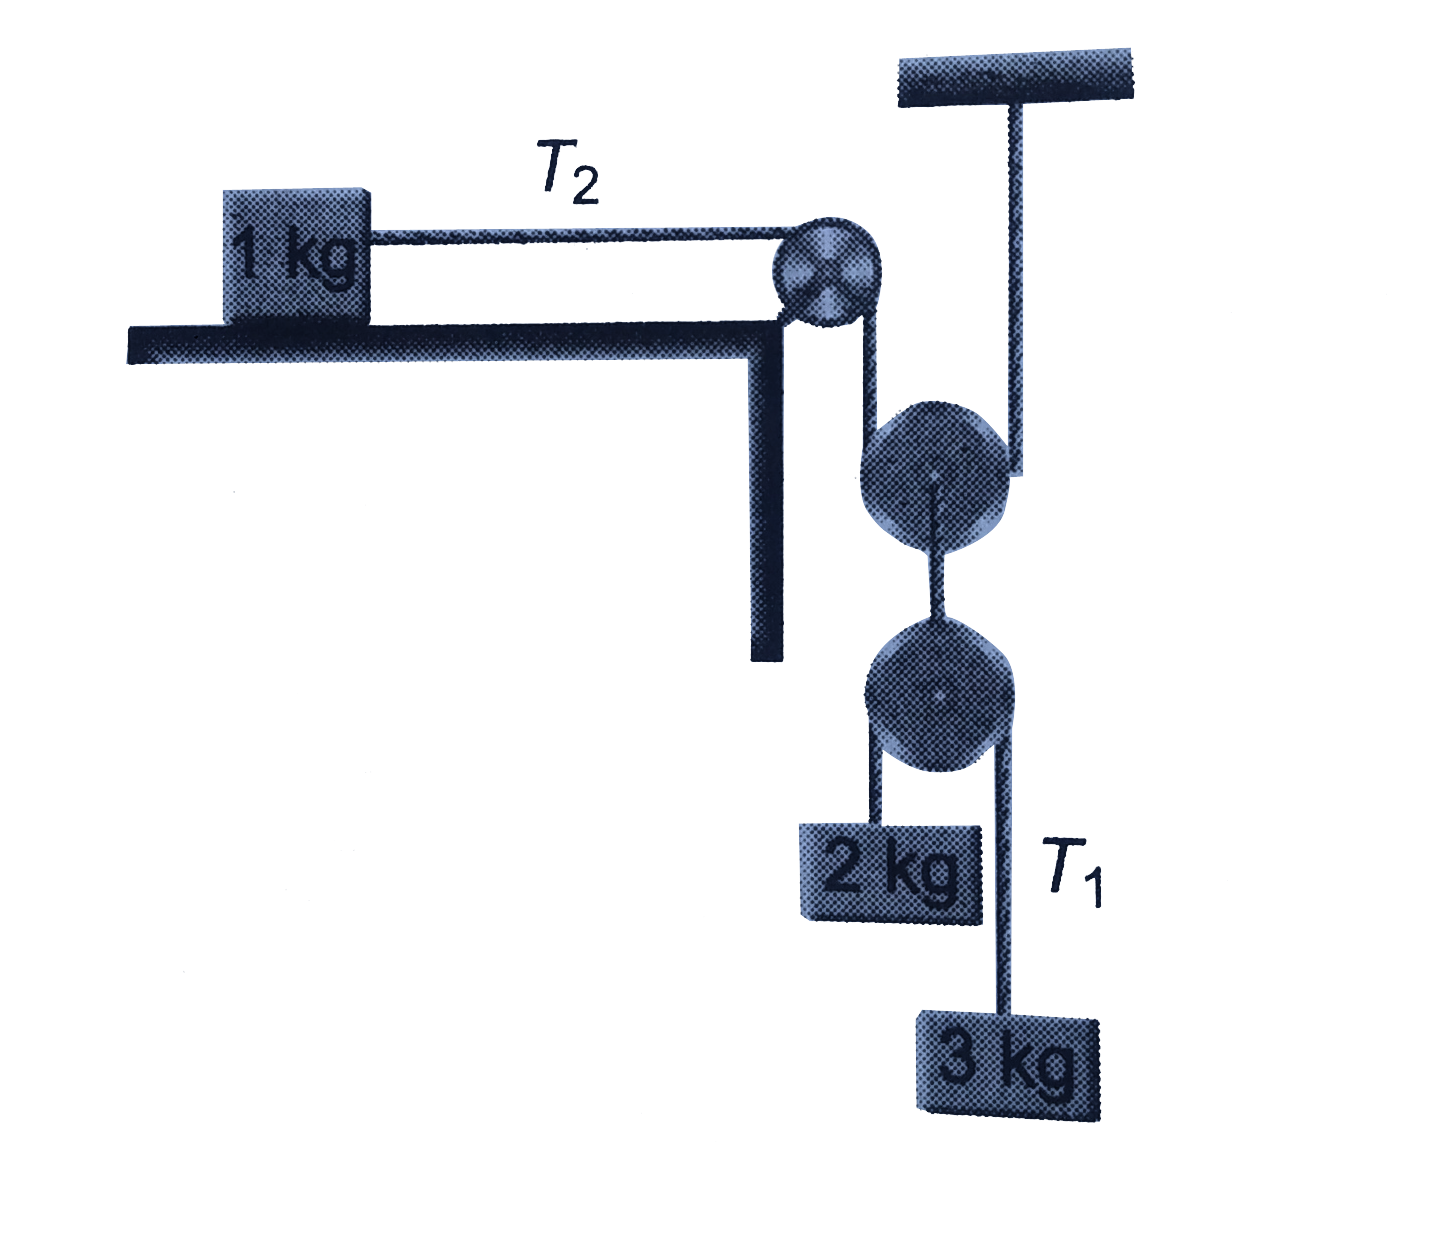
(a) acceleration of 1kg,2kg and 3kg blocks and
(b) tension T1 and T2.
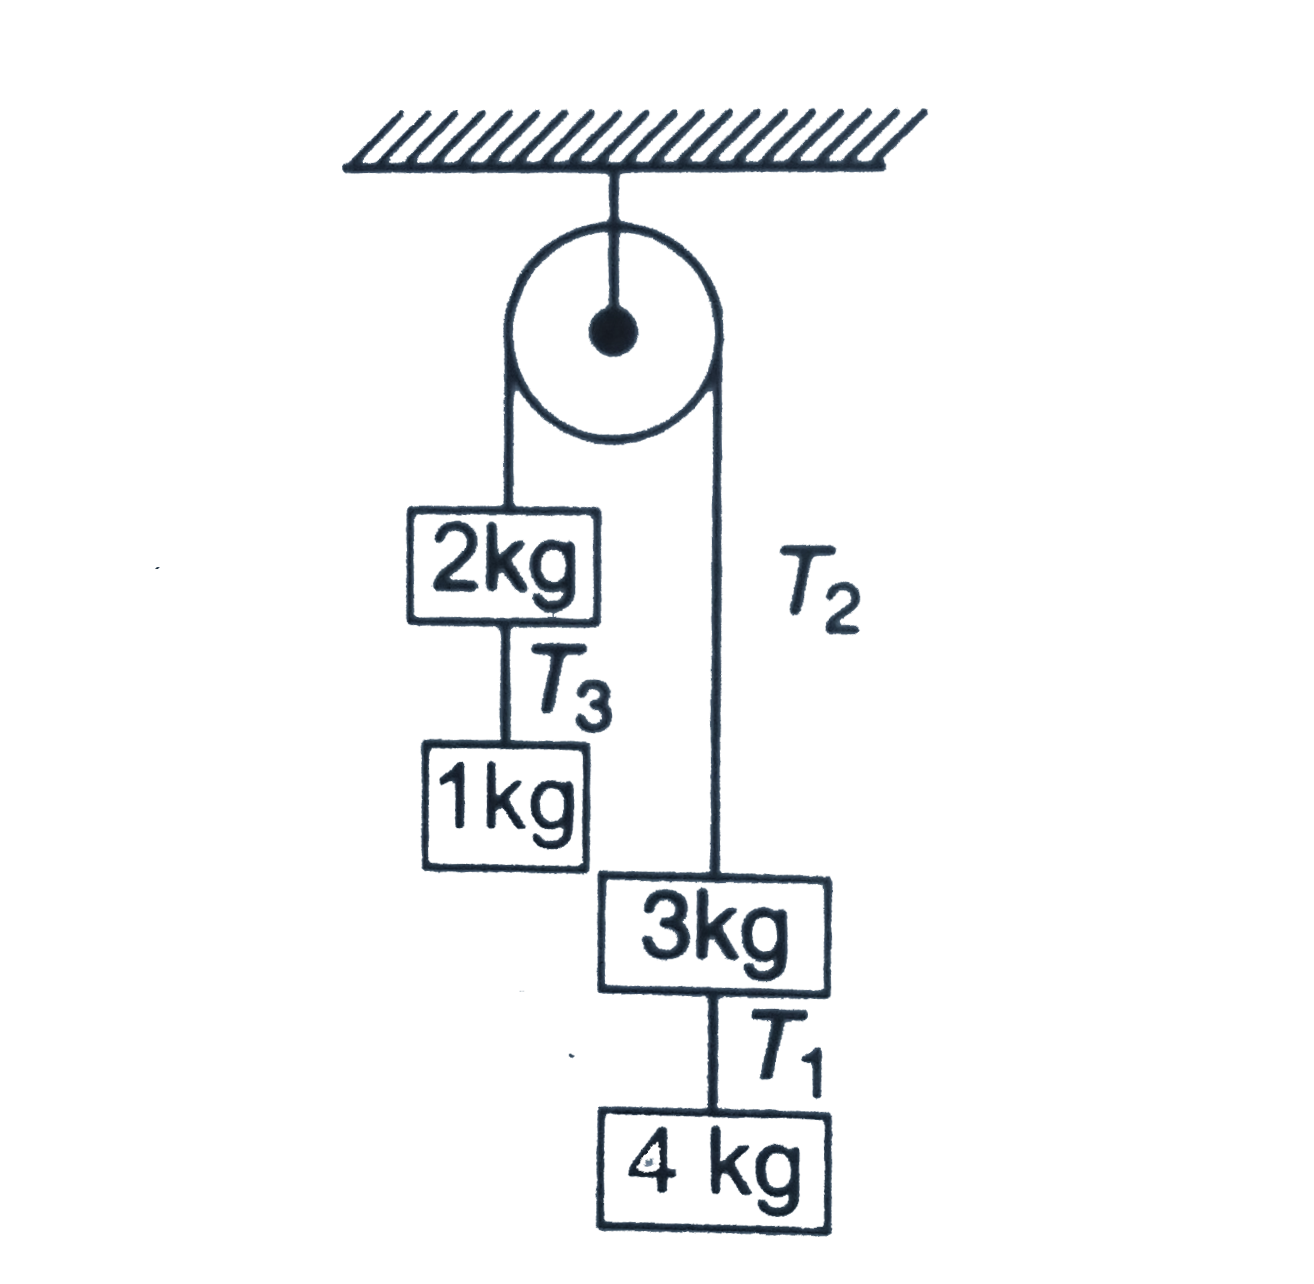
View SolutionIn the figure shown, find acceleration of the system and tenslons T1,T2andT3(Take=10m/s2)
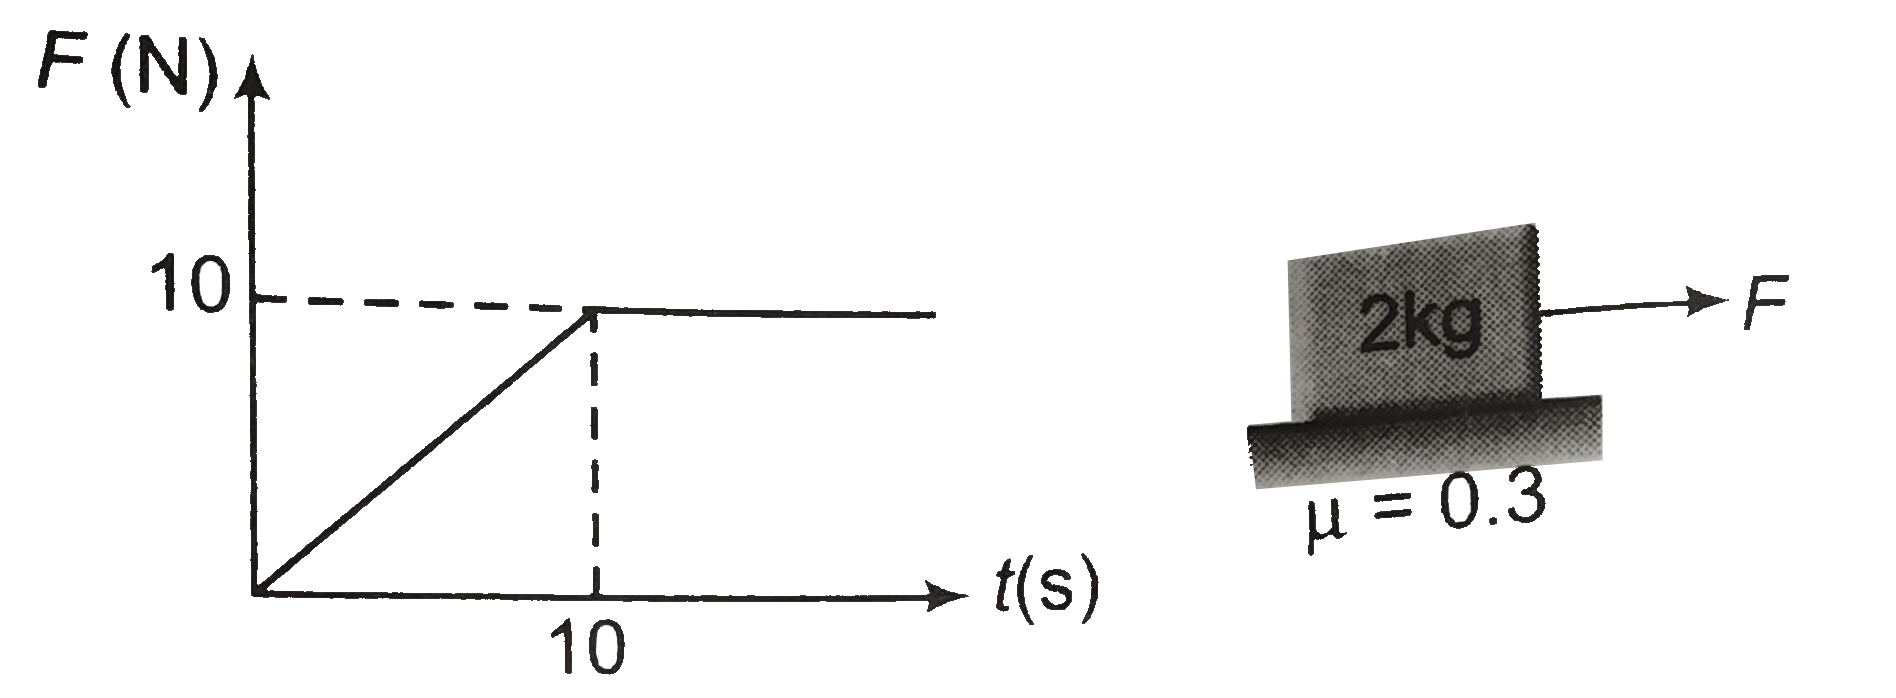
View SolutionForce acting on a block versus time graph is as shown in figure Choose the correct options.(g=10m/s−2)
View SolutionIn the given diagram, the block of mass 2 kg and 3 kg are placed one over the other . The contact surfaces are rough with coefficient of friction μ1=0.2,μ92)=0.06) . A force F=12t N ( where t is in second ) is applied on upper block in the direction ( Given that g = 10m/s2)

The acceleration time graph for 4 kg block is : Friction force acting between the two blocks at t=8 s
View SolutionFind the acceleration of the two blocks shown in figure-2.101.Take g=10m/s2
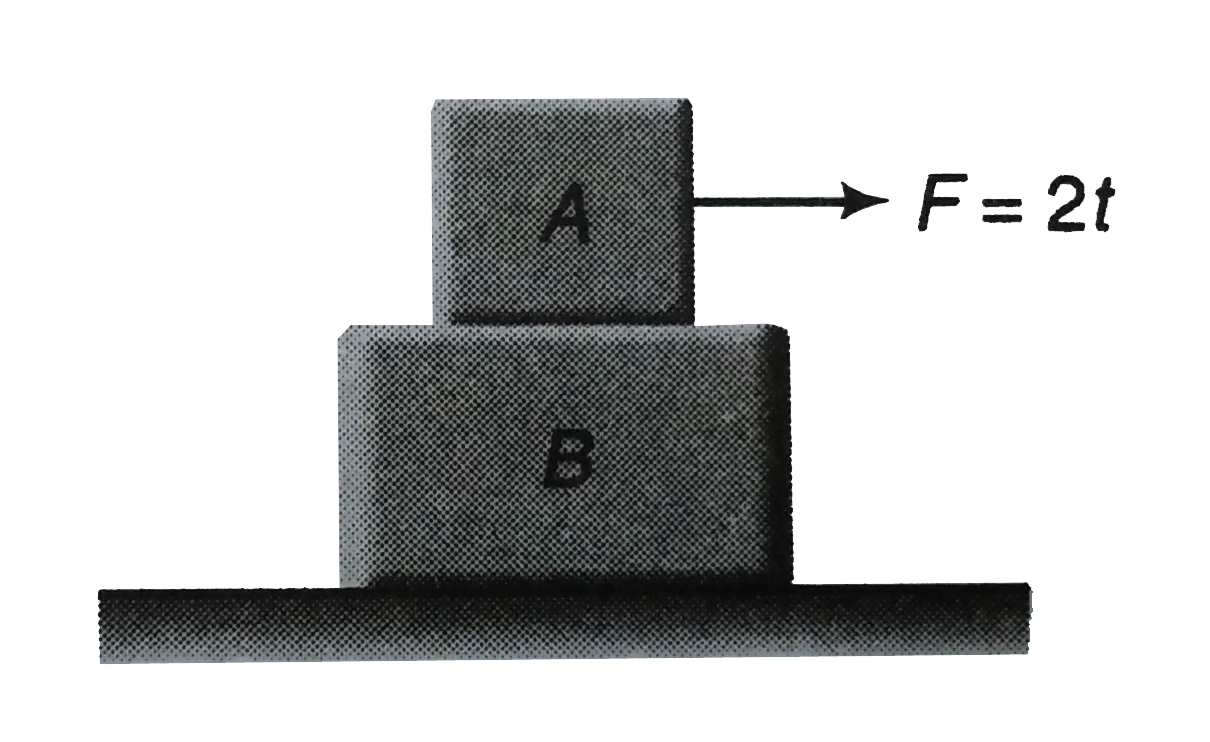
View SolutionTwo blocks A and B of masses 2kg and 4kg are placed one over the other as shown in figure. Atime varying horizontal force F=2t is applied on the upper block as shown in figure. Here t is in second and F is in newton. Drow a graph showing acceleration of A and B on y-axis and time on x-axis.Coefficient of friction between A and B is μ=12 and the horizontal surface over which B is placed smooth. (g=10m/s2)
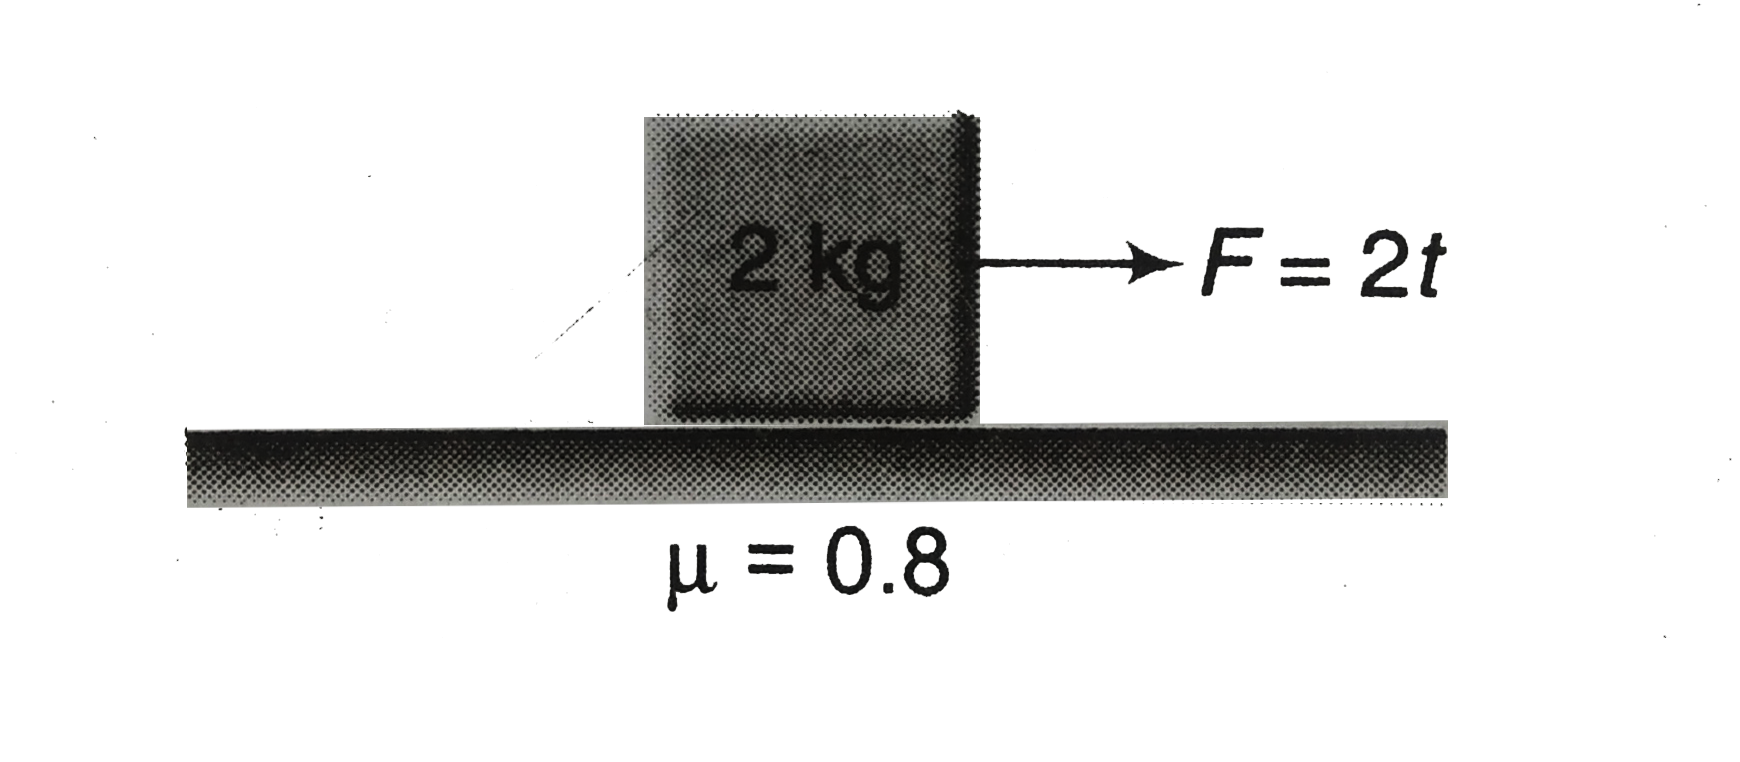
View SolutionA 2kg block is kept over a ground with coefficient of friction μ=0.8 as shown in figure. A time varying force F=2t(F in newton and t in second) is applied on the block. Plot a graph between acceleration of block versus time (g=10m/s2)
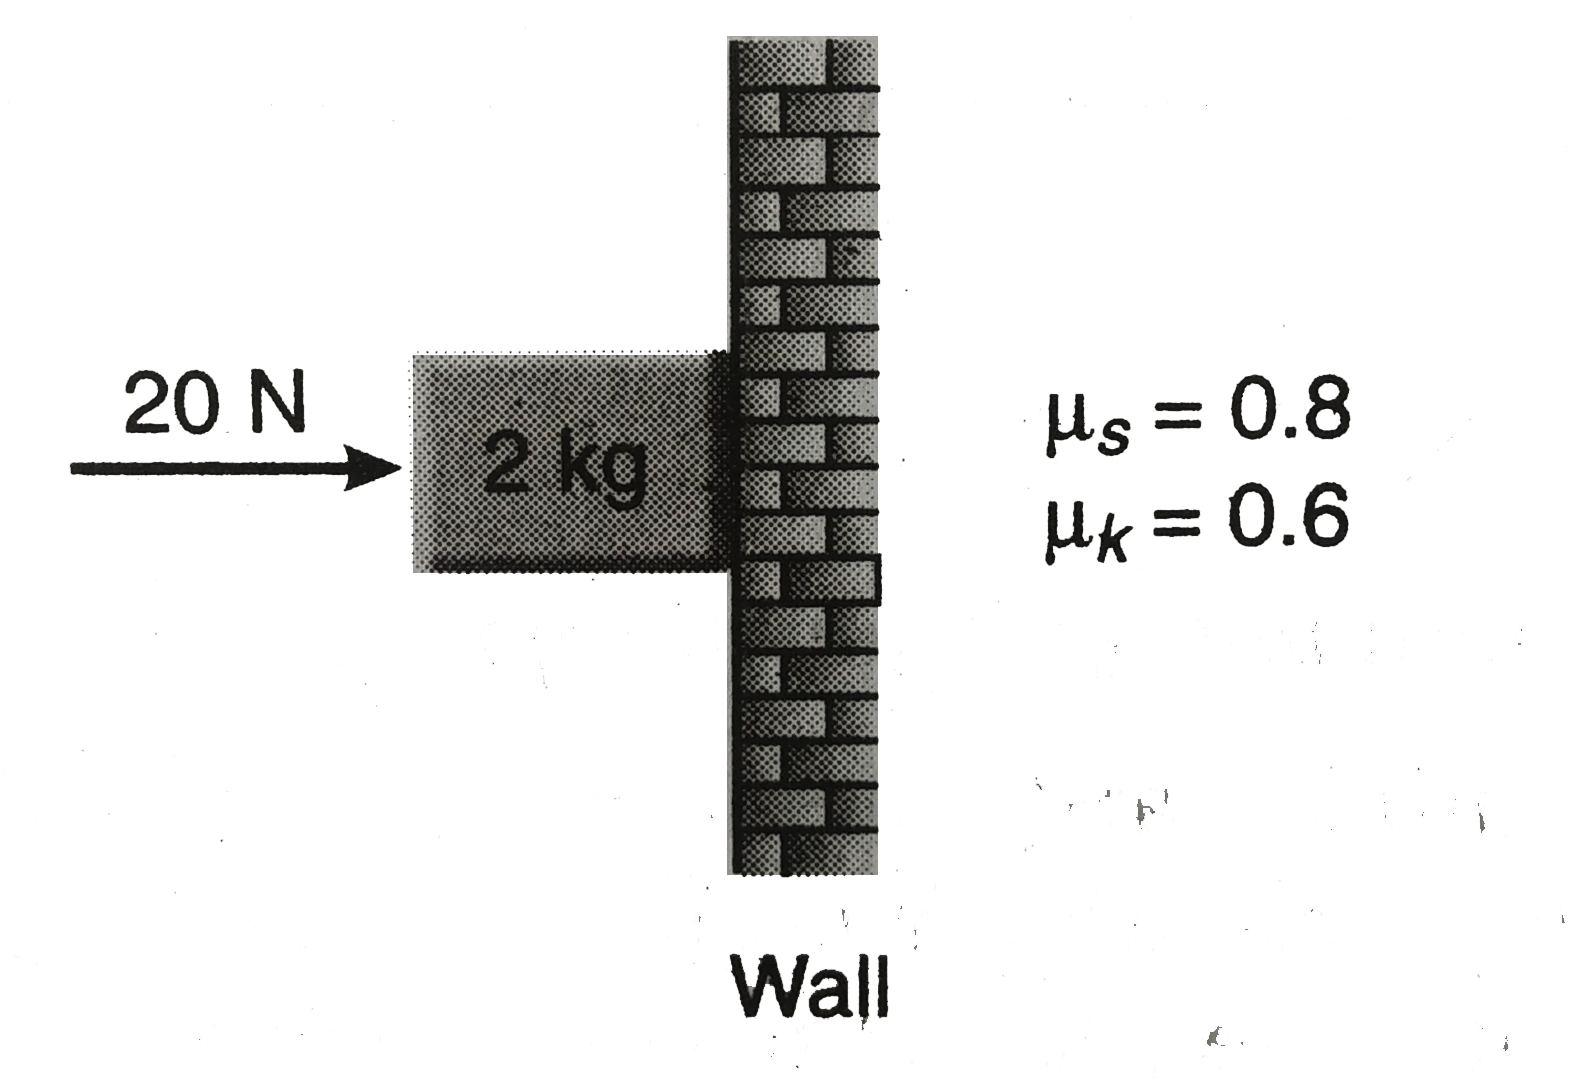
View SolutionA 2kg block is present against a rough wall by a force F=20N as shown in figure .Find acceleration of the block and force of friction acting on it .(Takeg=10m/s2)
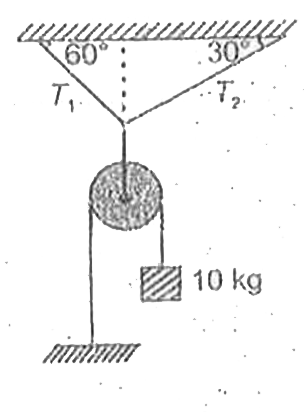
View SolutionIn the arrangement as shown, tension T2 is (g=10m/s2)
View Solution

