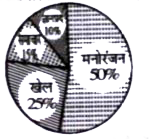
दिए हुए पाई चार्ट (आकृति देखें) के आधार पर निम्नलिखित प्रश्नों के उत्तर दीजिए :

(i) किस प्रकार के कार्यक्रम सबसे अधिक देखे जाते हैं ?
मनोरंजन
खेल
समाचार
इनमे से कोई नहीं
The correct Answer is:A
Step by step video, text & image solution for दिए हुए पाई चार्ट (आकृति देखें) के आधार पर निम्नलिखित प्रश्नों के उत्तर दीजिए : (i) किस प्रकार के कार्यक्रम सबसे अधिक देखे जाते हैं ? by Maths experts to help you in doubts & scoring excellent marks in Class 8 exams.
Updated on:21/07/2023Topper's Solved these Questions
- आँकड़ों का प्रबंधनBook:STUDENTS FRIENDSChapter:आँकड़ों का प्रबंधनExercise:EXERCISE 17.3 (Type II.)
Explore 9 Videos
- आँकड़ों का प्रबंधनBook:STUDENTS FRIENDSChapter:आँकड़ों का प्रबंधनExercise:EXERCISE 17.2 (वस्तुनिष्ठ एवं अतिलघु उत्तरीय प्रश्न) Type III. (दीर्घ उत्तरीय प्रश्न)
Explore 32 Videos
- आलेखों से परिचय Book:STUDENTS FRIENDSChapter:आलेखों से परिचय Exercise:EXERCISE 16.2 (दीर्घ उत्तरीय प्रश्न)
Explore 11 Videos
Similar Questions
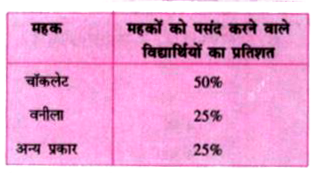
किसी स्कूल के विद्यार्थियों द्वारा पसंद किए जाने वाली आइसक्रीमों की महक या स्वाद (प्रतिशतों में) नीचे दिए गए हैं :

इन आँकड़ों को एक पाई चार्ट के रूप में निरूपित करें।
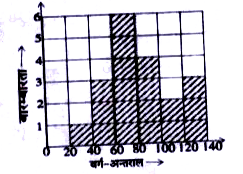
View Solutionबगल में दिये गये आयत-चित्र को देखकर निम्नांकित प्रश्नों के उत्तर दें :

(i) वर्ग अन्तराल 40−60 की बारम्बारता क्या है?
View Solution(मात्रा तथा मूल्य) निम्न तालिका पेट्रोल की मात्राएँ व उसके मूल्य बताती हैं :

इन आँकड़ों को दर्शाने के लिए आलेख बनाइए।
View SolutionHow many lines of symmetry does the above figure have ?
View SolutionWhich of the following are correct chain isomers of butane ? (i)
View SolutionDetermine the point of symmetry of a regular hexagon.
View SolutionDtermine the images of the following figure about the given line :
View SolutionMatch the following Column A to Column B

View SolutionMatch the following Column A to Column B

View SolutionMatch the following Column A to Column B

View SolutionThe inequation represented by the graph given below is :
View SolutionThe inequation that best describes the graph given below is _________
View SolutionThe inequation that best describes the following graph is _________
View SolutionWhich inequations represent the shaded region in the given figure
View SolutionMatch the followings (column I with column II)
ltimg src="https://d10lpgp6xz60nq.cloudfront.net/physics_images/NCERT_BIO_XI_C03_E01_011_Q01.png" width="80%"gt
View SolutionMatch column I with column II
ltimg src="https://d10lpgp6xz60nq.cloudfront.net/physics_images/NCERT_BIO_XI_C16_E01_002_Q01.png" width="80%"gt
View Solution