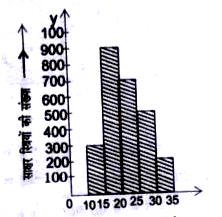
किसी शहर के 10–35 आयु-वर्ग की साक्षर स्त्रियों को दिए गए आयत-चित्र द्वारा दर्शाया गया है। इस आयत-चित्र को देखकर निम्नांकित प्रश्नों के उत्तर दें :

(i) वर्गों का आकार क्या है ?
The correct Answer is:5
Step by step video, text & image solution for किसी शहर के 10–35 आयु-वर्ग की साक्षर स्त्रियों को दिए गए आयत-चित्र द्वारा दर्शाया गया है। इस आयत-चित्र को देखकर निम्नांकित प्रश्नों के उत्तर दें : (i) वर्गों का आकार क्या है ? by Maths experts to help you in doubts & scoring excellent marks in Class 8 exams.
Updated on:21/07/2023Topper's Solved these Questions
- आँकड़ों का प्रबंधनBOOK - STUDENTS FRIENDSCHAPTER - आँकड़ों का प्रबंधनEXERCISE - EXERCISE 17.3 (Type I.)
14 Videos
- आँकड़ों का प्रबंधनBOOK - STUDENTS FRIENDSCHAPTER - आँकड़ों का प्रबंधनEXERCISE - EXERCISE 17.3 (Type II.)
9 Videos
- आँकड़ों का प्रबंधनBOOK - STUDENTS FRIENDSCHAPTER - आँकड़ों का प्रबंधनEXERCISE - EXERCISE 17.2 (वस्तुनिष्ठ एवं अतिलघु उत्तरीय प्रश्न) Type II. (दीर्घ उत्तरीय प्रश्न)
8 Videos
- आलेखों से परिचय BOOK - STUDENTS FRIENDSCHAPTER - आलेखों से परिचय EXERCISE - EXERCISE 16.2 (दीर्घ उत्तरीय प्रश्न)
11 Videos
Similar Questions
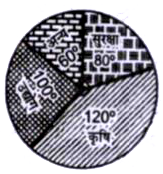
दिया गया वृत्त चार्ट किसी देश के खर्च को प्रदर्शित करता है। यदि देश का कुल खर्च 180 करोड़ रुपये माना जाय, तो वहाँ कृषि पर कितना खर्च होता है?

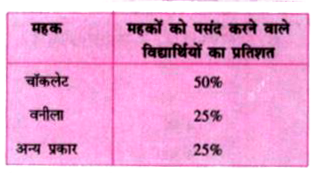
View Solutionकिसी स्कूल के विद्यार्थियों द्वारा पसंद किए जाने वाली आइसक्रीमों की महक या स्वाद (प्रतिशतों में) नीचे दिए गए हैं :

इन आँकड़ों को एक पाई चार्ट के रूप में निरूपित करें।
View Solutionकिसी कक्षा के 25 छात्रों द्वारा भूगोल में प्राप्तांक निम्नांकित हैं : 56415364315333706174325356645688387056647453536131
वर्ग-अन्तराल 30−40 (40 सम्मिलित नहीं) आदि, आदि लेकर एक बारम्बारता बंटन सारणी बनायें।
View Solution(मात्रा तथा मूल्य) निम्न तालिका पेट्रोल की मात्राएँ व उसके मूल्य बताती हैं :

इन आँकड़ों को दर्शाने के लिए आलेख बनाइए।
View SolutionWhich of the following are correct chain isomers of butane ? (i)
View SolutionDetermine the point of symmetry of a regular hexagon.
View SolutionDtermine the images of the following figure about the given line :
View SolutionMatch the following Column A to Column B

View SolutionMatch the following Column A to Column B

View SolutionMatch the following Column A to Column B

View SolutionThe inequation represented by the graph given below is :
View SolutionThe inequation that best describes the graph given below is _________
View SolutionThe inequation that best describes the following graph is _________
View SolutionMatch the followings (column I with column II)
ltimg src="https://d10lpgp6xz60nq.cloudfront.net/physics_images/NCERT_BIO_XI_C03_E01_011_Q01.png" width="80%"gt
View SolutionMatch column I with column II
ltimg src="https://d10lpgp6xz60nq.cloudfront.net/physics_images/NCERT_BIO_XI_C16_E01_002_Q01.png" width="80%"gt
View SolutionMatch column I with column II:
ltimg src="https://d10lpgp6xz60nq.cloudfront.net/physics_images/NCERT_BIO_XI_C18_E01_003_Q01.png" width="80%"gt
View Solution
