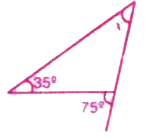
निम्न आकृतियों में अज्ञात अंत:कोण x का मान ज्ञात कीजिए।

The correct Answer is:
Step by step video, text & image solution for निम्न आकृतियों में अज्ञात अंत:कोण x का मान ज्ञात कीजिए। by Maths experts to help you in doubts & scoring excellent marks in Class 7 exams.
Updated on:21/07/2023Topper's Solved these Questions
- त्रिभुज और उसके गुण Book:STUDENTS FRIENDSChapter:त्रिभुज और उसके गुण Exercise:EXERCISE 9A (रिक्त स्थानों को भरे : )
Explore 6 Videos
- त्रिभुज और उसके गुण Book:STUDENTS FRIENDSChapter:त्रिभुज और उसके गुण Exercise:EXERCISE 9A
Explore 16 Videos
- ठोस आकारों का चित्रणBook:STUDENTS FRIENDSChapter:ठोस आकारों का चित्रणExercise:EXERCISE 14B
Explore 13 Videos
- त्रिभुजों की सर्वांगसमता Book:STUDENTS FRIENDSChapter:त्रिभुजों की सर्वांगसमता Exercise:Exercise 10 (दीर्घ उत्तरीय प्रश्न)
Explore 22 Videos
Similar Questions
किसी त्रिभुज में ....... शीर्ष होते है |
View SolutionΔDEF की भुजाओं DE और EF का अंतर्गत कोण कौन-सा है? .
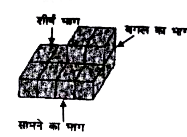
View Solutionनिम्नांकित की ऊपरी सतह की आकृति,सामने की आकृति और बगल की आकृति को खींचें।

View Solutionदो त्रिभुजों के कुछ भागों कि निम्न माप दी गई है। S-A-S सर्वांगसमता प्रतिबंध का उपयोग करके जाँच कीजिए कि दोनों त्रिभुज सर्वांगसम हैं अथवा नहीं ? यदि त्रिभुज सर्वांगसम हैं तो उन्हें सांकेतिक रूप में लिखिए।
ΔABC
(a) AB=7cm,BC=5cm,∠B=50∘
(b) AB=4.5cm,AC=4cm,∠A=60∘
(c) BC=6cm,AC=4cm,∠B=35∘
ΔDEF
(a) DE=5cm,EF=7cm,∠E=90∘
(b) DE=4cm,FD=4.5cm,∠D=55∘
(c) DF=4cm,EF=6cm,∠E=35∘
View SolutionIdentify the cell organelle 'A' :-
ltimg src="https://d10lpgp6xz60nq.cloudfront.net/physics_images/ALN_BIO_C10_E08_018_Q01.png" width="80%"gt
View SolutionHow many lines of symmetry does the above figure have ?
View SolutionWhich of the following are correct chain isomers of butane ? (i)
View SolutionDetermine the point of symmetry of a regular hexagon.
View SolutionDtermine the images of the following figure about the given line :
View SolutionMatch the following Column A to Column B

View SolutionMatch the following Column A to Column B

View SolutionMatch the following Column A to Column B

View SolutionThe inequation represented by the graph given below is :
View SolutionThe inequation that best describes the graph given below is _________
View SolutionThe inequation that best describes the following graph is _________
View SolutionWhich inequations represent the shaded region in the given figure
View Solution