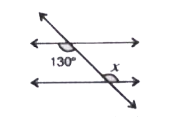
संलग्न आकृति में m∣∣n हैं , x का मान ज्ञात करें।

50∘
90∘
110∘
130∘
The correct Answer is:D
Step by step video, text & image solution for संलग्न आकृति में m||n हैं , x का मान ज्ञात करें। by Maths experts to help you in doubts & scoring excellent marks in Class 7 exams.
Updated on:21/07/2023Topper's Solved these Questions
- रेखा एवं कोण BOOK - STUDENTS FRIENDSCHAPTER - रेखा एवं कोण EXERCISE - Exercise 1B वस्तुनिष्ठ प्रश्न
3 Videos
- रेखा एवं कोण BOOK - STUDENTS FRIENDSCHAPTER - रेखा एवं कोण EXERCISE - Exercise 1B लघु उत्तरीय प्रश्न
2 Videos
- रेखा एवं कोण BOOK - STUDENTS FRIENDSCHAPTER - रेखा एवं कोण EXERCISE - Exercise 8A (अतिलघु उत्तरीय प्रश्न ) (रिक्त स्थान )
1 Videos
- राशियों की तुलनाBOOK - STUDENTS FRIENDSCHAPTER - राशियों की तुलनाEXERCISE - EXERCISE 7E
29 Videos
- सममिति BOOK - STUDENTS FRIENDSCHAPTER - सममिति EXERCISE - EXERCISE 13B
10 Videos
Similar Questions
यदि किसी चतुर्भुज की सम्मुख भुजाएँ समांतर हो तथा प्रत्येक कोण समकोण हो लेकिन चारों भुजाएँ आपस में बराबर न हो तो उस चतुर्भुज का उपयुक्त नाम है :
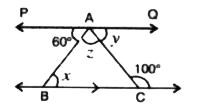
View Solutionदी गई चित्र में BC∣∣PQ तो x,y,z का मान ज्ञात करें।

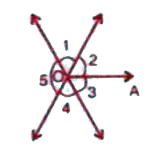
View Solutionसंलग्न आकृति में निम्नलिखित कोण युग्मों के नाम दीजिए।

(i) आसन्न कोण
View Solutionमिश्रधन = मूलधन …………… ब्याज
View Solutionनिम्नलिखित में से कौन-से आकारों (दी गई आकृति में) मे अकित बिंदु के परितः (चारों ओर) 1 से अधिक क्रम की घूर्णन सममिति है?

View SolutionHow many lines of symmetry does the above figure have ?
View SolutionWhich of the following are correct chain isomers of butane ? (i)
View SolutionDetermine the point of symmetry of a regular hexagon.
View SolutionDtermine the images of the following figure about the given line :
View SolutionMatch the following Column A to Column B

View SolutionMatch the following Column A to Column B

View SolutionMatch the following Column A to Column B

View SolutionFind the area of the figure given below.

View SolutionThe area of the shaded part in the figure given below is ______.

View SolutionThe inequation represented by the graph given below is :
View SolutionThe inequation that best describes the graph given below is _________
View Solution
