Draw the P-T and V-T diagrams for an isobaric process of expansion, corresponding to n moles of an ideal gas at a pressure P0, from V0 to 2V0. Solution in Telugu
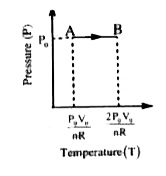
For the graph of P versus T the variation is a straight line normal to the pressure axis, the temperature varying from T1 to T2 as shown figure.
From the gas equation PV = nRT

we have, V=(nRP0)TorV∝T
At V=V0,T1=P0V0nRand at V=2V0,T2=2P0V0nR

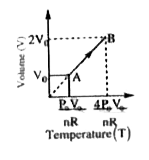
From the graph of V versus T, the equation V=(nRP0)TorV=kT shows that the volume varies directly, as the temperature (Charles. law). So, the graph is a straight line inclined to the (V-T) axis, and passing through the origin (when produced) as shown in figure.
Similar Questions
Draw the P-T and V-T diagrams of an isochoric process of n moles of an ideal gas from pressure P0, volume V0 to pressure 4P0, indicating the pressures, and temperatures, of the gas, in the initial and the final stage.
View SolutionDraw the P-T and V-T diagrams for an isobaric process of expansion, corresponding to n moles of an ideal gas at a pressure P0, from V0 to 2V0.
View SolutionDraw the P-T and V-T diagrams for an isothermal process, corresponding to one mole of an ideal gas at an initial pressure and volume P_(0) and V_(0) respectively, expanding to a volume 2V_(0) .
View SolutionDraw the P-T and V-T diagrams of an isochoric process of n moles of an ideal gas from pressure P0, volume V0 to pressure 4P0, indicating the pressures, and temperatures, of the gas, in the initial and the final states.
View SolutionDraw the P-T and V-T diagrams for an isothermal process, corresponding to one mole of an ideal gas at an initial pressure and volume P0 and V0 respectively, expanding to a volume 2V0.
View SolutionOne mole of an ideal gas undergoes a process p=(p_(0))/(1+((V_(0))/(V))^(2)) . Here, p_(0) and V_(0) are constants. Change in temperature of the gas when volume is changed from V=V_(0) to V=2V_(0) is
View SolutionDraw the P-T and V-T diagrams of an isochoric process of n moles an ideal gas from pressure P0 volume V0 to pressure 4P0, indicating the pressures and temperatures of the gas in the initial and the final states.
View Solution
