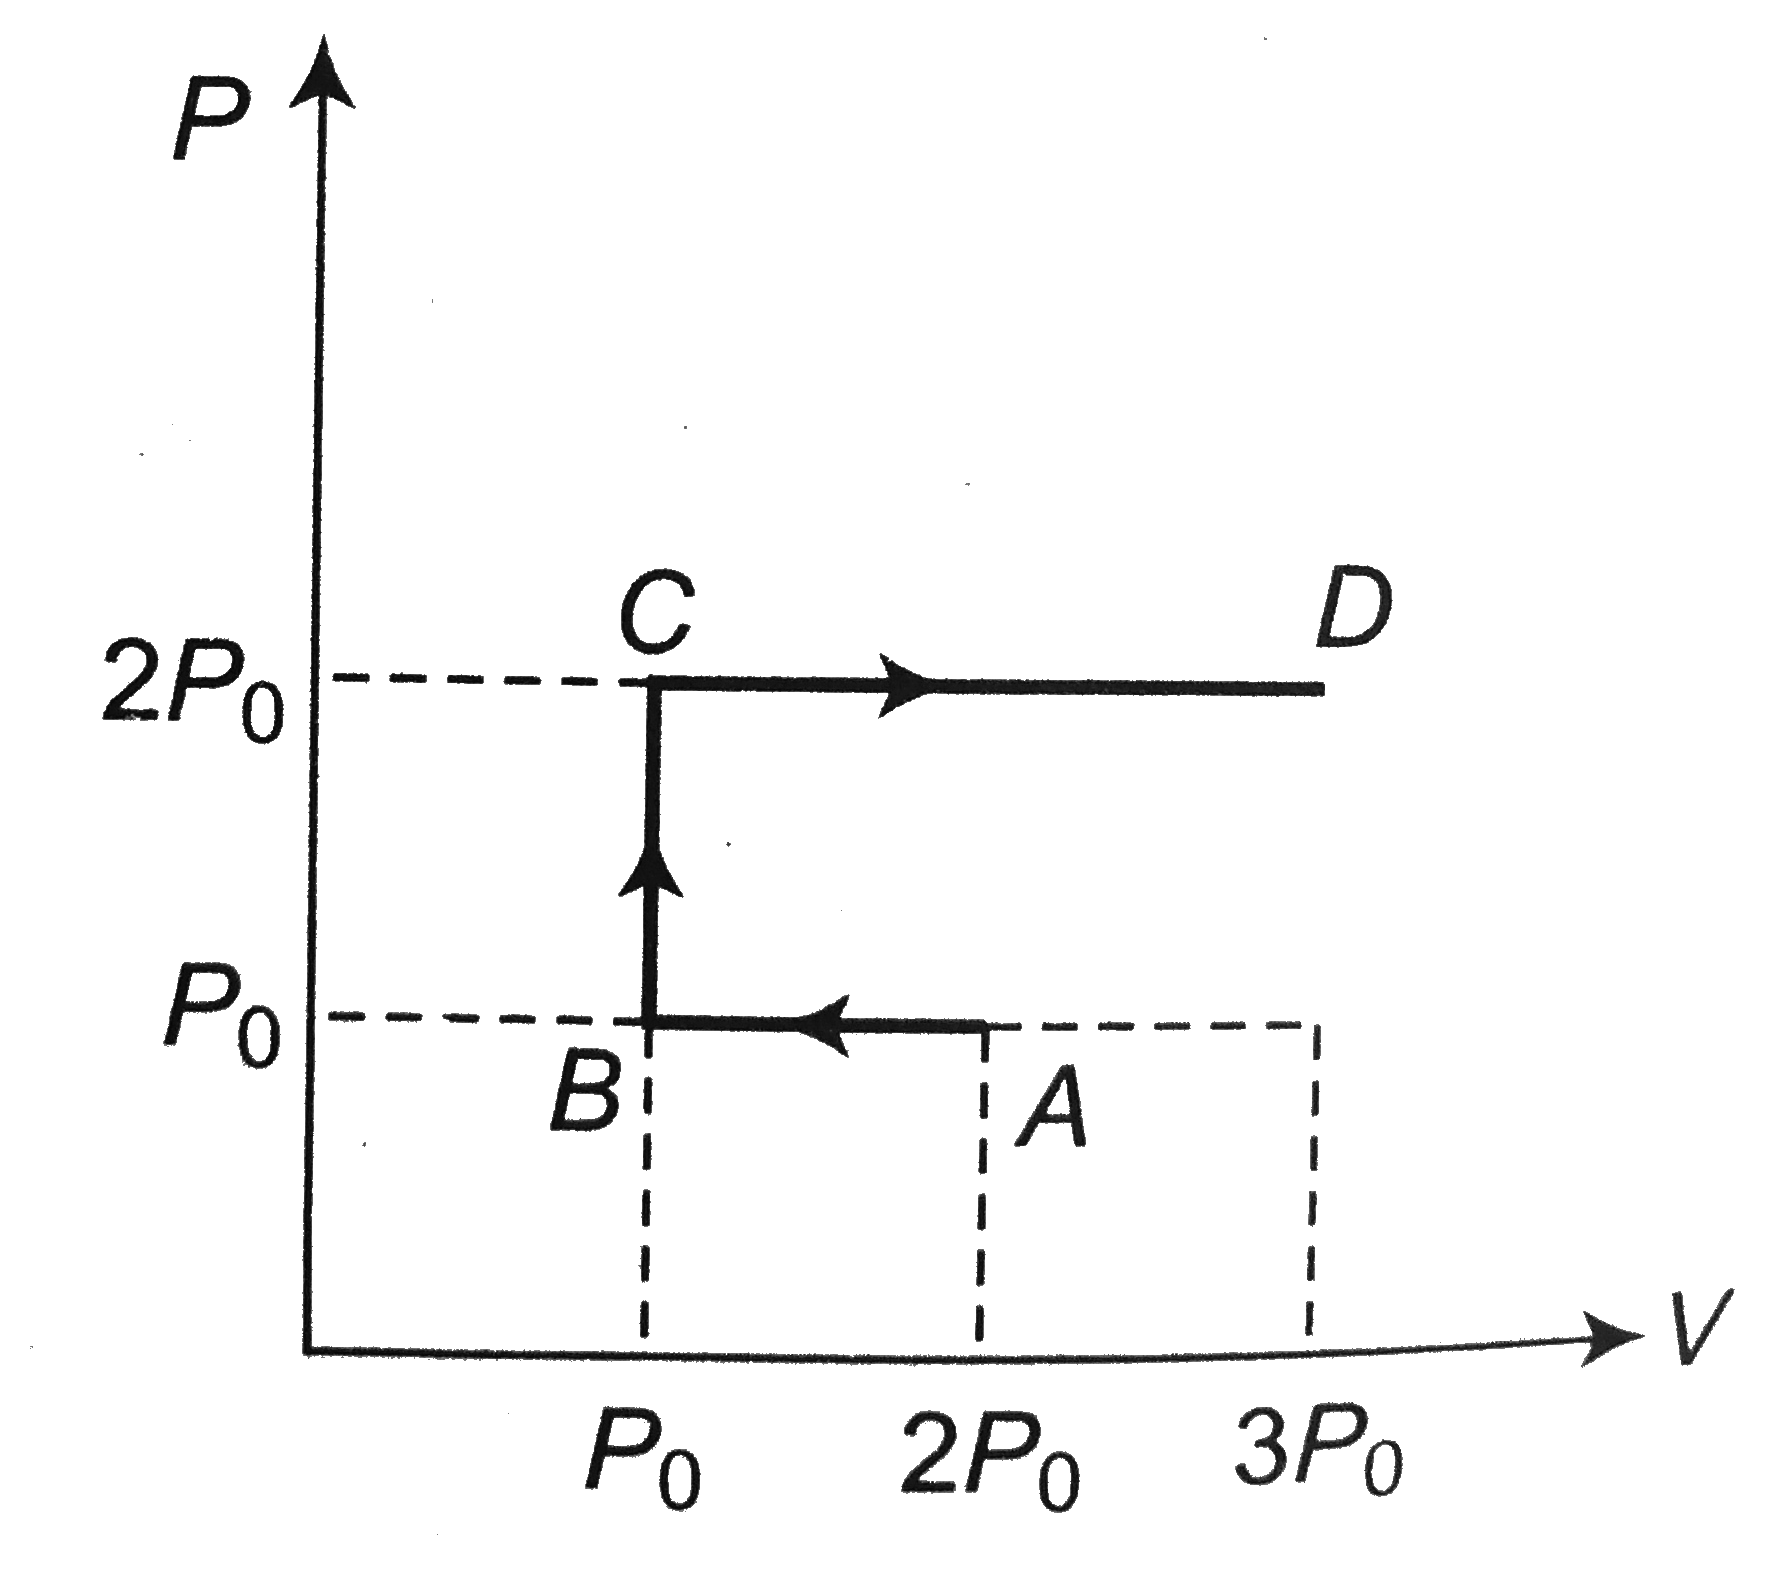
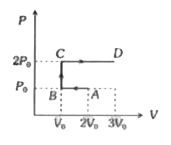
P-V diagram of an ideal gas is shown in the figure. Work done by the gas in the process ABCD is
 Solution in Telugu
3P0V0
P0V0
4P0V0
2P0V0
The correct Answer is:A
Step by step video, text & image solution for P-V diagram of an ideal gas is shown in the figure. Work done by the gas in the process ABCD is by Physics experts to help you in doubts & scoring excellent marks in Class 11 exams.
Updated on:21/07/2023Topper's Solved these Questions
- THERMODYNAMICSBook:AAKASH SERIESChapter:THERMODYNAMICSExercise:EXERCISE - 3
Explore 33 Videos
- THERMODYNAMICSBook:AAKASH SERIESChapter:THERMODYNAMICSExercise:EXERCISE - 1B
Explore 32 Videos
- THERMAL PROPERTIES OF MATTERBook:AAKASH SERIESChapter:THERMAL PROPERTIES OF MATTERExercise:ADDITIONAL PRACTICE EXERCISE (LEVEL - II) PRACTICE SHEET (ADVANCED) Integer/Subjective Type Questions
Explore 2 Videos
- THERMOMETRY Book:AAKASH SERIESChapter:THERMOMETRY Exercise:Numerical Exercise (LEVEL- 1)
Explore 11 Videos
Similar Questions
A bullet of mass 10×10−3 moving with a speed of 20ms−1 hits an ice block (0∘C) of 990g kept at rest on a frictionless floor and gets embedded in it. If ice takes 50% of K.E, the amount of ice melted (in grams) approximately is (J=4.2J/cal) (latent heat of ice=80cal/g)
View SolutionAssertion (A) & Reason (R ) Type Questions
(A): During a free expansion of an ideal gas workdone is zero
(R): Workdone against vacuum is zero
View SolutionA constant pressure gas thermometer has a volume of 200cc, 273.2cc and 525 .1cc at 0°C, 100°C and boiling point of sulphur respectively. The resistance possessed by a platinum wire at the same temperatures as above are 2.000Ω,2.778Ωand5.280Ω respectively. Estimate the boiling point of sulphur on the basis of the two sets of observations.
View SolutionIf a temperature scale defines the freezing point of water as 100∘C and the boiling as 0∘ what temperature on the scale corresponds to 25∘ C ?
View SolutionP−V diagram of an ideal gas is as shown in figure. Work done by the gas in process ABCD is
View SolutionAn ideal gas underoges cyclic process of ABCDA as shown in Given P−V diagram (figure)
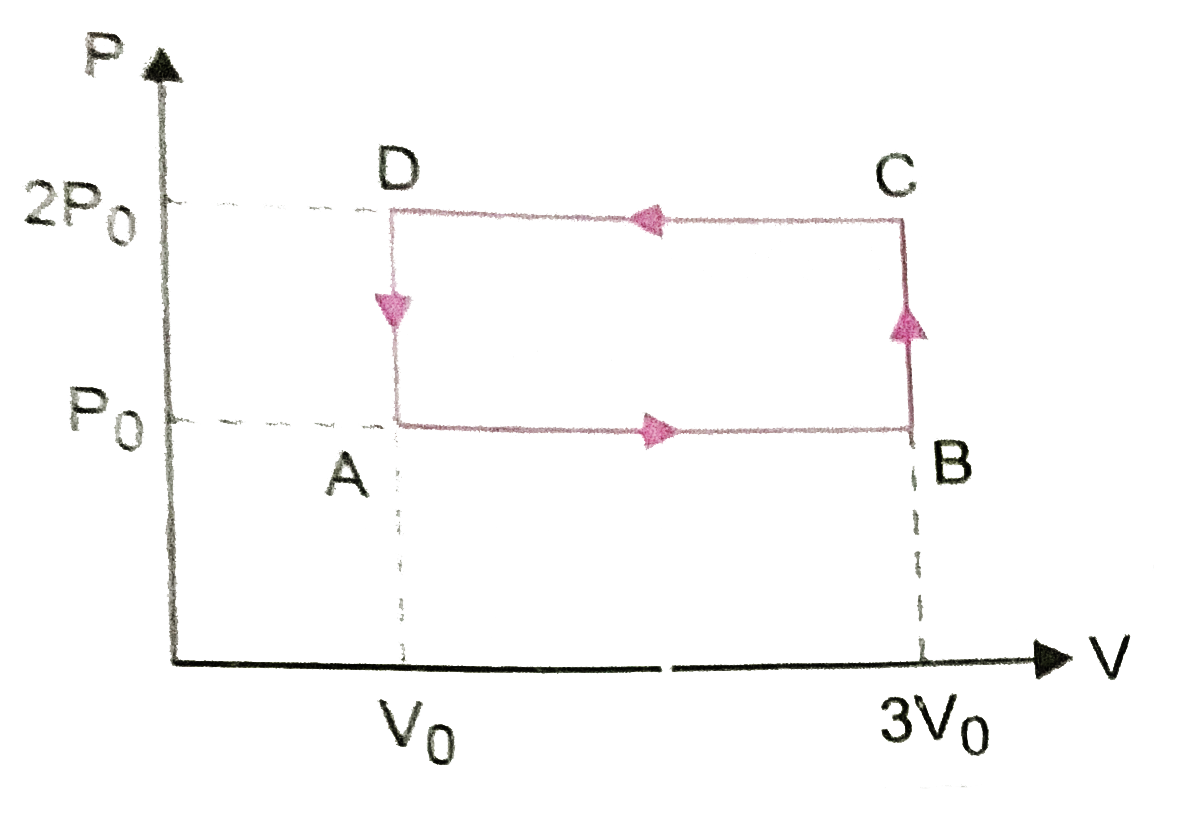
The amount of work done by the gas is
View SolutionV-T graph of a process of monoatomic ideal gas is shown in figure.
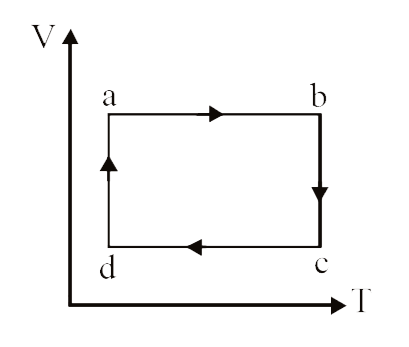
Sum of work done by the gas in process abod is-
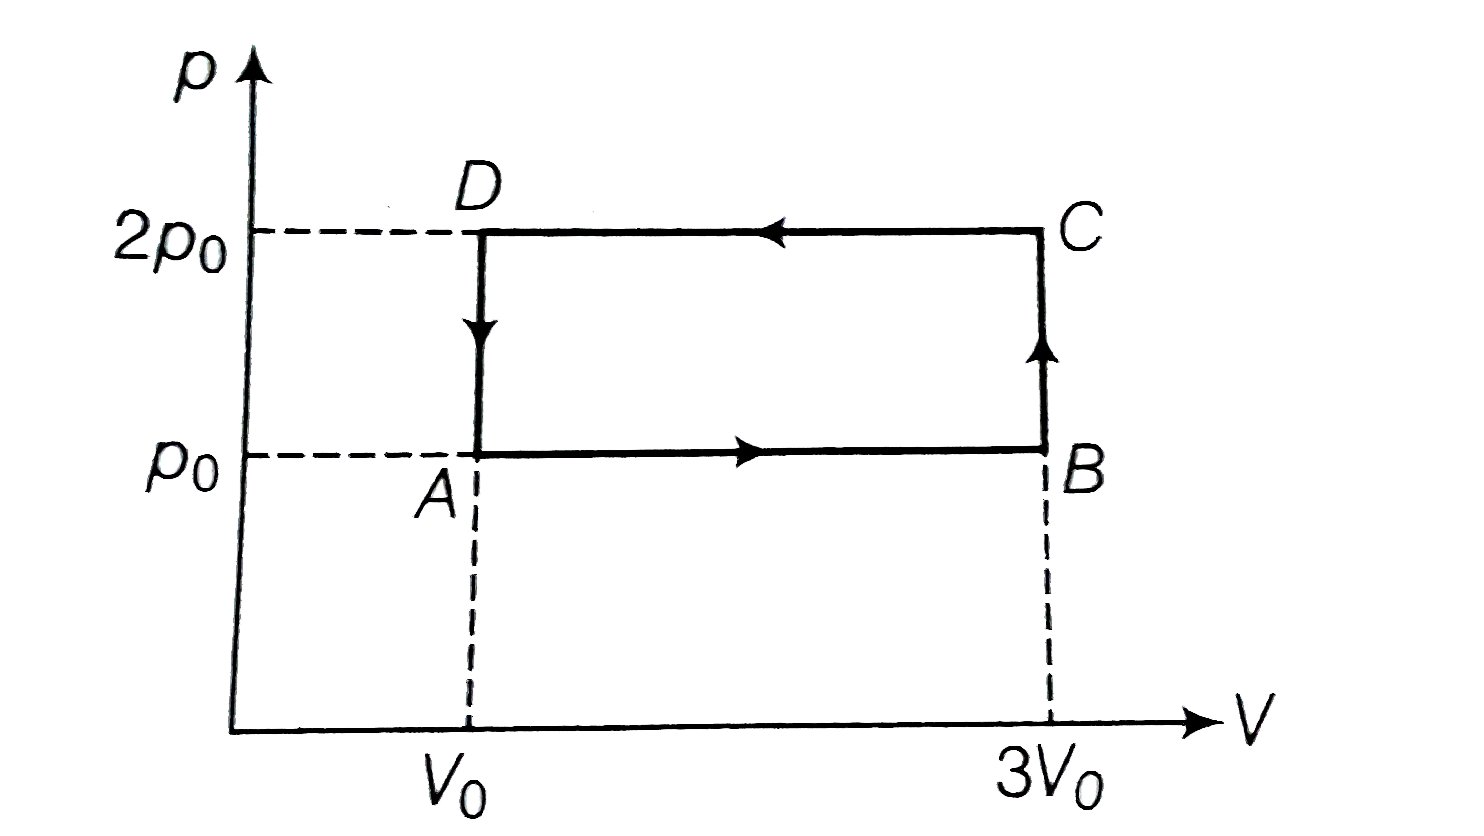
View SolutionAn ideal gas undergoes cyclic process ABCDA as shown in givend p−V diagram. The amount of work done by the gas is
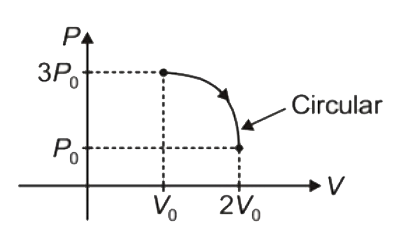
View SolutionOne mole of an ideal diatomic gas is taken through a process whose P−V diagram is shown in the figure. The work done by the gas is
View SolutionP – V graph of an ideal gas is as shown in the diagram . Work done by the gas in the process ABCD is
View SolutionP−V diagram of an ideal gas is as shown in figure. Work done by the gas in process ABCD is

View Solutionचित्र में, एक आदर्श गैस के P-V वक्र को दर्शाया गया है। गैस द्वारा प्रक्रम ABCD में किया गया कार्य है
View SolutionAn ideal gas undergoes cyclic process ABCDA as shown in given P - V diagram. The amount of work done by the gas is ___
View SolutionP-V diagram of an ideal gas is as shown in figure. Work done by the gas in the process ABCD is
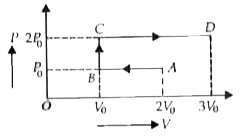
View SolutionAn ideal gas undergoes cyclic process ABCDA as shown in givend p-V diagram. The amount of work done by the gas is
View Solution

