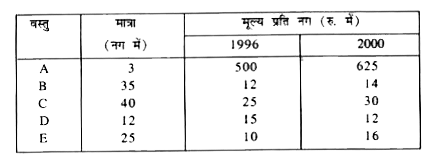
1996 को आधार वर्ष मानकर, निम्नलिखित आँकड़ों से, वर्ष 2000 का निर्वाह सूचकांक ज्ञात कीजिए।

The correct Answer is:122.66 ; वृद्धि 22.66
Step by step video, text & image solution for 1996 को आधार वर्ष मानकर, निम्नलिखित आँकड़ों से, वर्ष 2000 का निर्वाह सूचकांक ज्ञात कीजिए। by Maths experts to help you in doubts & scoring excellent marks in Class 9 exams.
Topper's Solved these Questions
- BOOK - S CHANDCHAPTER - निर्वाह सूचकांकEXERCISE - प्रश्नावली 13.134videos
निर्वाह सूचकांक
- BOOK - S CHANDCHAPTER - दो चरों वाले रैखिक समीकरण EXERCISE - प्रश्नावली 7.228videos
दो चरों वाले रैखिक समीकरण
- BOOK - S CHANDCHAPTER - पाठ्य पुस्तक (एन.सी.ई.आर.टी) के मुख्य मुख्य प्रश्नो के हल की तालिका EXERCISE - पुनरावृत्ति प्रश्नावली (पुनरावृत्ति प्रश्नावली - IV)18videos
पाठ्य पुस्तक (एन.सी.ई.आर.टी) के मुख्य मुख्य प्रश्नो के हल की तालिका
Similar Questions
1990 को आधार वर्ष मानकर, निम्नलिखित आँकड़ों से, वर्ष 2000 का निर्वाह सूचकांक ज्ञात कीजिए।
 01:37View Solution
कोटि 0 वाले बिन्दु कहाँ पर स्थित होते है ?
06:07View Solution32.12¯¯¯¯35 को pq के रूप में व्यक्त करें।
02:11View SolutionHow many lines of symmetry does the above figure have ?
01:31View SolutionWhich of the following are correct chain isomers of butane ? (i)
02:45View SolutionDetermine the point of symmetry of a regular hexagon.
02:17View SolutionDtermine the images of the following figure about the given line :
05:41View SolutionMatch the following Column A to Column B
 02:21View Solution
Match the following Column A to Column B
 02:03View Solution
Match the following Column A to Column B
 02:10View Solution
Find the area of the figure given below.
 02:17View Solution
The area of the shaded part in the figure given below is ______.
 02:10View Solution
The inequation represented by the graph given below is :
04:23View SolutionThe inequation that best describes the graph given below is _________
01:13View SolutionThe inequation that best describes the following graph is _________
03:12View SolutionWhich inequations represent the shaded region in the given figure
05:46View Solution
