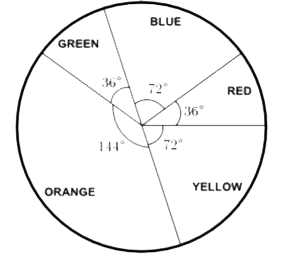
A survey was taken at a high school, and the results were put in a circle graph. The students were asked to list their favourite colours. The measurement of each central angle is shown. If a person is chosen at random from the school, find the probability of each response.
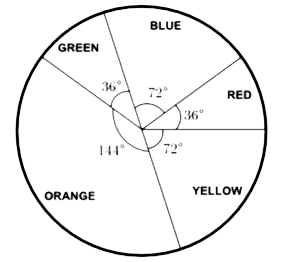
What is the probability of favourite colour being blue or green ?
0.1
0.2
0.3
0.4
The correct Answer is:C
P(blue of green) =72∘+36∘360∘=108∘360∘=310=0.3
Thus ( c ) is correct option.
Topper's Solved these Questions
Similar Questions
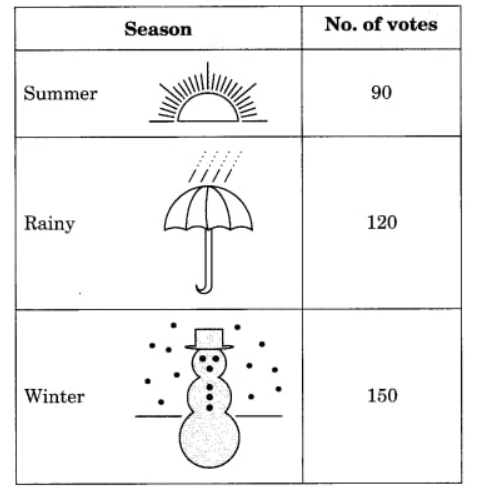
A group of 360 people were asked to vote for their favourite season from the three seasons rainy, winter and summer.
(i) Which season got the most votes?
(ii) Find the central angle of each sector.
(iii) Draw a pie chart to show this information.
 View Solution
Of the students in a school, it is known that 30% have 100% attendance and 70% students are irregular. Previous year results report that 70% of all students who have 100% attendance attain A grade and 10% irregular students attain A grade in their annual examination. At the end of the year, one student is chosen at random from the school and he was found to have an A grade. What is the probability that the student has 100% attendance ? Is regularity required only in school ? Justify your answer.
View Solution
Knowledge Check
- Question 1 - Select One
A survey was taken at a high school, and the results were put in a circle graph. The students were asked to list their favourite colours. The measurement of each central angle is shown. If a person is chosen at random from the school, find the probability of each response.
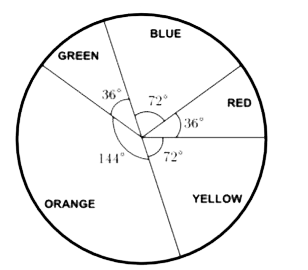
What is the probability of favourite colour being red or blue?A0.2B0.3C0.1D0.4 - Question 2 - Select One
A survey was taken at a high school, and the results were put in a circle graph. The students were asked to list their favourite colours. The measurement of each central angle is shown. If a person is chosen at random from the school, find the probability of each response.
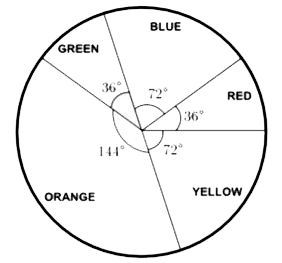
What is the probability of favourite colour being red ?A0.1B0.2C0.3D0.4 - Question 3 - Select One
A survey was taken at a high school, and the results were put in a circle graph. The students were asked to list their favourite colours. The measurement of each central angle is shown. If a person is chosen at random from the school, find the probability of each response.
What is the probability of favourite colour not being red or blue?A0.35B0.7C0.15D0.50
In City X, there were 900 residents. A survey was conducted in it reagrding the favourite beverages of the residents. The results of the survey are partially conveyed in the table below.
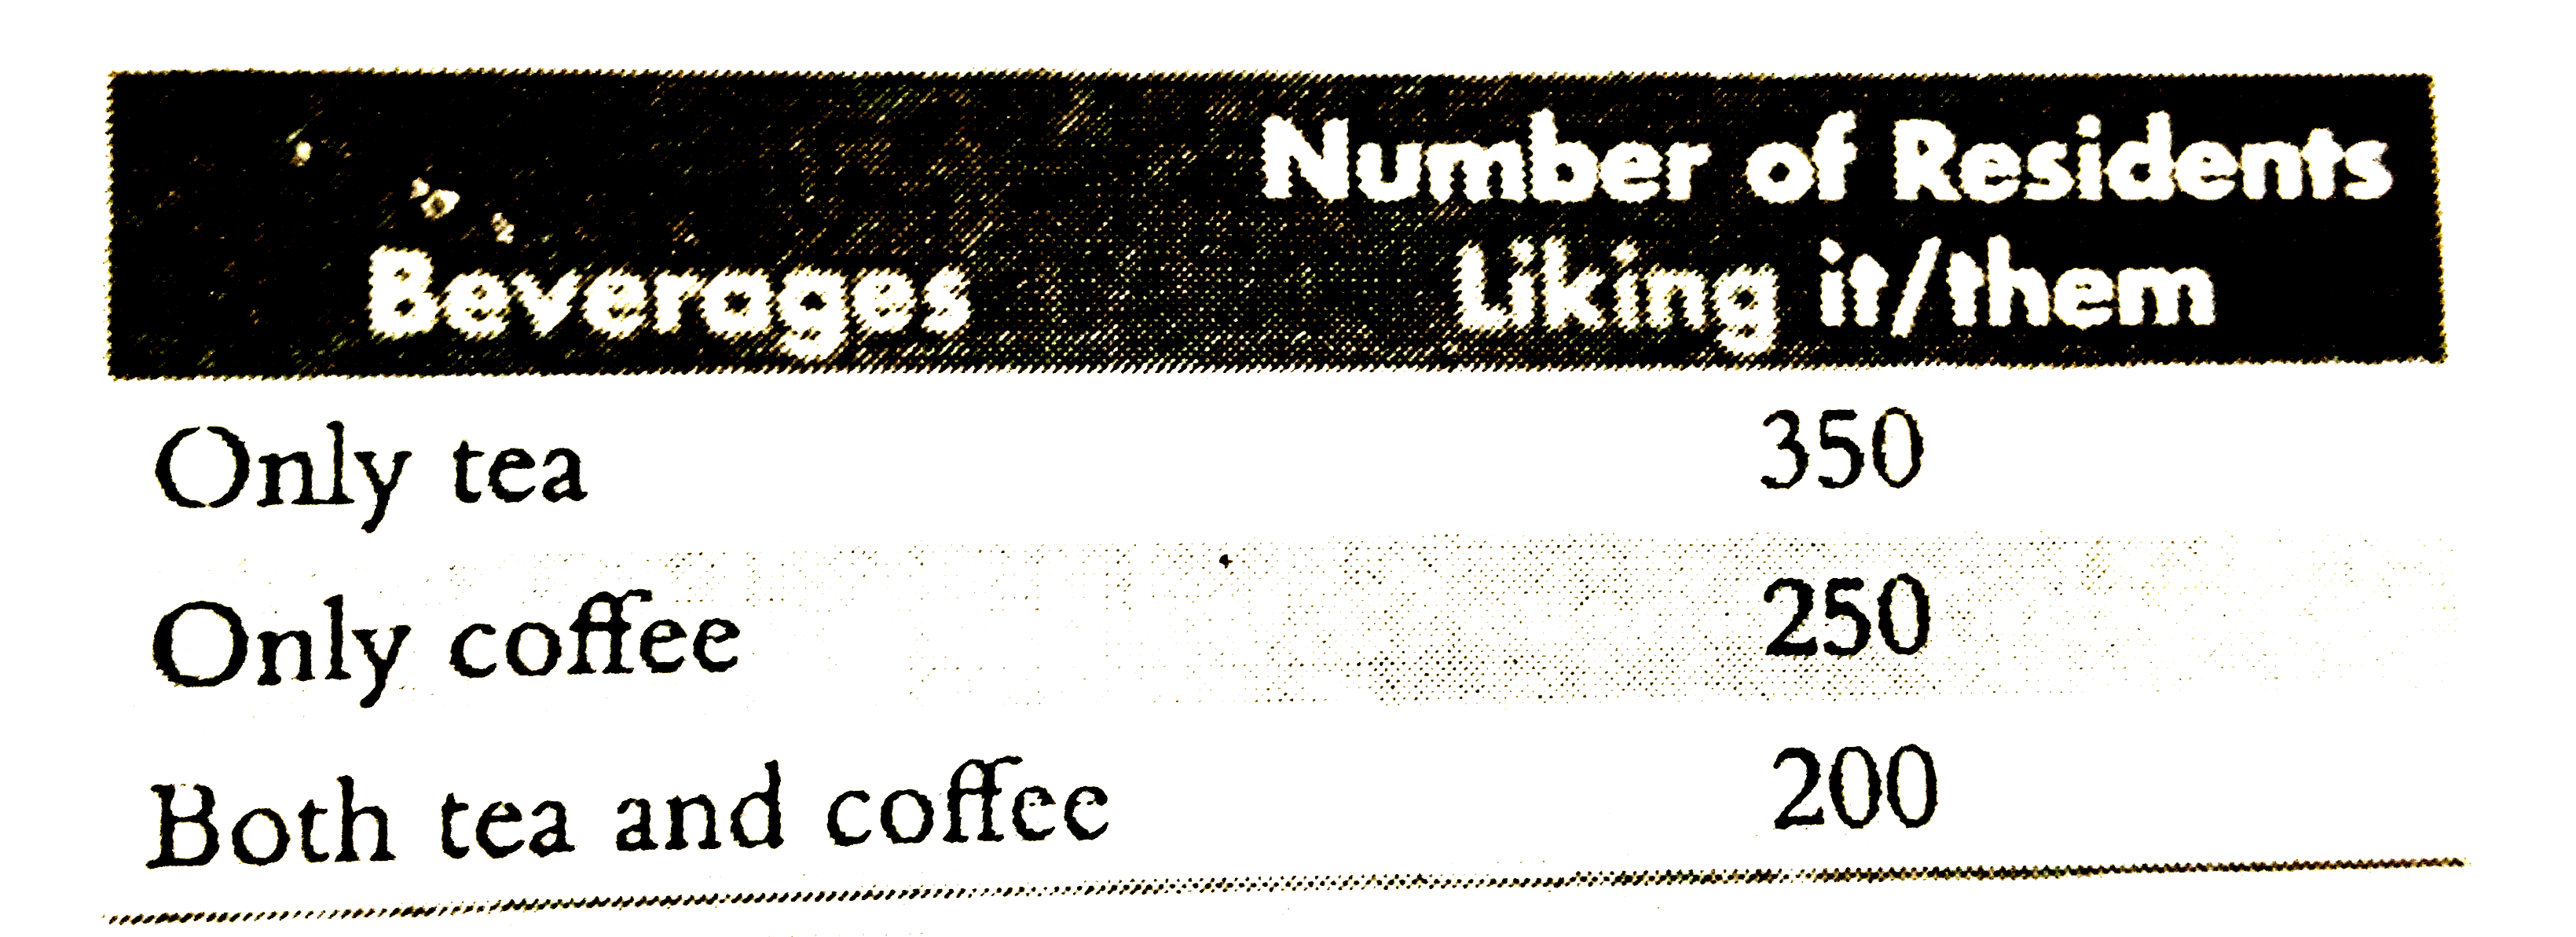
Find the probability that a resident chosen at random likes only tea or only coffee.View SolutionA box contains 6 red, 4 white and 5 black balls. A person draws 4 balls from the box at random. Find the probability that among the balls drawn there is atleast one ball of each colour.
View SolutionIn a bag there are 44 identical cards with figure of circle or square on them. There are 24 circles, of which 9 are blue and rest are green and 20 squares of which 11 are blue and rest are green. One card is drawn from the bag at random. Find the probability that it has the figure of (i) square (ii) green colour, (iii) blue circle and (iv) green square.
View SolutionA survey was taken at a high school, and the results were put in a circle graph. The students were asked to list their favourite colours. The measurement of each central angle is shown. If a person is chosen at random from the school, find the probability of each response.
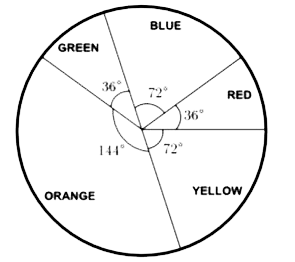
What is the probability of favourite colour not being orange or green ?View SolutionIn a sample survey of 645 people , it was found that 516 people have a high school certificate . If a person is chosen at random , what is the probability that he/she has a high school certificate ?
View Solution
