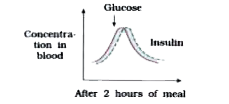
A graph shows change after a lunch of a healthy individual whose diet is rich in sweets.

What you explain from it ? Solution in Gujrati
When the sugar level rises in blood, pancreas releases more insulin to regulate blood sugar level. As blood sugar level falls, insulin secretion is reduced by feedback mechanism.
Topper's Solved these Questions
- CONTROL AND COORDINATIONBook:KUMAR PRAKASHANChapter:CONTROL AND COORDINATIONExercise:OBJECTIVE QUESTIONS AND ANSWERS(Chart-diagram based questions: )
Explore 1 Video
- CONTROL AND COORDINATIONBook:KUMAR PRAKASHANChapter:CONTROL AND COORDINATIONExercise:OBJECTIVE QUESTIONS AND ANSWERS (Select the correct alternative from those given below each question : )
Explore 31 Videos
- CONTROL AND COORDINATIONBook:KUMAR PRAKASHANChapter:CONTROL AND COORDINATIONExercise:OBJECTIVE QUESTIONS AND ANSWERS (State whether the following statements are true or false: )
Explore 12 Videos
- HEREDITY AND EVOLUTIONBook:KUMAR PRAKASHANChapter:HEREDITY AND EVOLUTIONExercise:PRACTICAL SKILL BASED QUESTIONS WITH ANSWERS
Explore 5 Videos
Similar Questions
Which of the following diagram is correct ? Why?

View SolutionThe roots of a plant are A) positive phototropic, but negative geotropic B) negative geotropic, but negative phototropic C) negative phototropic, but positive hydrotropic D) negative hydrotropic, but positive phototropic
View SolutionState True or False. Many involuntary actions are controlled by the mid-brain and hind-brain.
View SolutionYou are supplied with two sets of seeds of pea plants. One set is yellow and round seeds with gene constitution YYRR and other set is green and round seeds with gene constitution yyRR. From both sets of seeds plants are cultivated. Pea plant is self-pollinated but arrange artificial cross between two given plants cultivated from seeds. Which offsprings do you expect ? show with chart.
View SolutionContamination, vaccination, immunization, healthy diet.
View SolutionRivet popper hypothesis' to explain the role of species richness for ecosystem healthy was given by
View Solutionএকটি খাদ্যতন্তু-সমৃদ্ধ খাদ্য হল --
View Solutionতন্তুসমৃদ্ধ খাদ্য খেলে কী কী রোগ হওয়ার সম্ভাবনা কমে যায়?
View Solutionनिम्नलिखित कथन को सप्रतिबंध कथनों के रूप में पुनः लिखिए:
रात्रि-भोज के उपरांत आपको स्वीट डिश मिलेगी।
View SolutionRich source of PUFAs in diet is
View SolutionTo keep the body healthy, what are the diet related things?
View SolutionProtein rich diet not cause much change in constituent of which substance in urine
View SolutionRivet popper hypothesis' to explain the role of species richness for ecosystem healthy was given by
View SolutionRich source of PUFAs in diet is
View SolutionThe graph showing the progress of the reaction N_2+3H_2harr2NH_3 , is given Is there any change in the concentration, as time passes after attaining the stage A? Explain.
View Solution

