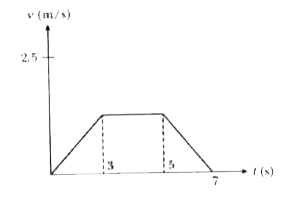
The velocity time graph of the motion of a car is given here.
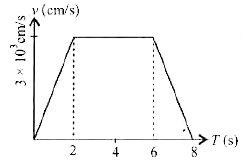
The distance travelled by the car in the first six seconds is 150 m.
The deceleration of the car during the last two seconds are −15ms2.
The distance travelled by the car in the first six second is 220 m.
The deceleration of the car during the last two second is −20ms2
The correct Answer is:A, B
The area enclosed between v-f curve give the distance travelled by the body.
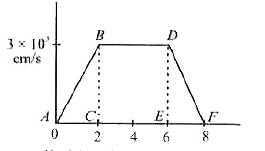
∴ tance travelled by the car in the first six seconds = Arca of triangle ABC + Area of rectangle BDEC
−12×2×3×103+(6−2)×3×103
=3×10³+12×103=15×103cm=150m .
From straight line equation ,
ν=u+at⇒0=3×10³+a×2
a=−3×1032=−1.5×103cm/s2=−15m/s2
Topper's Solved these Questions
- KINEMATICS Book:MTG-WBJEEChapter:KINEMATICS Exercise:WB JEE Previous Years Questions (CATEGORY 1 : Single Option Correct Type (1 Mark) )
Explore 9 Videos
- KINEMATICS Book:MTG-WBJEEChapter:KINEMATICS Exercise:WB JEE Previous Years Questions (CATEGORY 3 : One or More than One Option Correct Type (2 Marks) )
Explore 1 Video
- KINEMATICS Book:MTG-WBJEEChapter:KINEMATICS Exercise:WB JEE WORKOUT ( CATEGORY 2 : Single Option Correct Type (2 Marks))
Explore 15 Videos
- HEAT AND THERMAL PHYSICSBook:MTG-WBJEEChapter:HEAT AND THERMAL PHYSICSExercise:WB JEE PREVIOUS YEARS QUESTIONS
Explore 15 Videos
- KINETIC THEORY OF GASES Book:MTG-WBJEEChapter:KINETIC THEORY OF GASES Exercise:WB JEE PREVIOUS YEARS QUESTIONS (MCQ)
Explore 7 Videos
Similar Questions
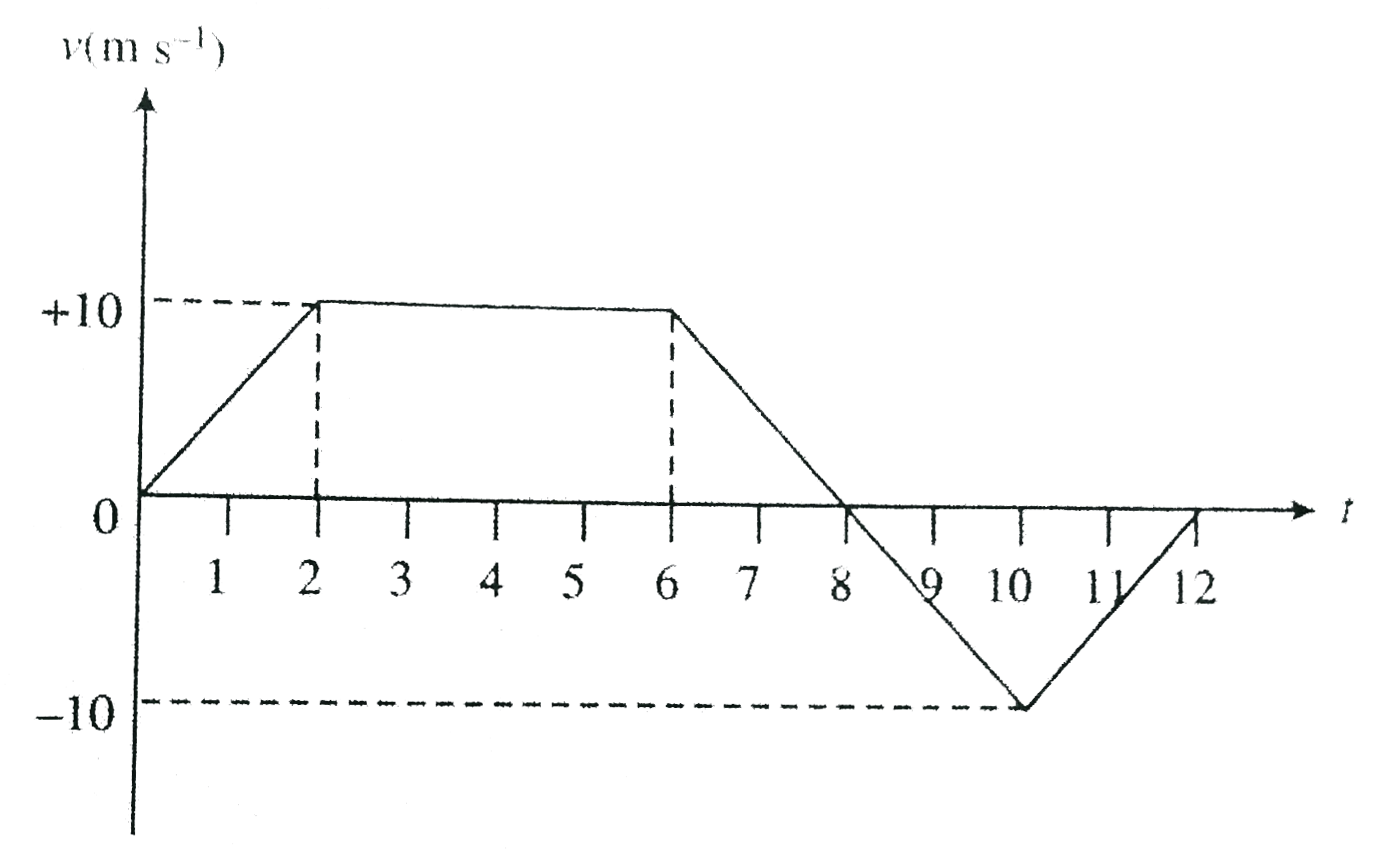
The velocity-time graph of a bosy moving along a straight line is given bellow dind:
Average velocity in whole time of motion
(b) Average speed in whole time of motion
(c ) Draw acceleration vs time graph.
 .
.
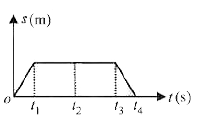
View SolutionThe displacement time graph of a body is shown in figure. The velocity-time graph of the motion of the body will be
View Solution
Knowledge Check
The displacement-time graph of a body is shown in.
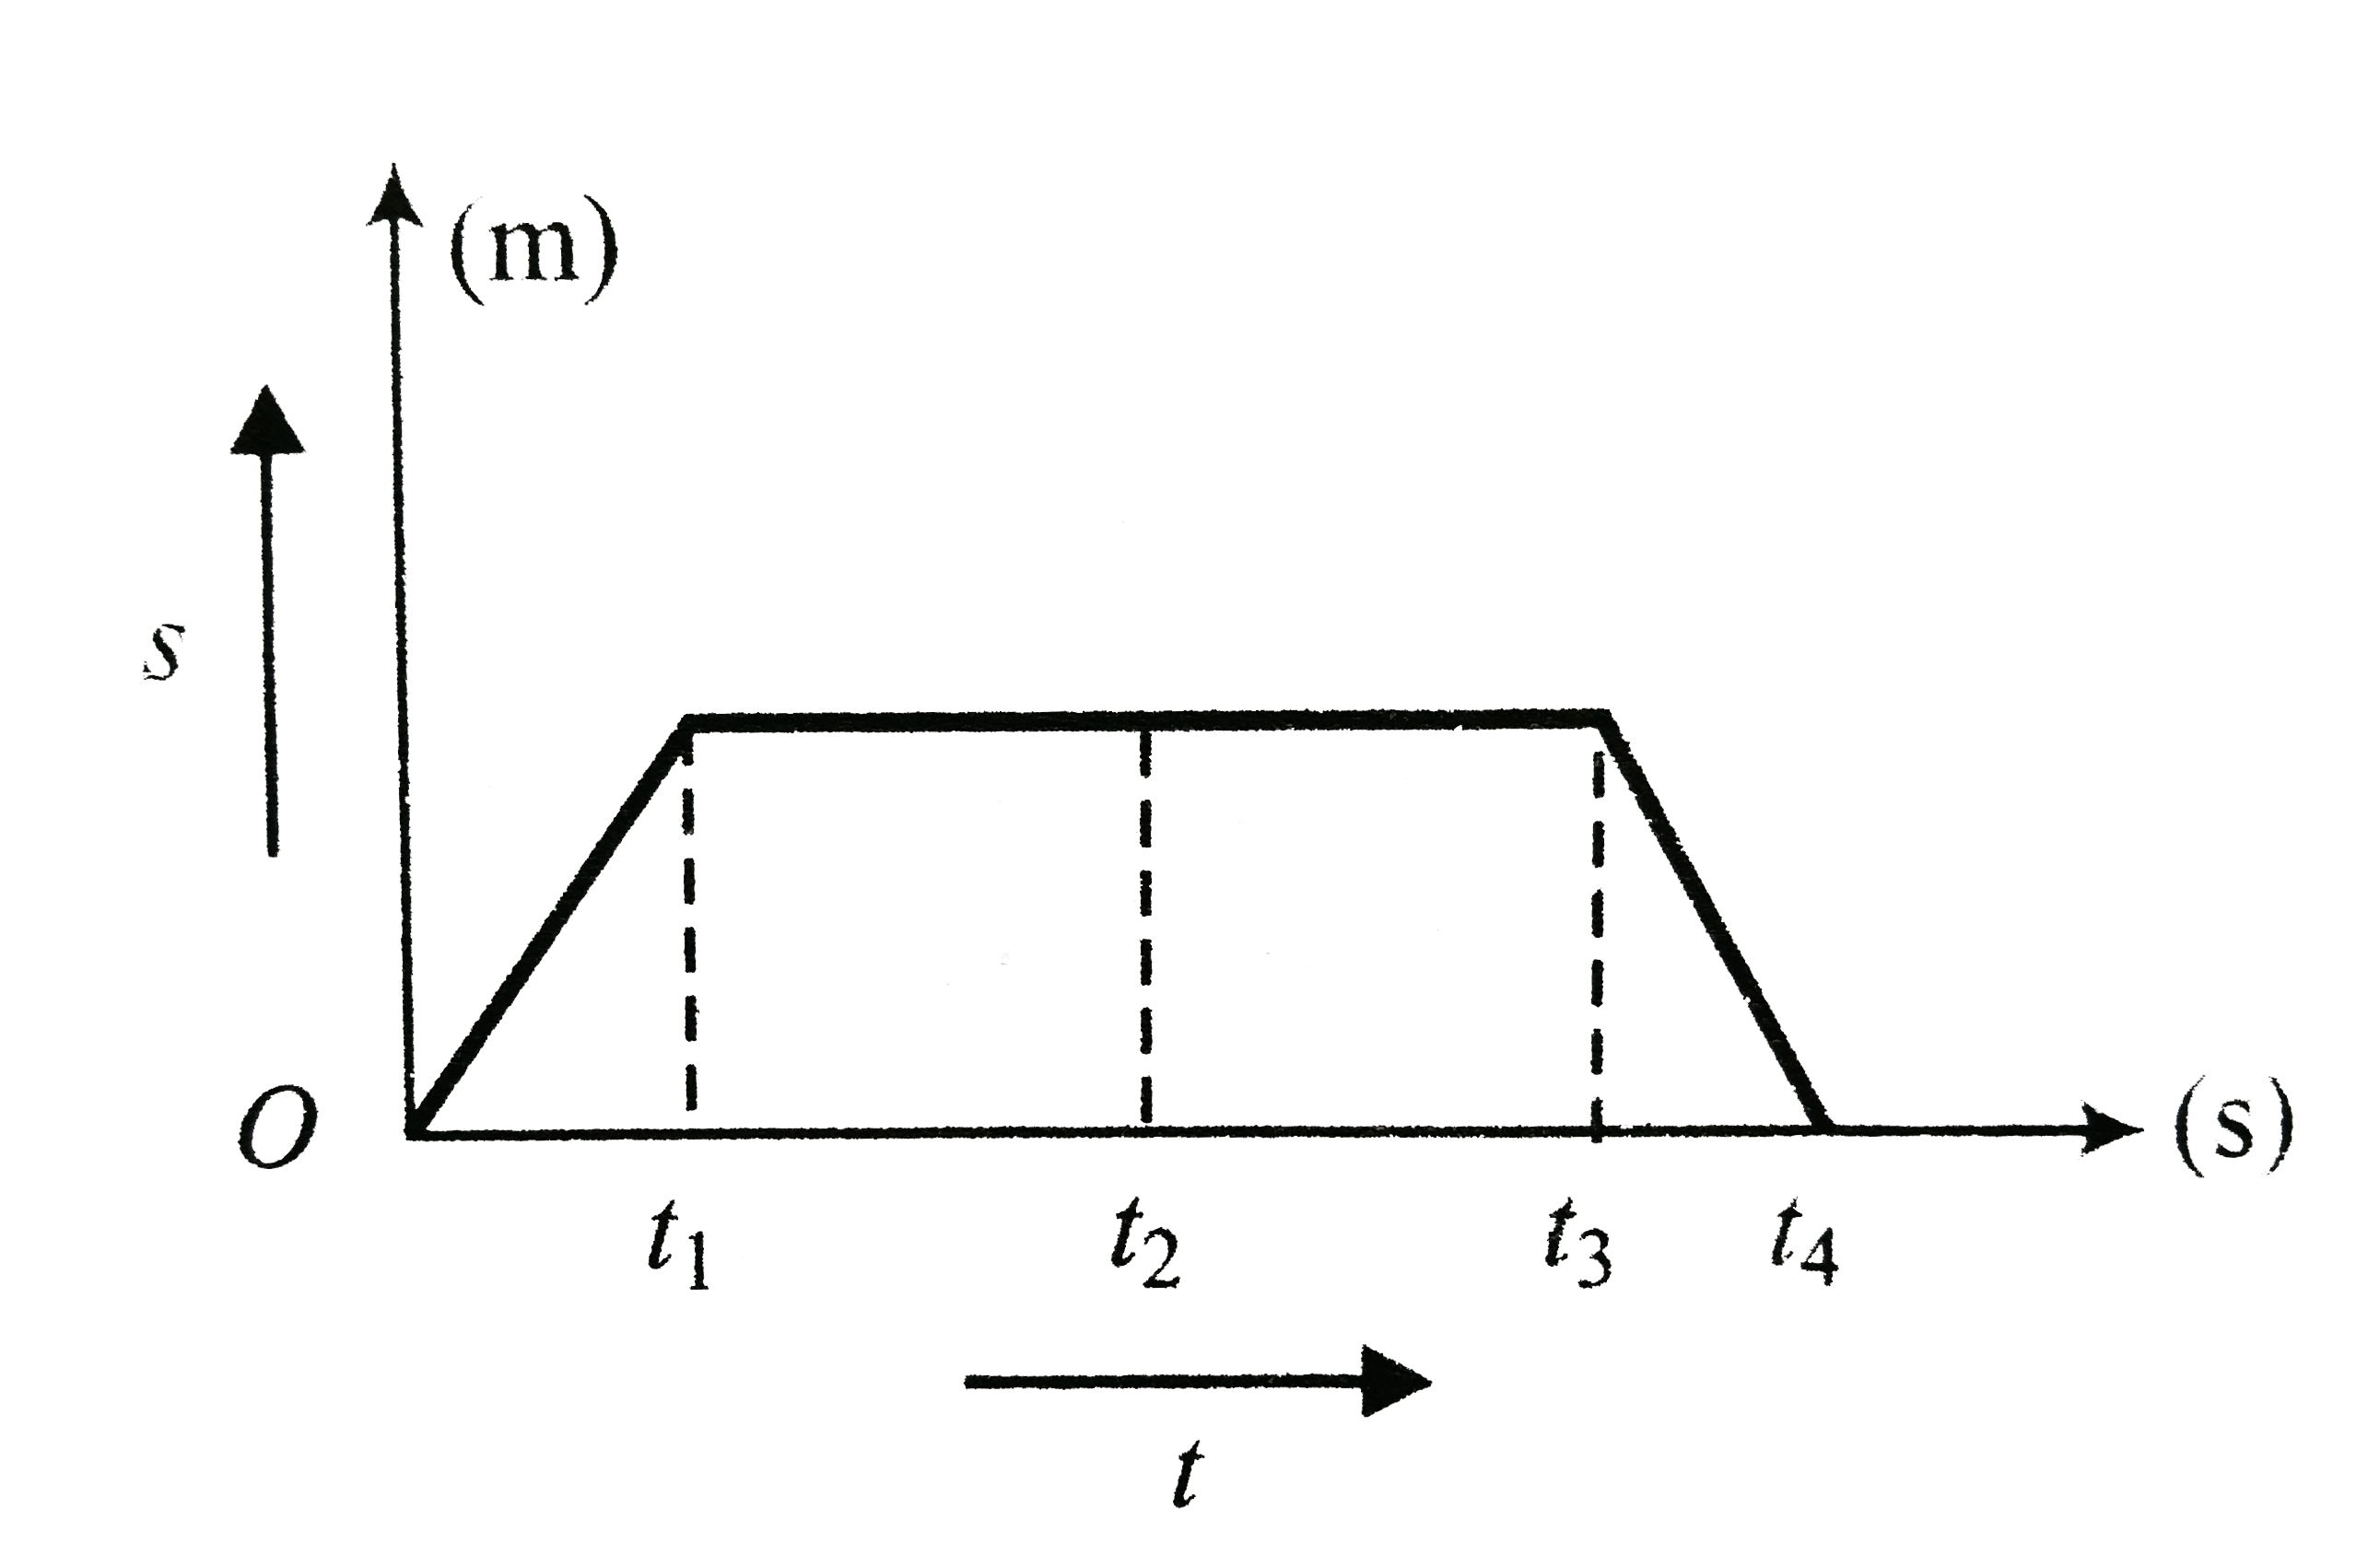 .
.
The velocity-time graph of the motion of the body will be .A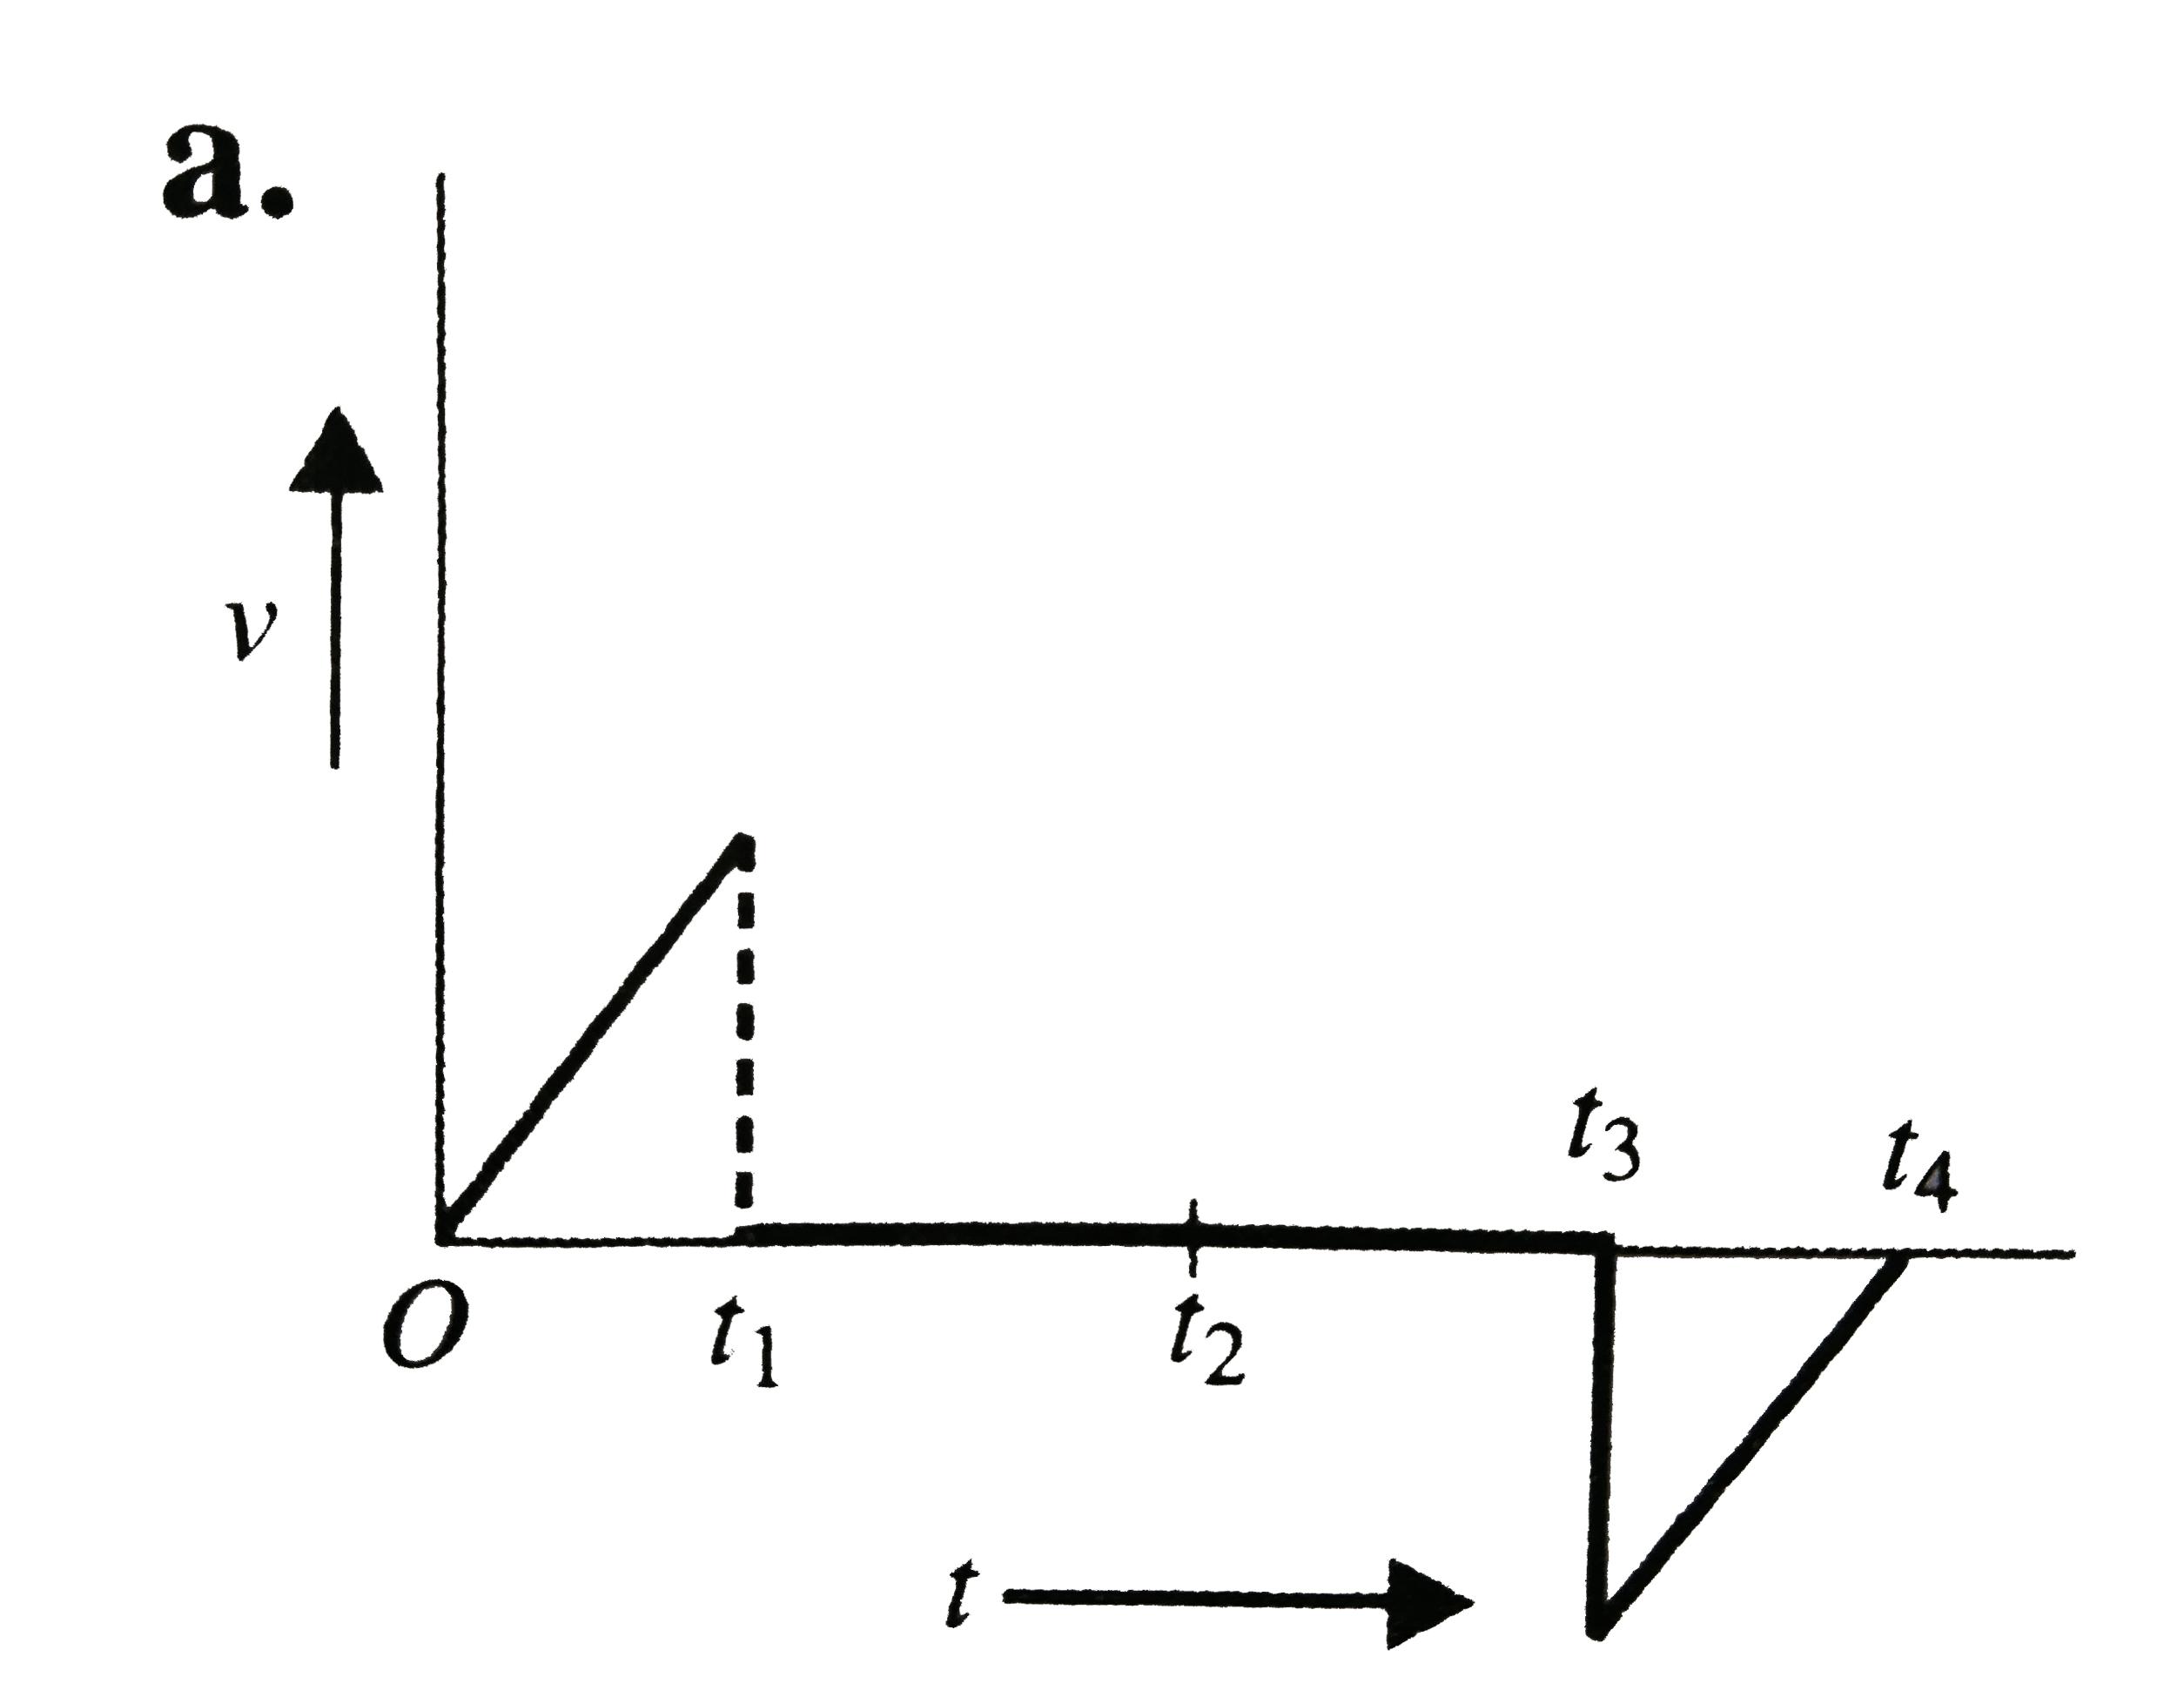 .B
.B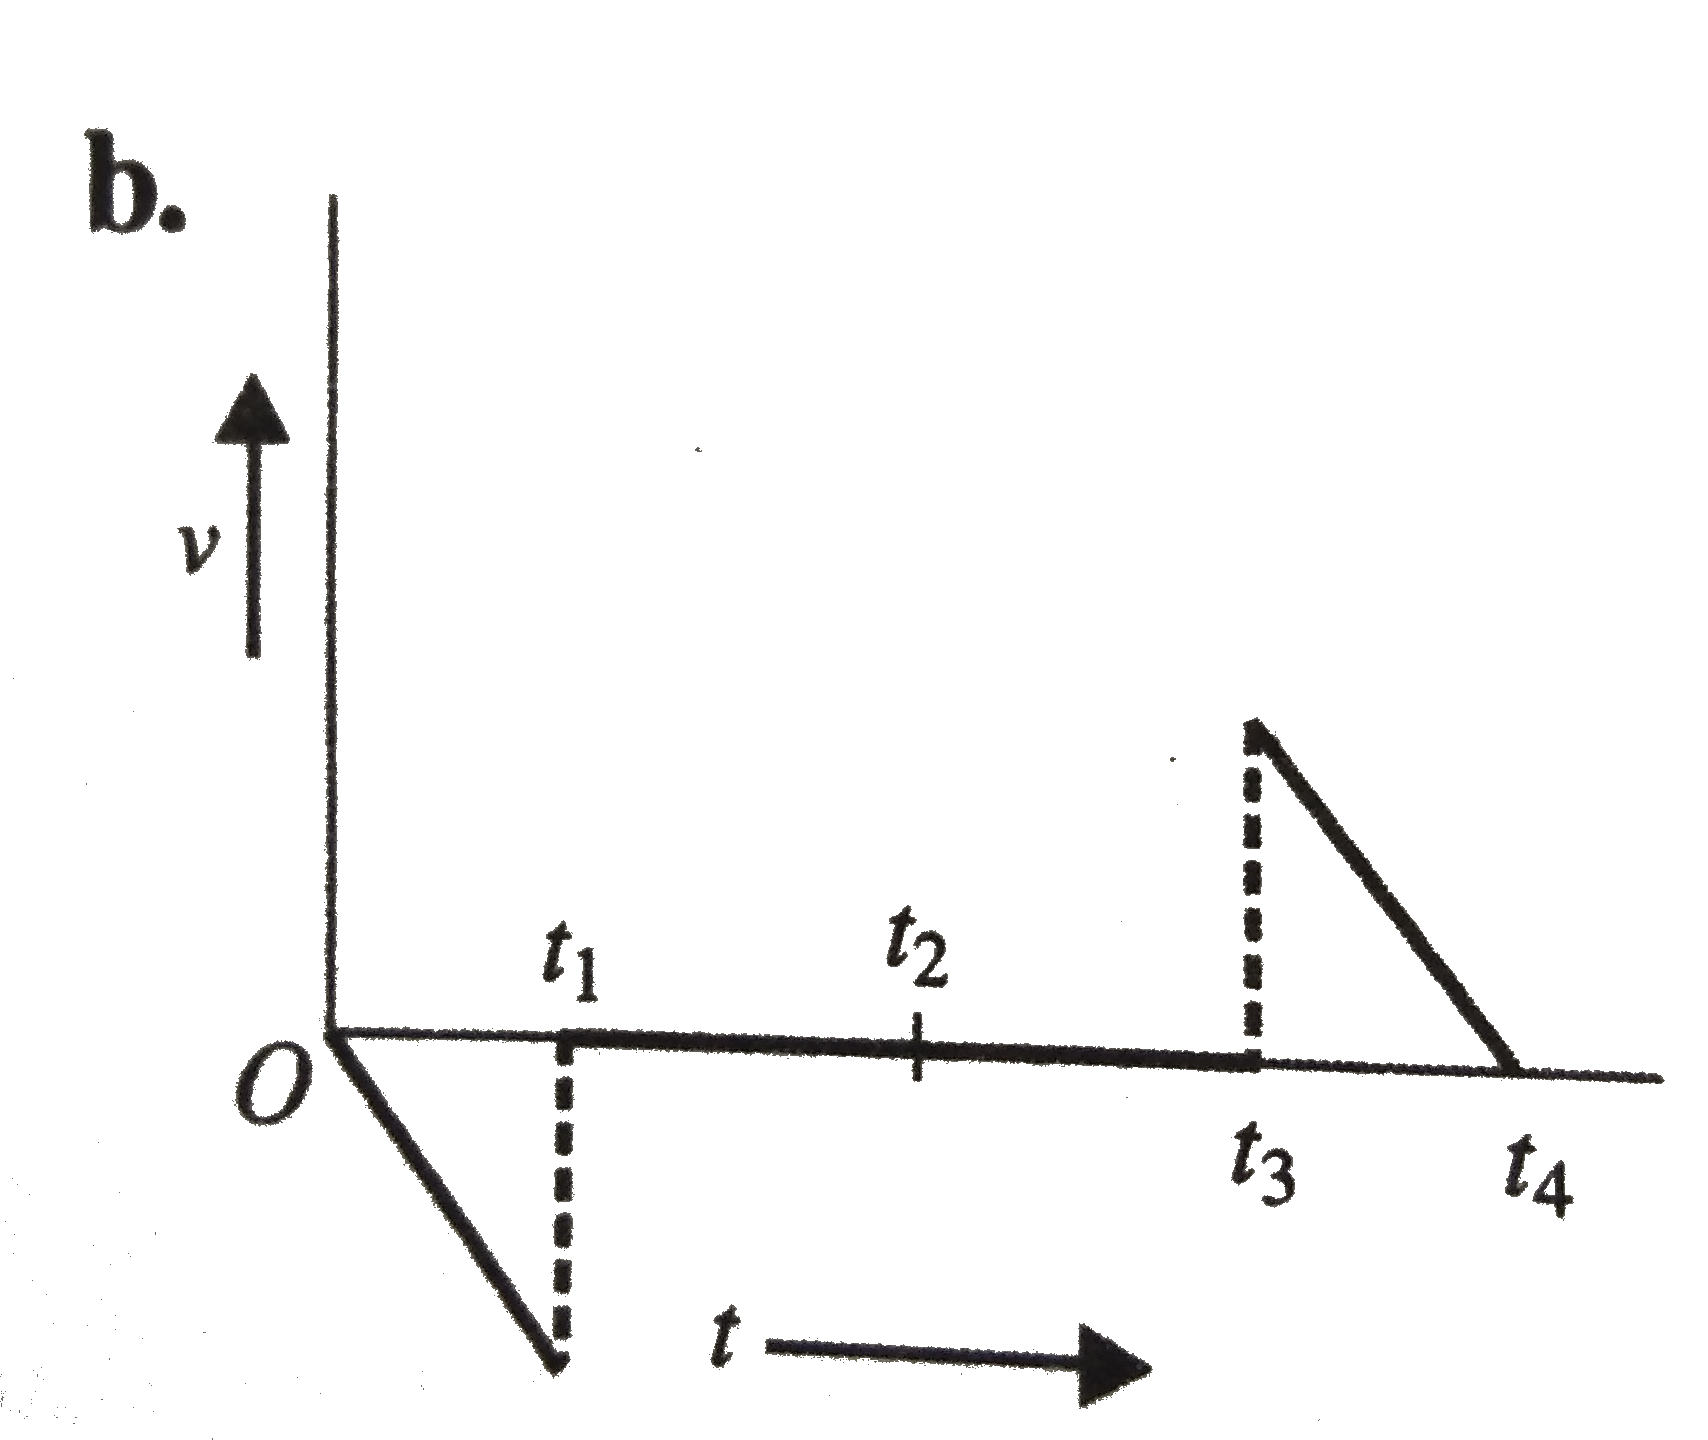 .C
.C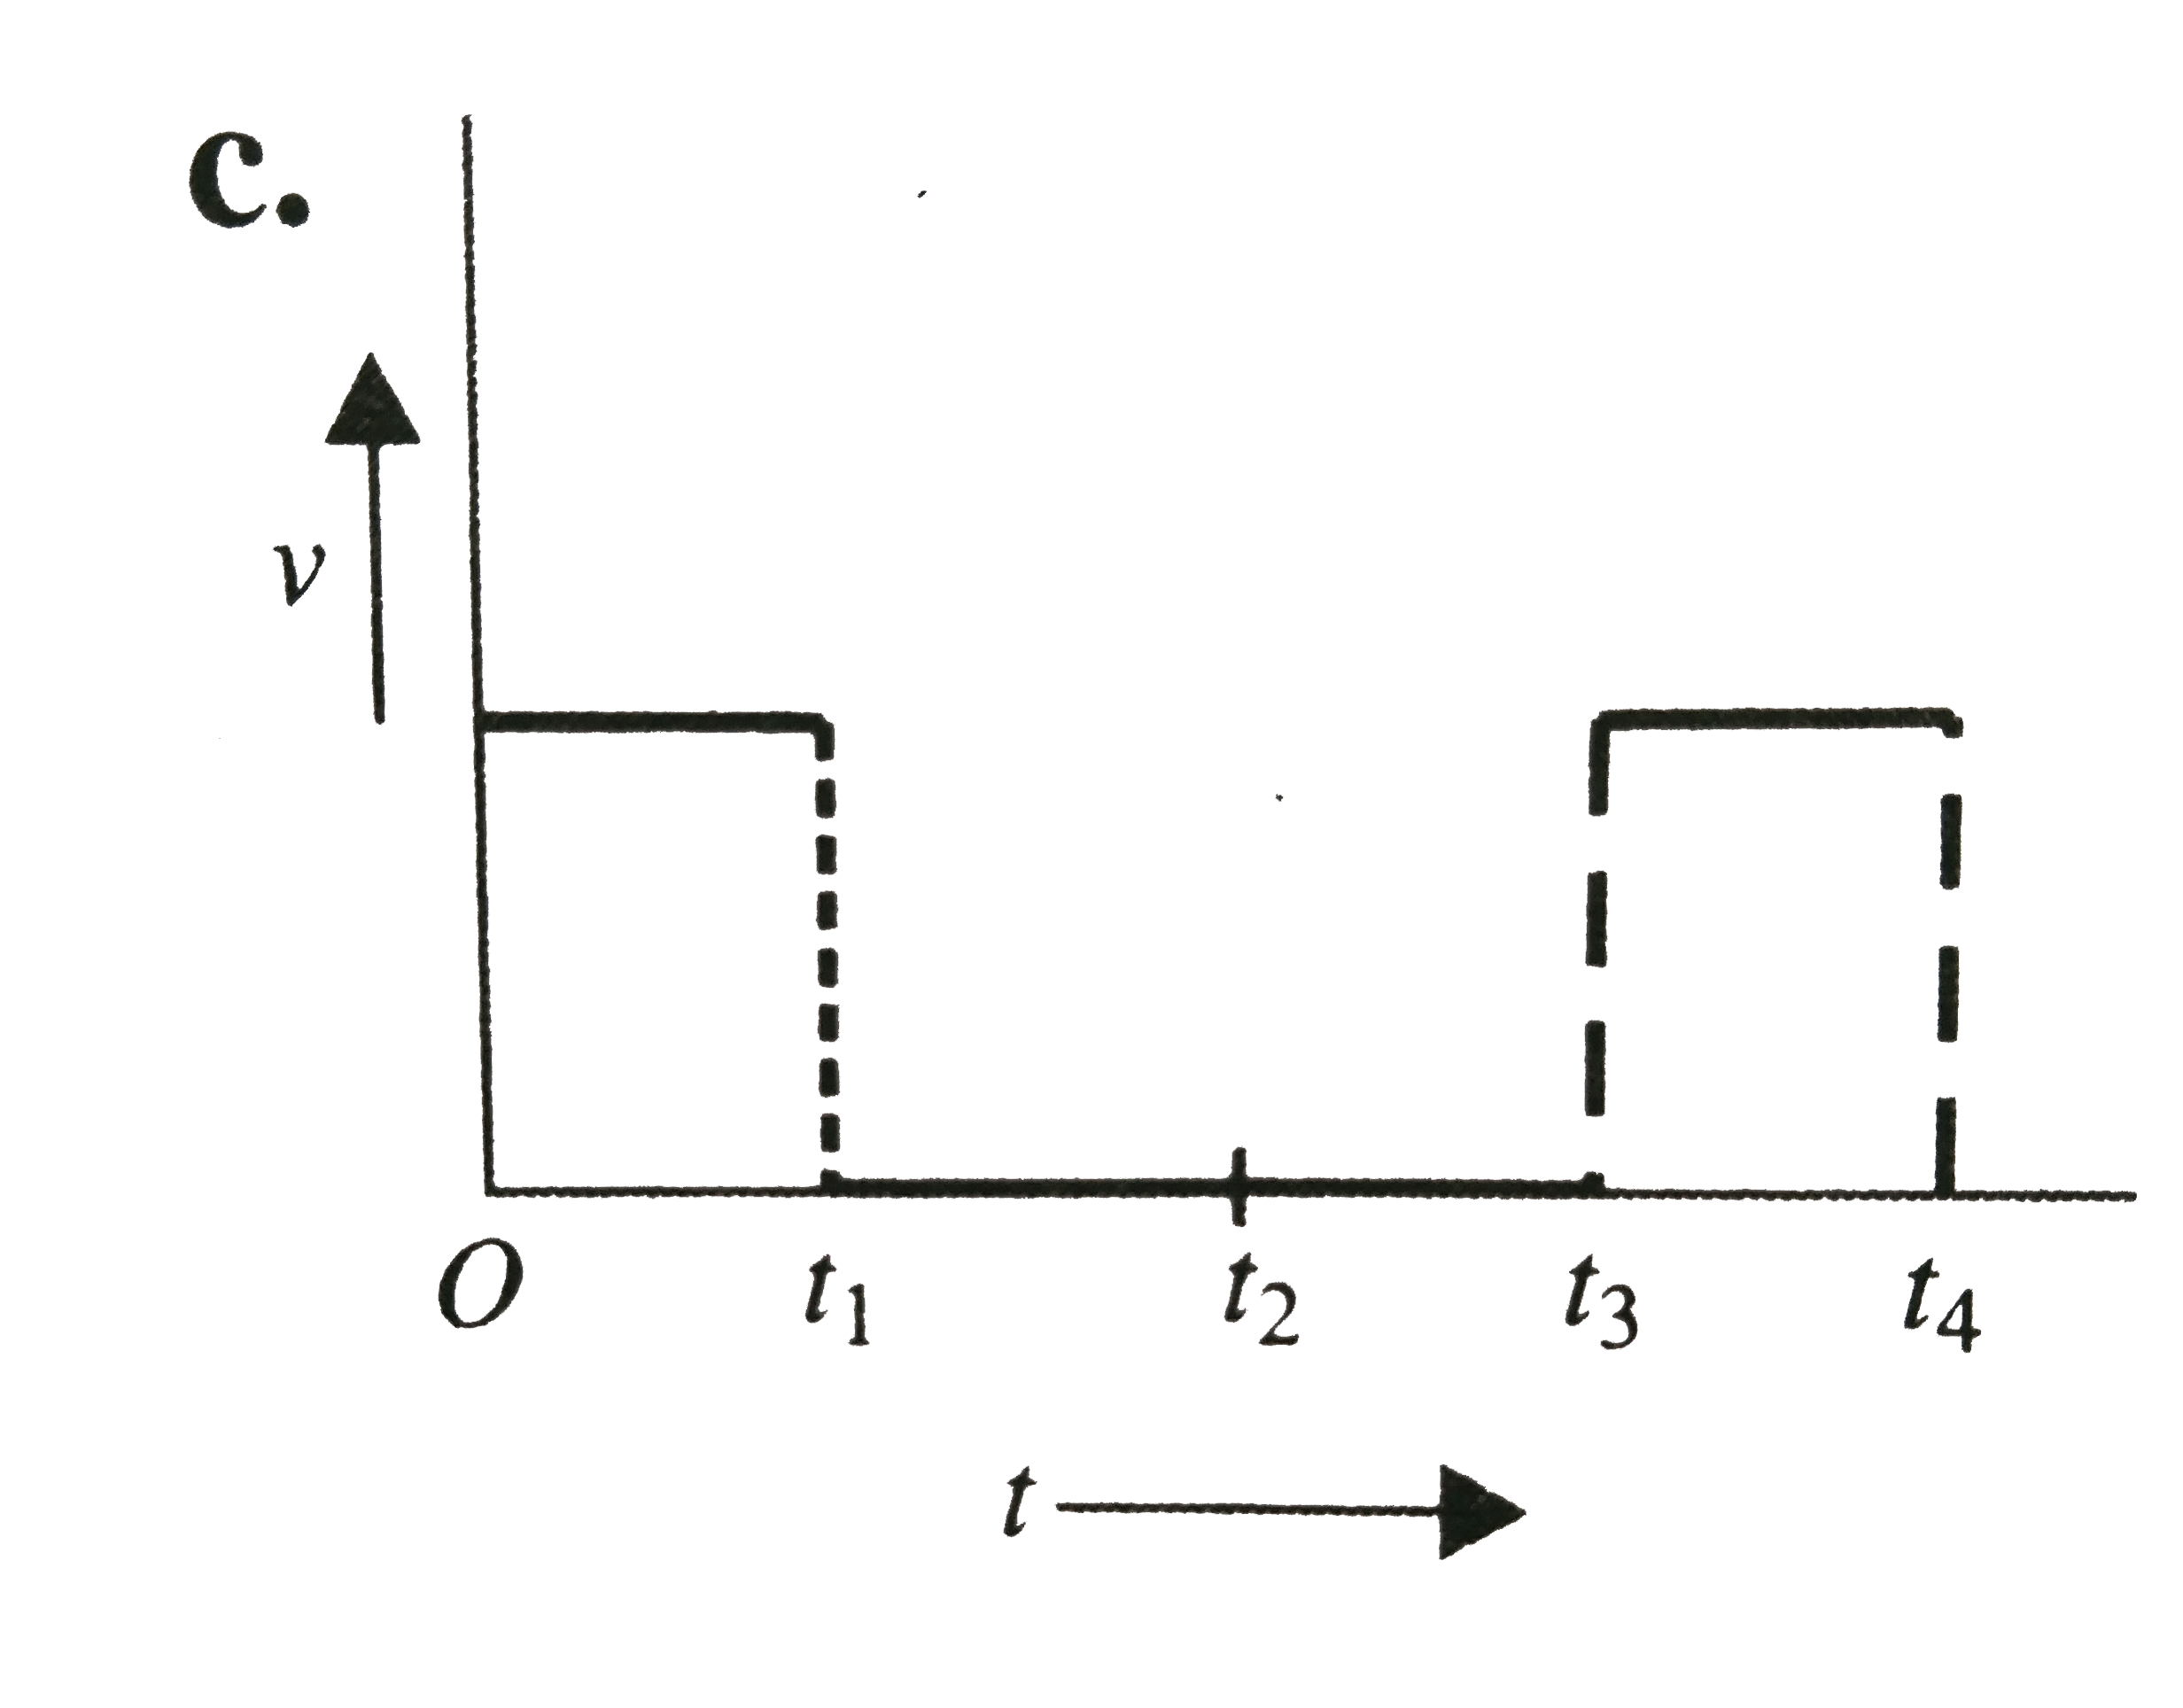 .D
.D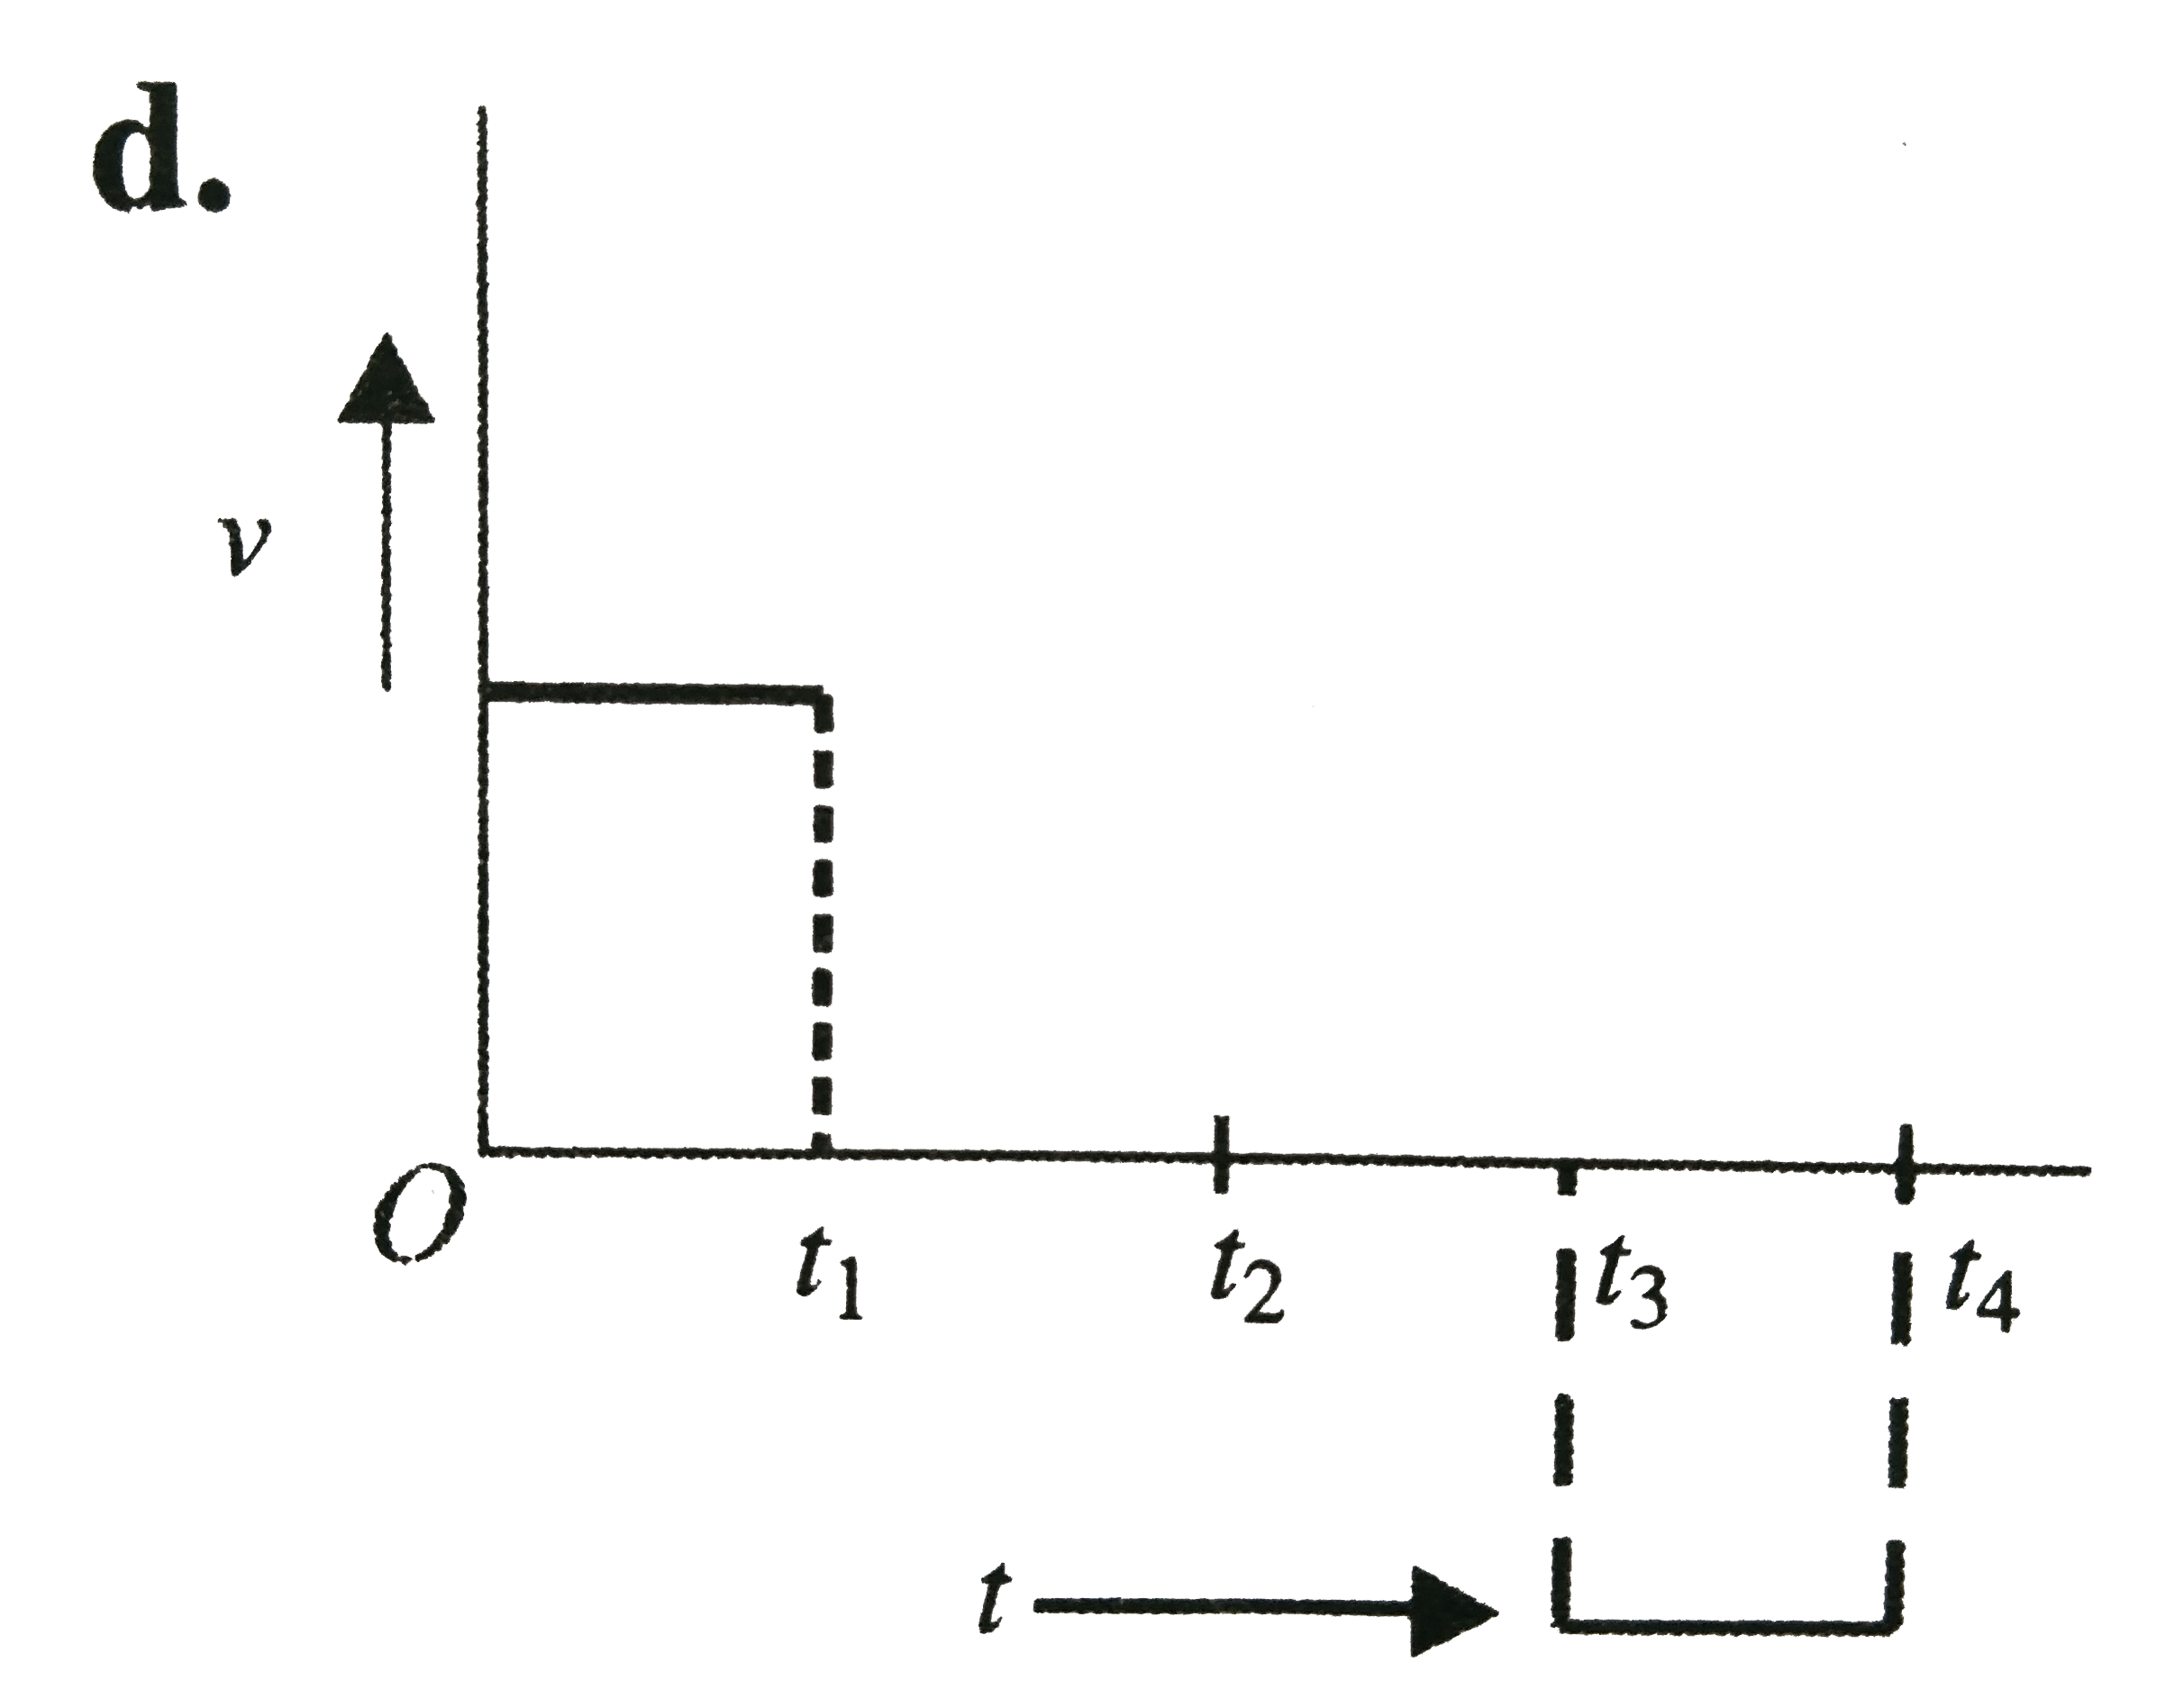 .
.The velocity- time graph of car moving on a straight track is given below. The car weight 1000kg.
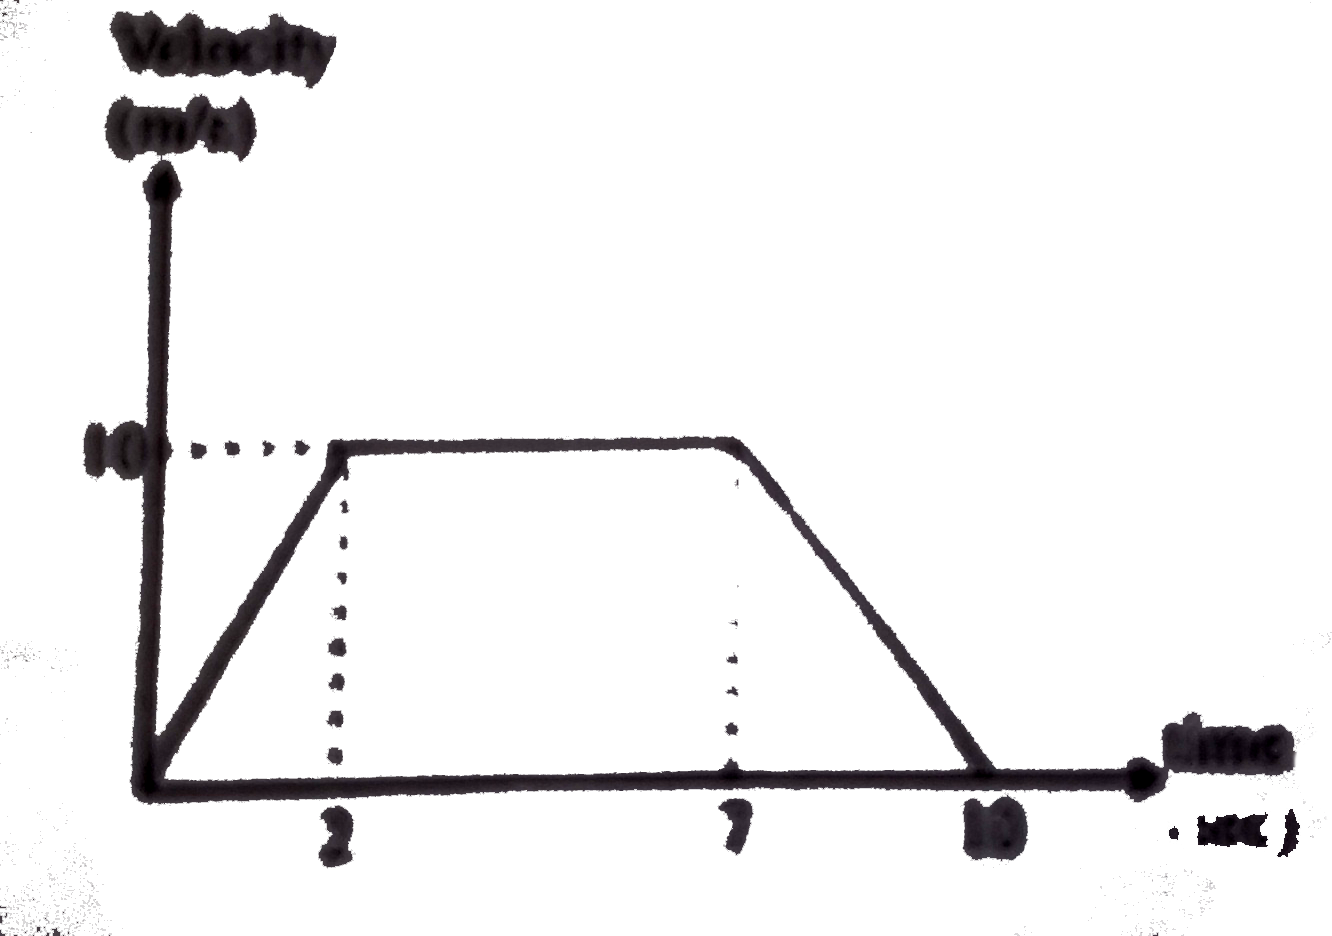 correct acceleration-time graph representing the motion of car is:A
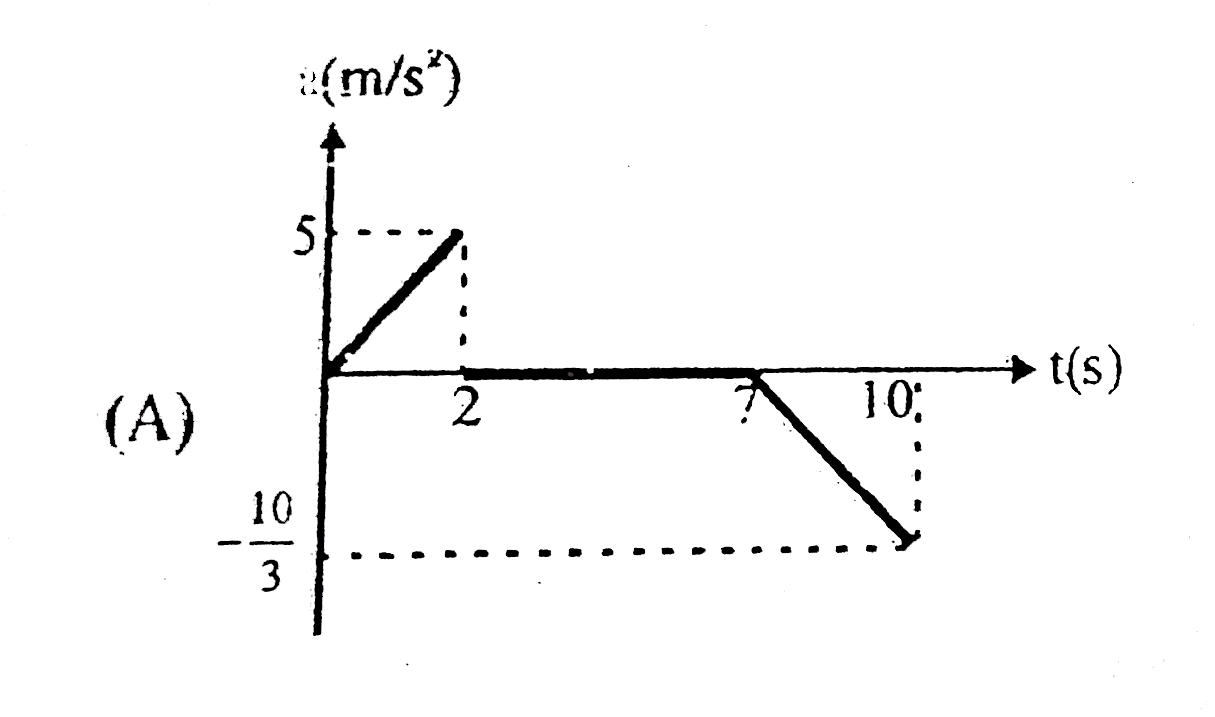 B
B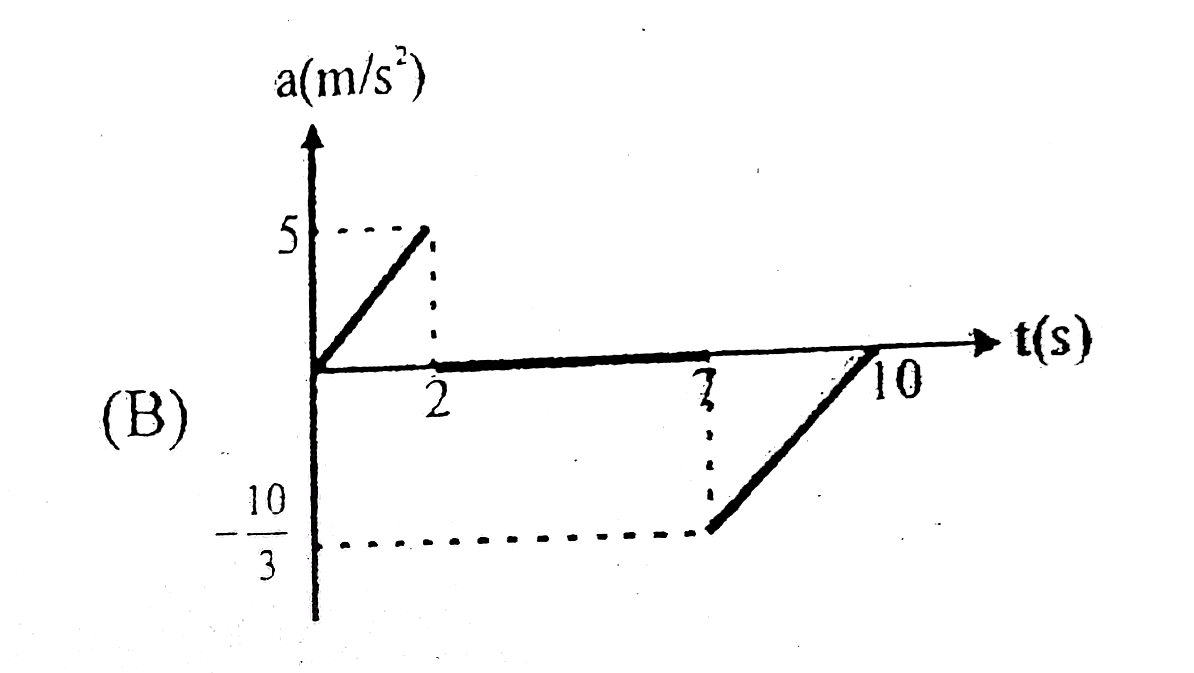 C
C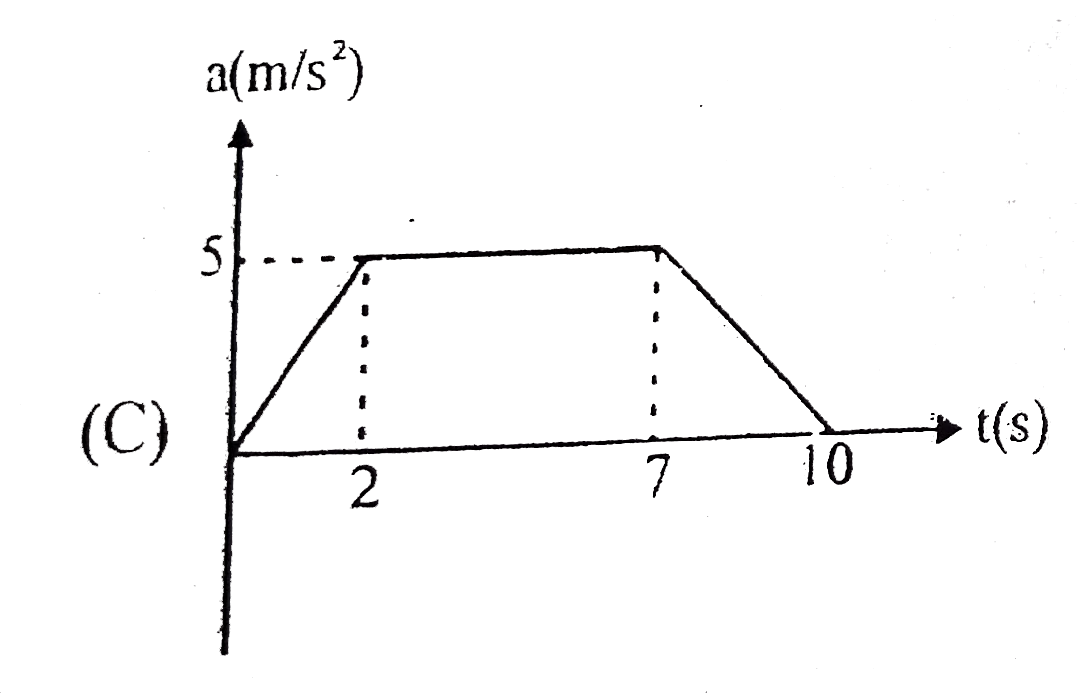 D
D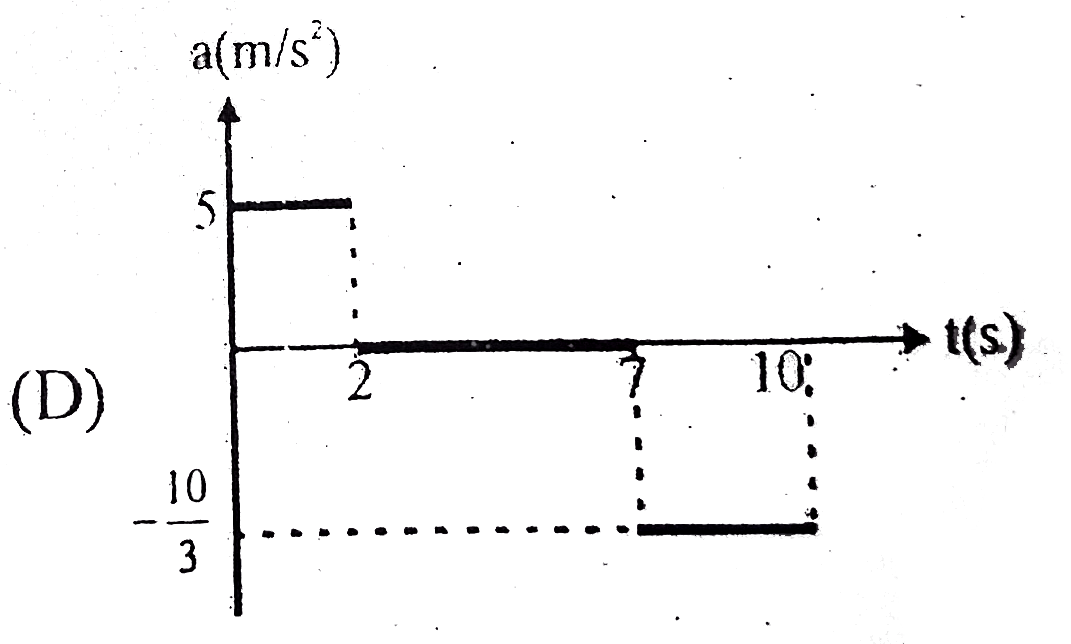
The velocity- time graph of car moving on a straight track is given below. The car weight 1000kg.
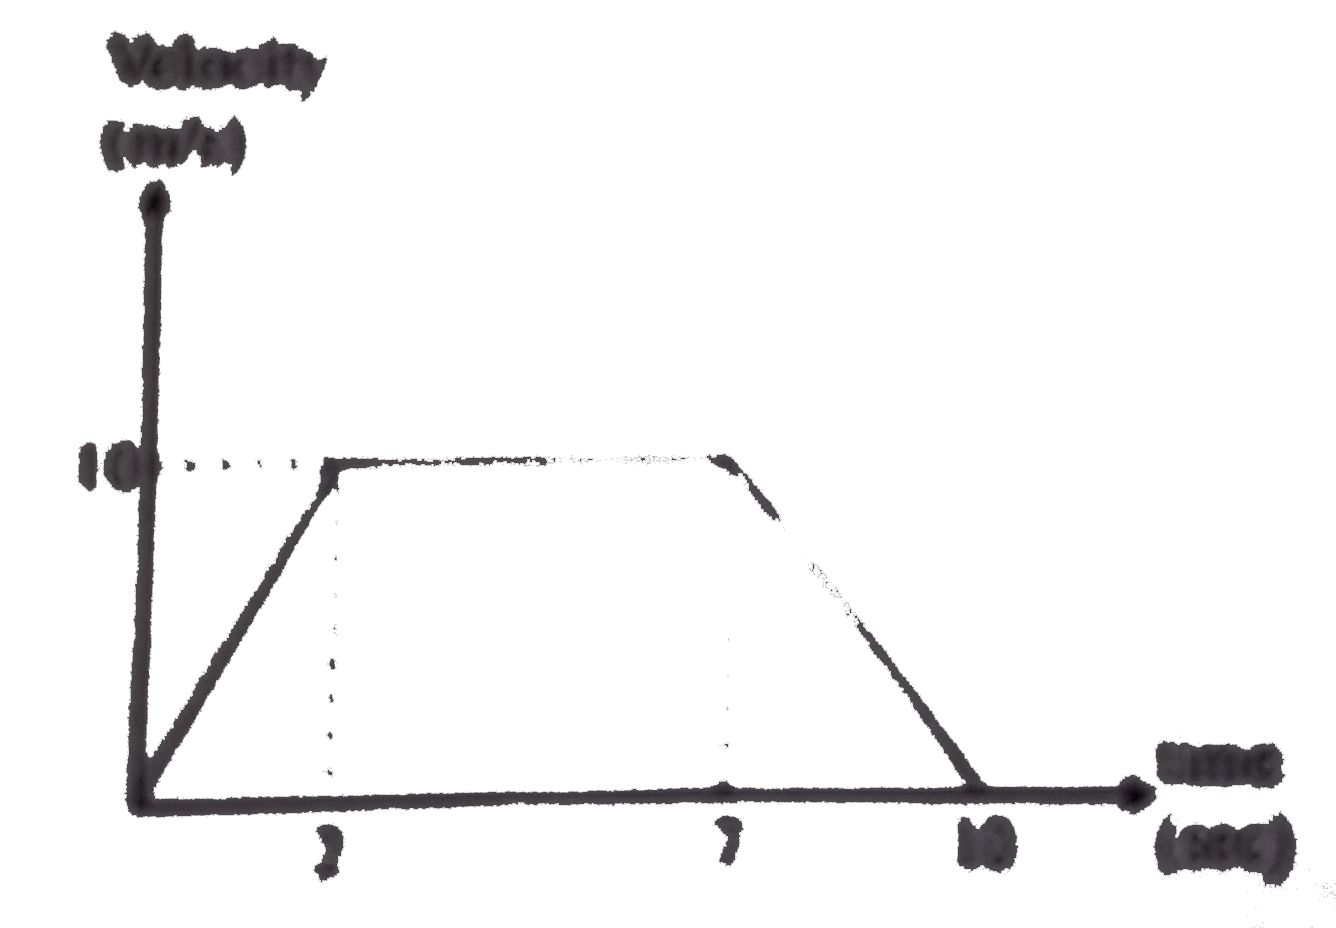 The distance travelled by the car during the whole motion is:A50mB75mC100mD150m
The velocity- time graph of car moving on a straight track is given below. The car weight 1000kg.
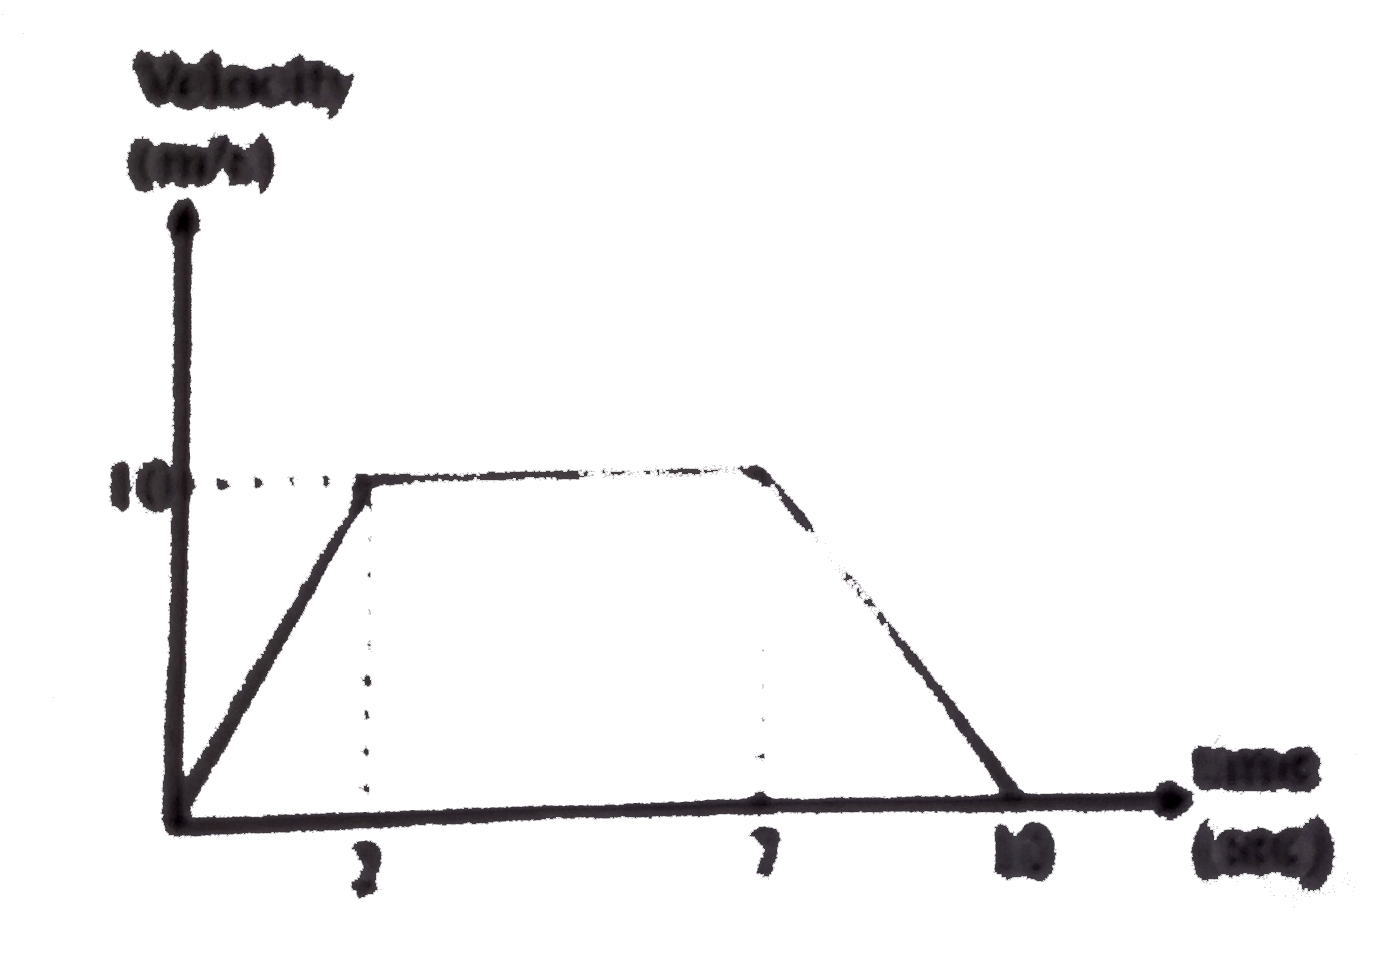 The braking force rewquired to boring the car to a stop with in one second from the maximum speed is:
View SolutionThe velocity - time graph of a body is given in figure below .
The acceleration-time graph of the motion of the body is
View SolutionVelocity time graph for the motion of a particle along a straight line is as shown in figure.
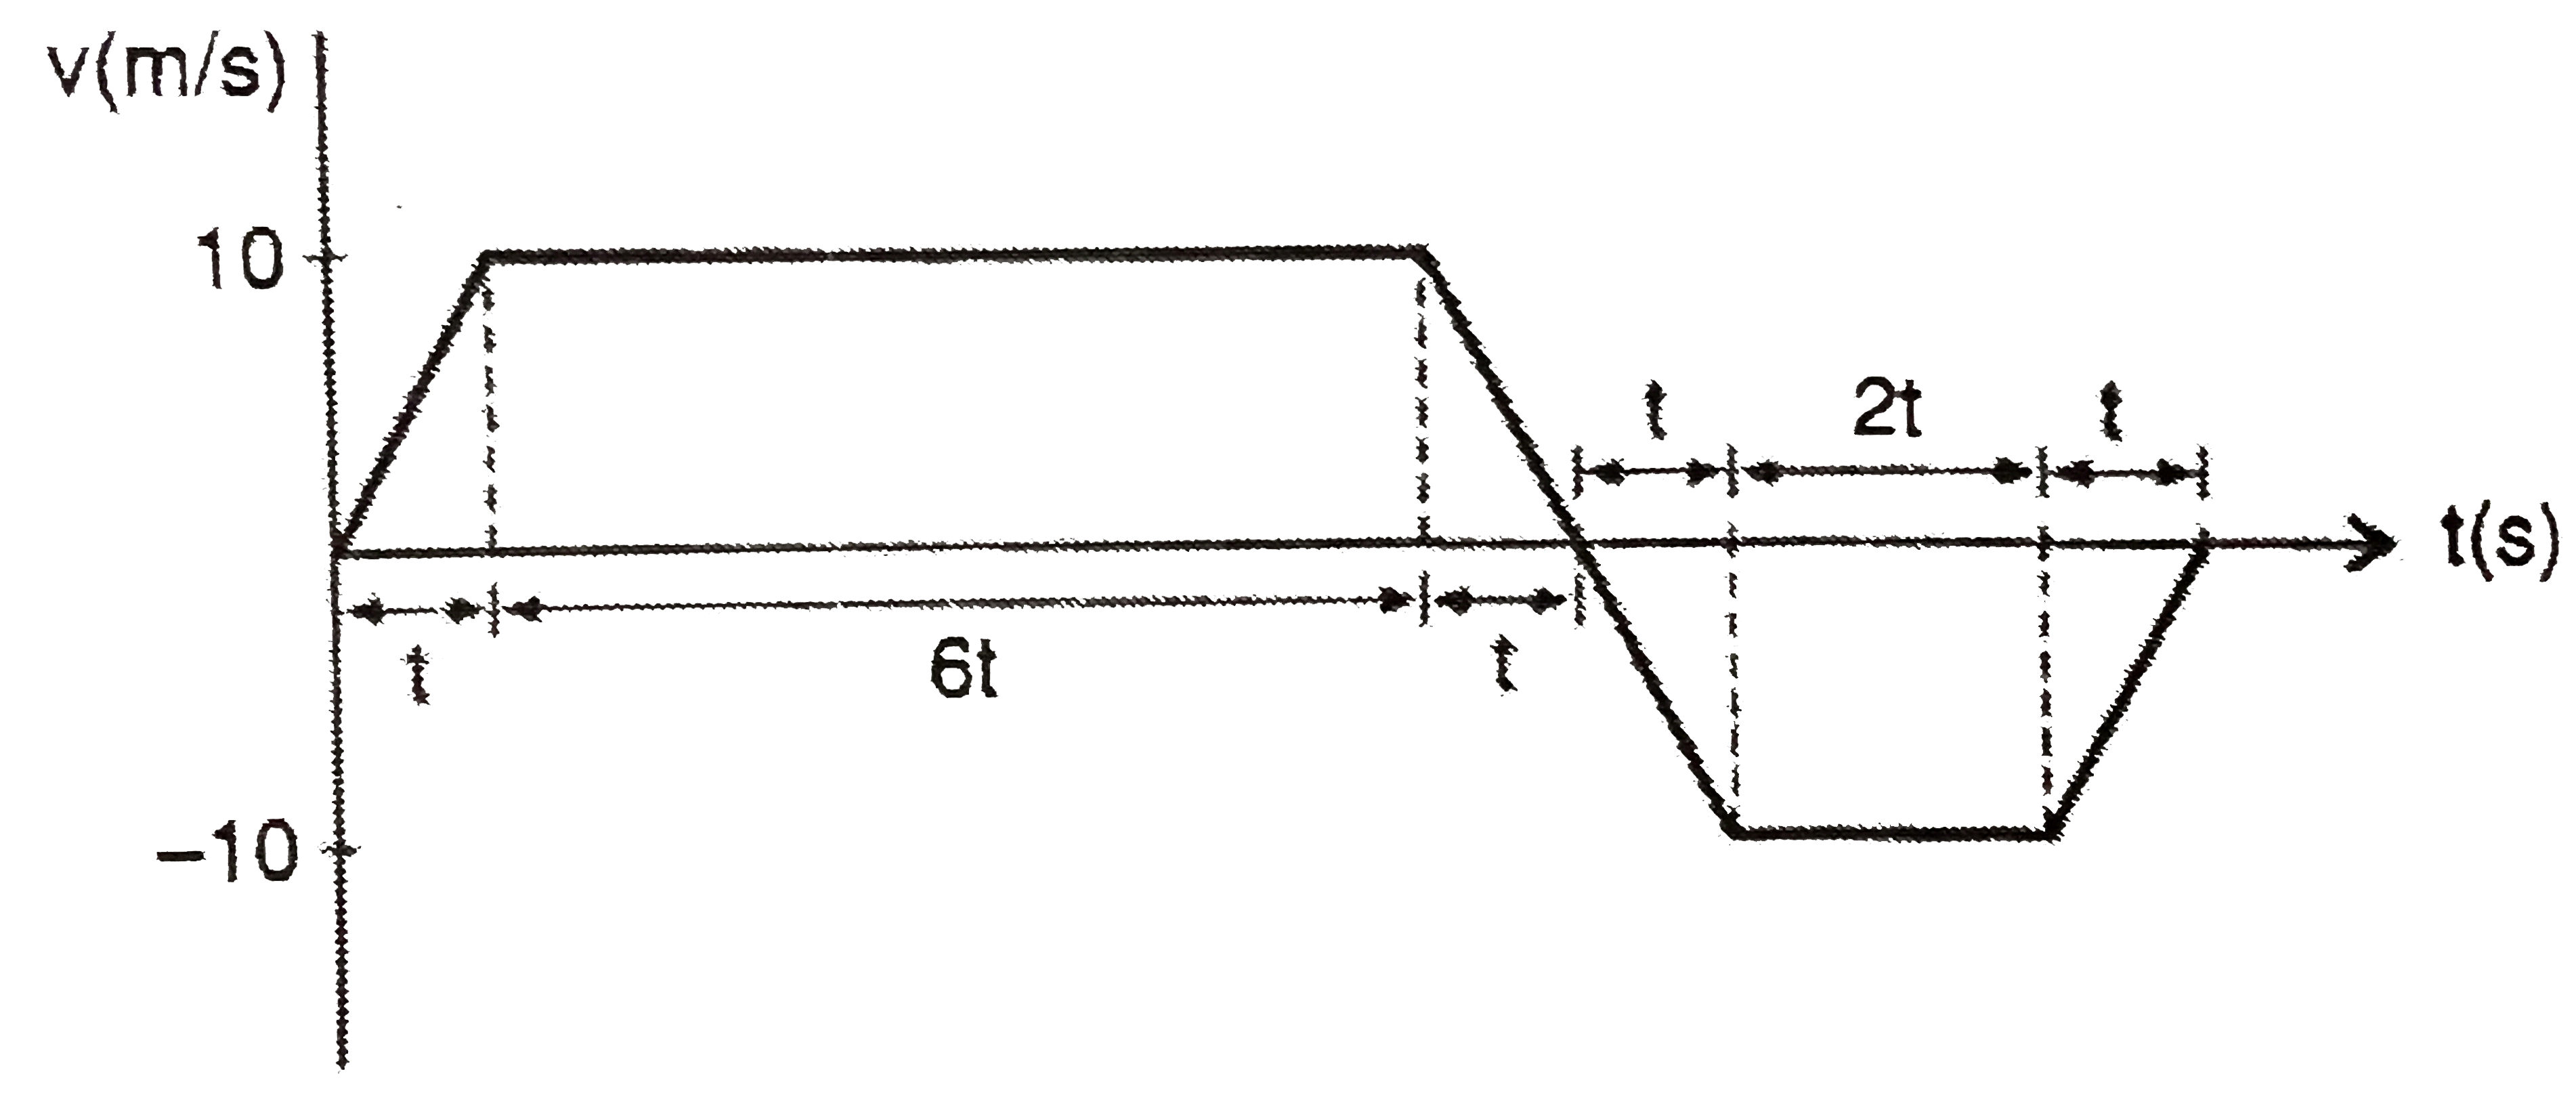
Average speed of the particle for the whole motion is:
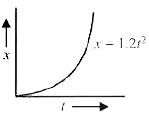
View SolutionGiven figure shows the distance-time graph of the motion of a car. It follows from the,| graph that the car is
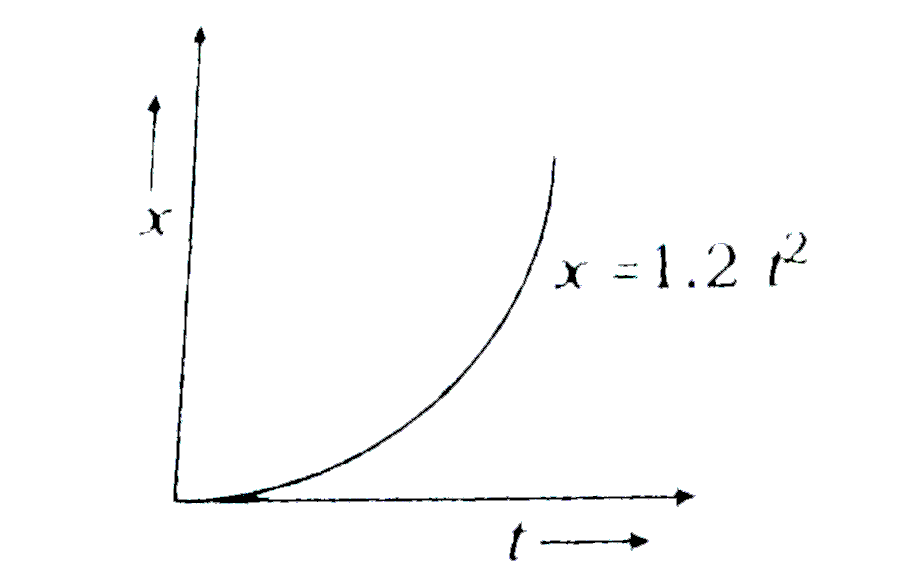
View SolutionFigure given shows the distance - time graph of the motion of a car. It follows from the graph that the car is
View Solution

