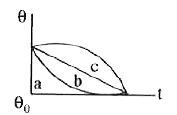
A hot liquid is kept in a big room. lts temper- ature is plotted as a function of time. Which of the following curves may represent the plot
 Solution in Telugu
a
b
c
d
The correct Answer is:A
Step by step video, text & image solution for A hot liquid is kept in a big room. lts temper- ature is plotted as a function of time. Which of the following curves may represent the plot by Physics experts to help you in doubts & scoring excellent marks in Class 11 exams.
Updated on:21/07/2023Similar Questions
Which of the following plots represents the behaviour of an ideal binary liquid solution ?
View SolutionA hot liquid is kept in a big room. The logarithm of the numerical value of the temperature difference between the liquid and the room is plotted against time. the plot will be very nearly
View SolutionWhich of the following plots may represent the reactance of a series LC combination?

View SolutionA hot liquid is kept in a big room. The logarithm of the numerical value of the temperature difference between the liquid and the room is plotted against time. The plot will be very nearly
View SolutionA hot liquid is kept in a bog room. Accoding to Newton's law of cooling rate of cooling liquid (represented as y) is plotted against its temperature T . Which of the following curves may represent the plot?
View SolutionA hot liquid is kept in a big room. The logarithm of the numerical value of the temperature difference between the liquid and the room is plotted against time. The plot will be very nearly
View SolutionA hot liquid is kept in a big room. The logarithm of the numerical value of the temperature difference between the liquid and the room is plotted against time.The plot will be very nearly
View SolutionA hot liquid is kept in a big room. According to Newton's law of cooling rate of cooling liquid (represented as y) is plotted against its temperature T . Which of the following curves may represent the plot?
View Solution
