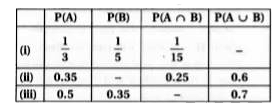
Find in the blanks in following table :
 Solution in Gujrati
The correct Answer is:0.15
Step by step video, text & image solution for Find in the blanks in following table : by Maths experts to help you in doubts & scoring excellent marks in Class 11 exams.
Updated on:21/07/2023Topper's Solved these Questions
- PROBABILITYBOOK - KUMAR PRAKASHANCHAPTER - PROBABILITYEXERCISE - Miscllaneous Exercise : 16
10 Videos
- PROBABILITYBOOK - KUMAR PRAKASHANCHAPTER - PROBABILITYEXERCISE - Textbook based MCQs
20 Videos
- PROBABILITYBOOK - KUMAR PRAKASHANCHAPTER - PROBABILITYEXERCISE - EXERCISE : 16.2
15 Videos
- PRINCIPLE OF MATHEMATICAL INDUCTIONBOOK - KUMAR PRAKASHANCHAPTER - PRINCIPLE OF MATHEMATICAL INDUCTIONEXERCISE - NCERT EXEMPLAR PROBLEMS (QUESTION OF MODULE )
11 Videos
- RELATIONS AND FUNCTIONSBOOK - KUMAR PRAKASHANCHAPTER - RELATIONS AND FUNCTIONSEXERCISE - Solutions of NCERT Exemplar Problems (Question of Module)
16 Videos
Similar Questions
A box contains 10 red marbles, 20 blue marbles and 30 green marbles. 5 marbles are drawn from the box, what is the probability that
(i) all will be blue ?
(ii) at least one will be green ?
View SolutionA and B are mutually exclusive events. If P(B)=0.4 and P(A) =0.5 then P(A'∩B')=……
View SolutionA die is rolled. Let E be the event ''die shows 4'' and F be the event ''die shows even number''. Are E and F mutually exclusive ?
View SolutionBy using the principle of mathematical induction , prove the follwing :
P(n)+1+3+5+……….+(2n−1)=n2,n∈N
View SolutionA={−1,0},B={−1,0,1}, then find A×BandB×A
View SolutionWhich of the following are correct chain isomers of butane ? (i)
View SolutionDetermine the point of symmetry of a regular hexagon.
View SolutionDtermine the images of the following figure about the given line :
View SolutionMatch the following Column A to Column B

View SolutionMatch the following Column A to Column B

View SolutionMatch the following Column A to Column B

View SolutionFind the area of figure given below.

View SolutionFind the perimeter of the figure given below.

View SolutionFind the area of the figure given below.

View SolutionThe inequation represented by the graph given below is :
View SolutionThe inequation that best describes the graph given below is _________
View Solution
