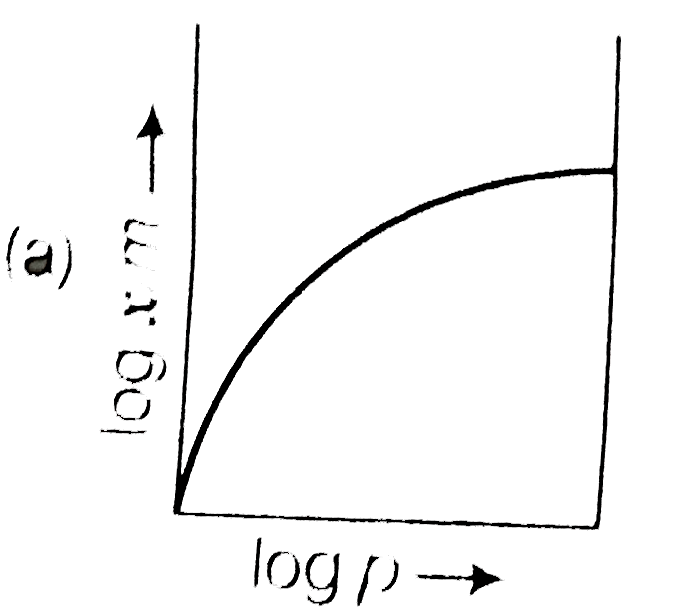
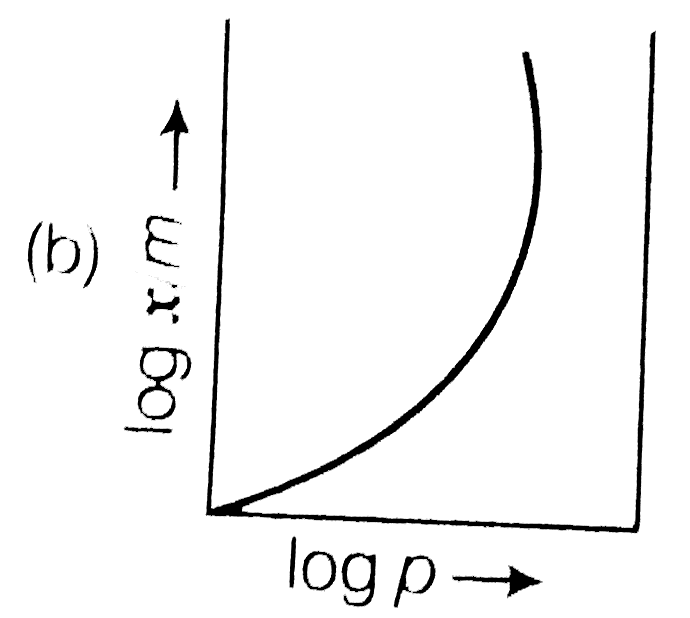
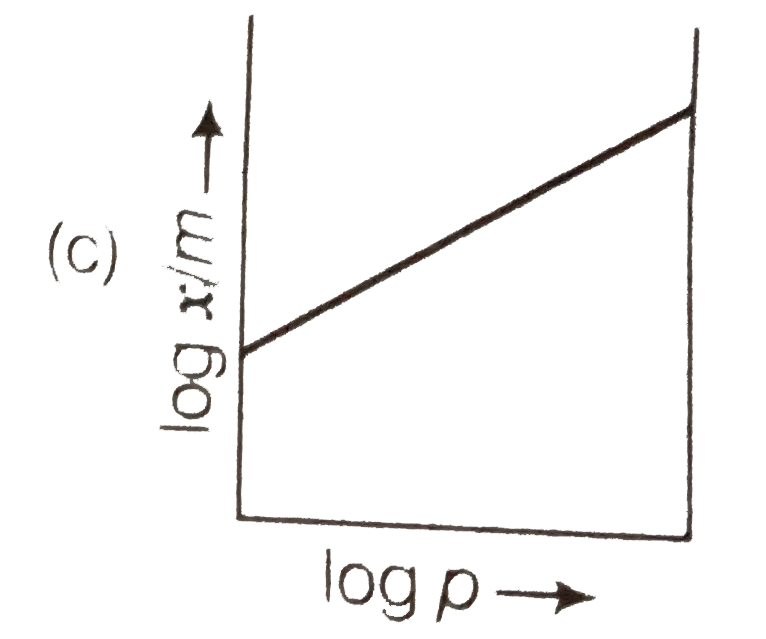
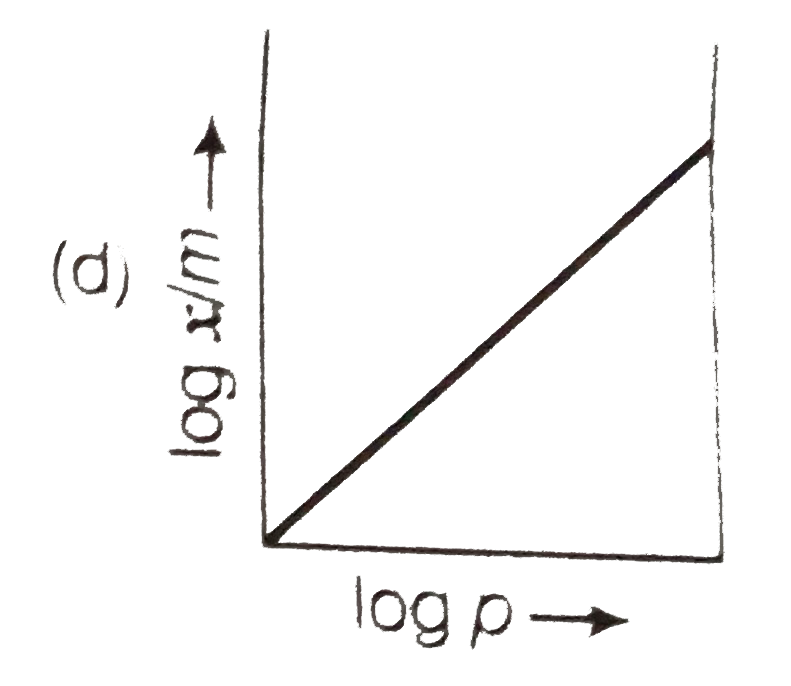
Which of the following curves is in accordance with Freundlich adsorption isotherm ?
The correct Answer is:C
To determine which curve is in accordance with the Freundlich adsorption isotherm, we need to understand the relationship defined by this isotherm. Here's a step-by-step solution:
Step 1: Understand the Freundlich Adsorption Isotherm
The Freundlich adsorption isotherm describes how the quantity of gas adsorbed (X) by a unit mass of solid adsorbent (M) relates to the pressure (P) of the gas at a constant temperature. The equation is given by:
XM=K⋅P1n
Where:
- X = mass of gas adsorbed
- M = mass of adsorbent
- K and n = constants
- P = pressure
Step 2: Take the Logarithm of Both Sides
To analyze the relationship graphically, we take the logarithm of both sides:
log(XM)=log(K)+1nlog(P)
This can be rearranged to:
log(XM)=log(K)+1nlog(P)
Step 3: Identify the Graph Type
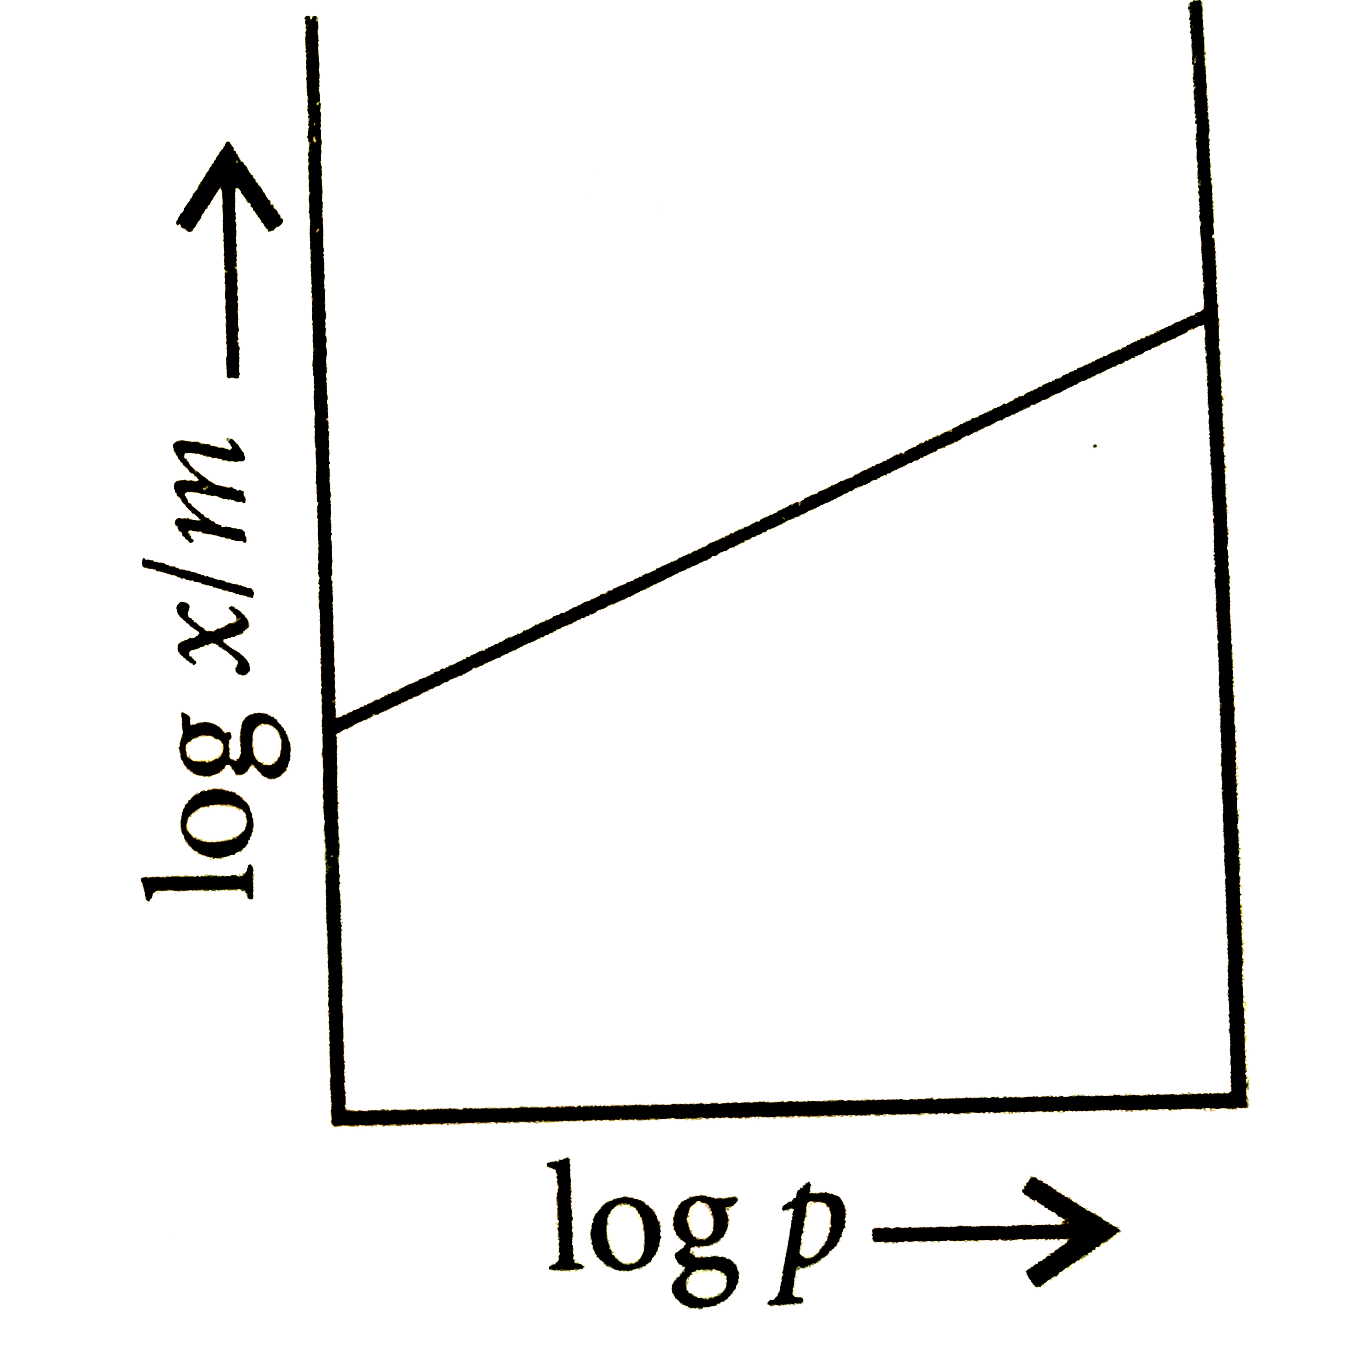
This equation indicates that if we plot log(XM) (y-axis) against log(P) (x-axis), we should get a straight line. The slope of this line will be 1n and the y-intercept will be log(K).
Step 4: Analyze the Given Options
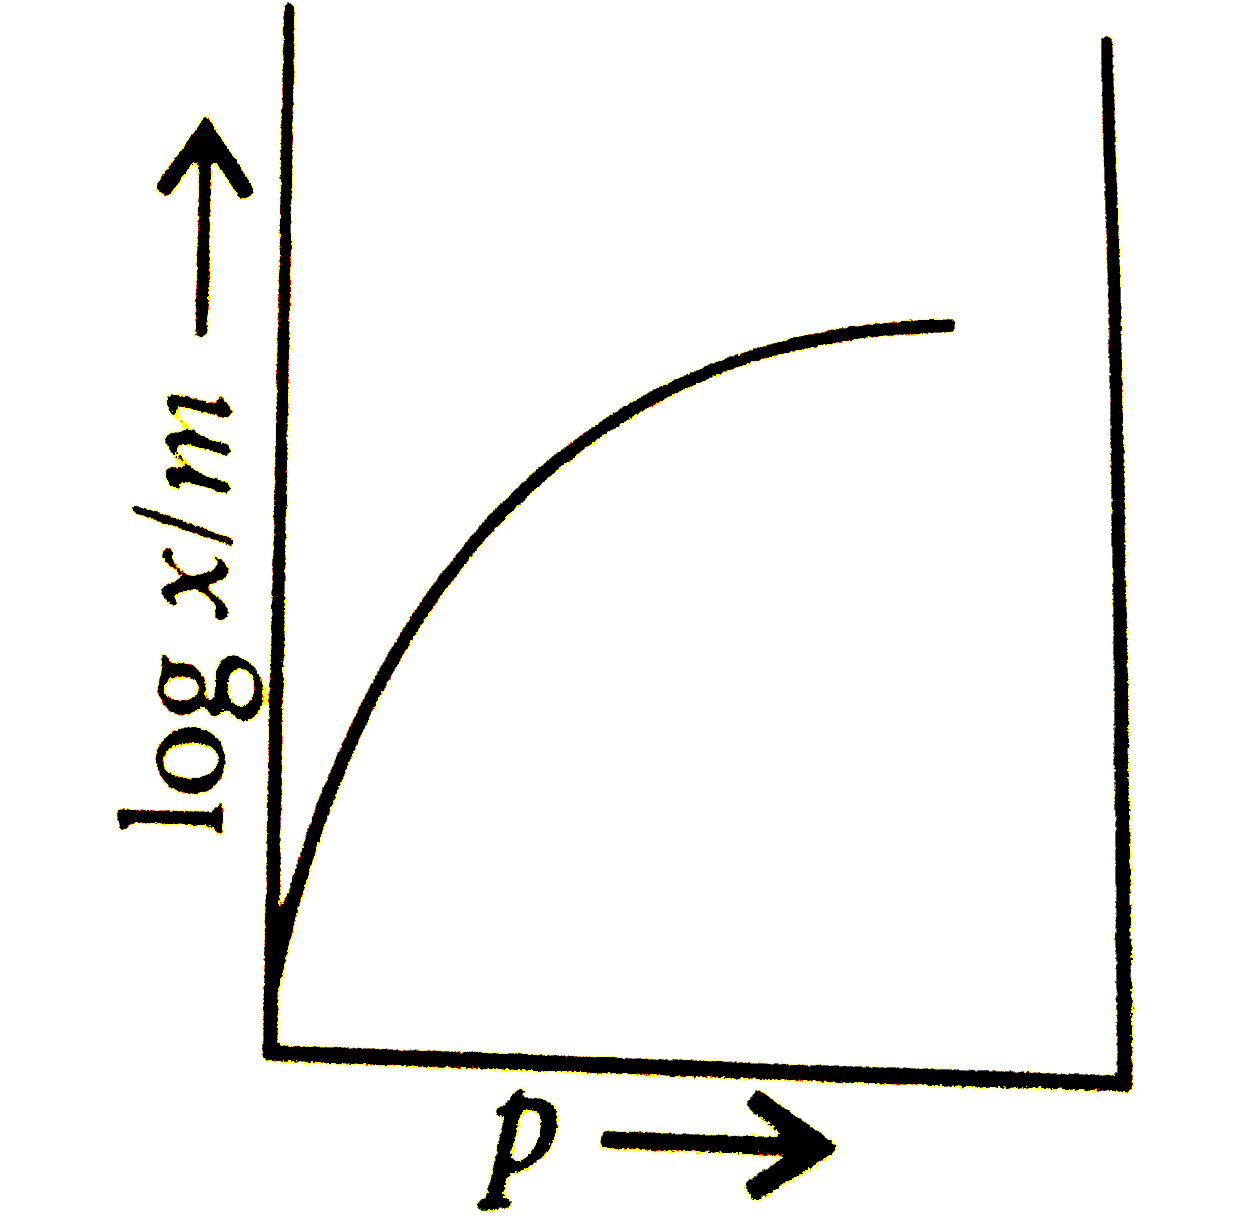
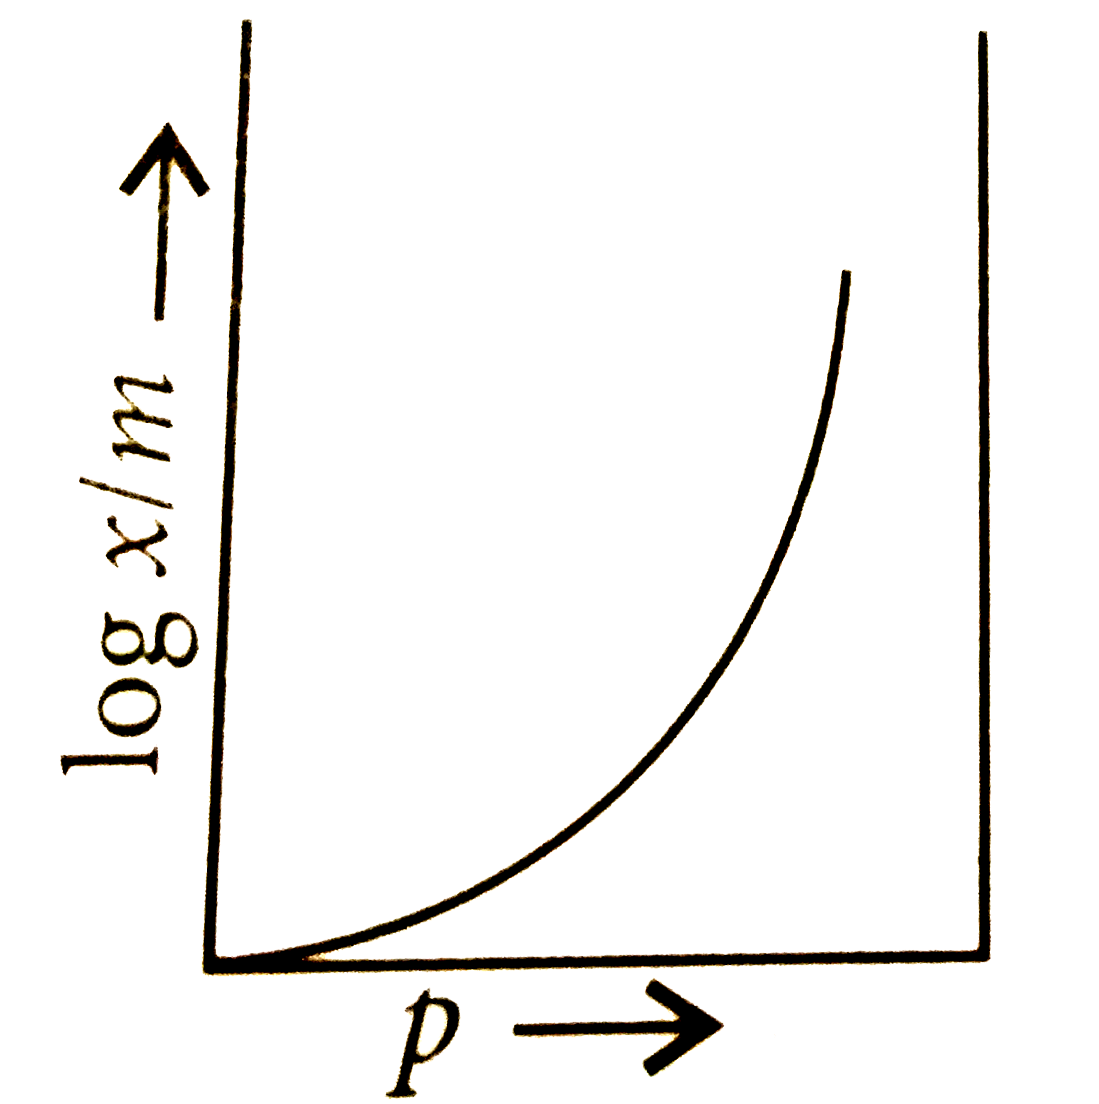
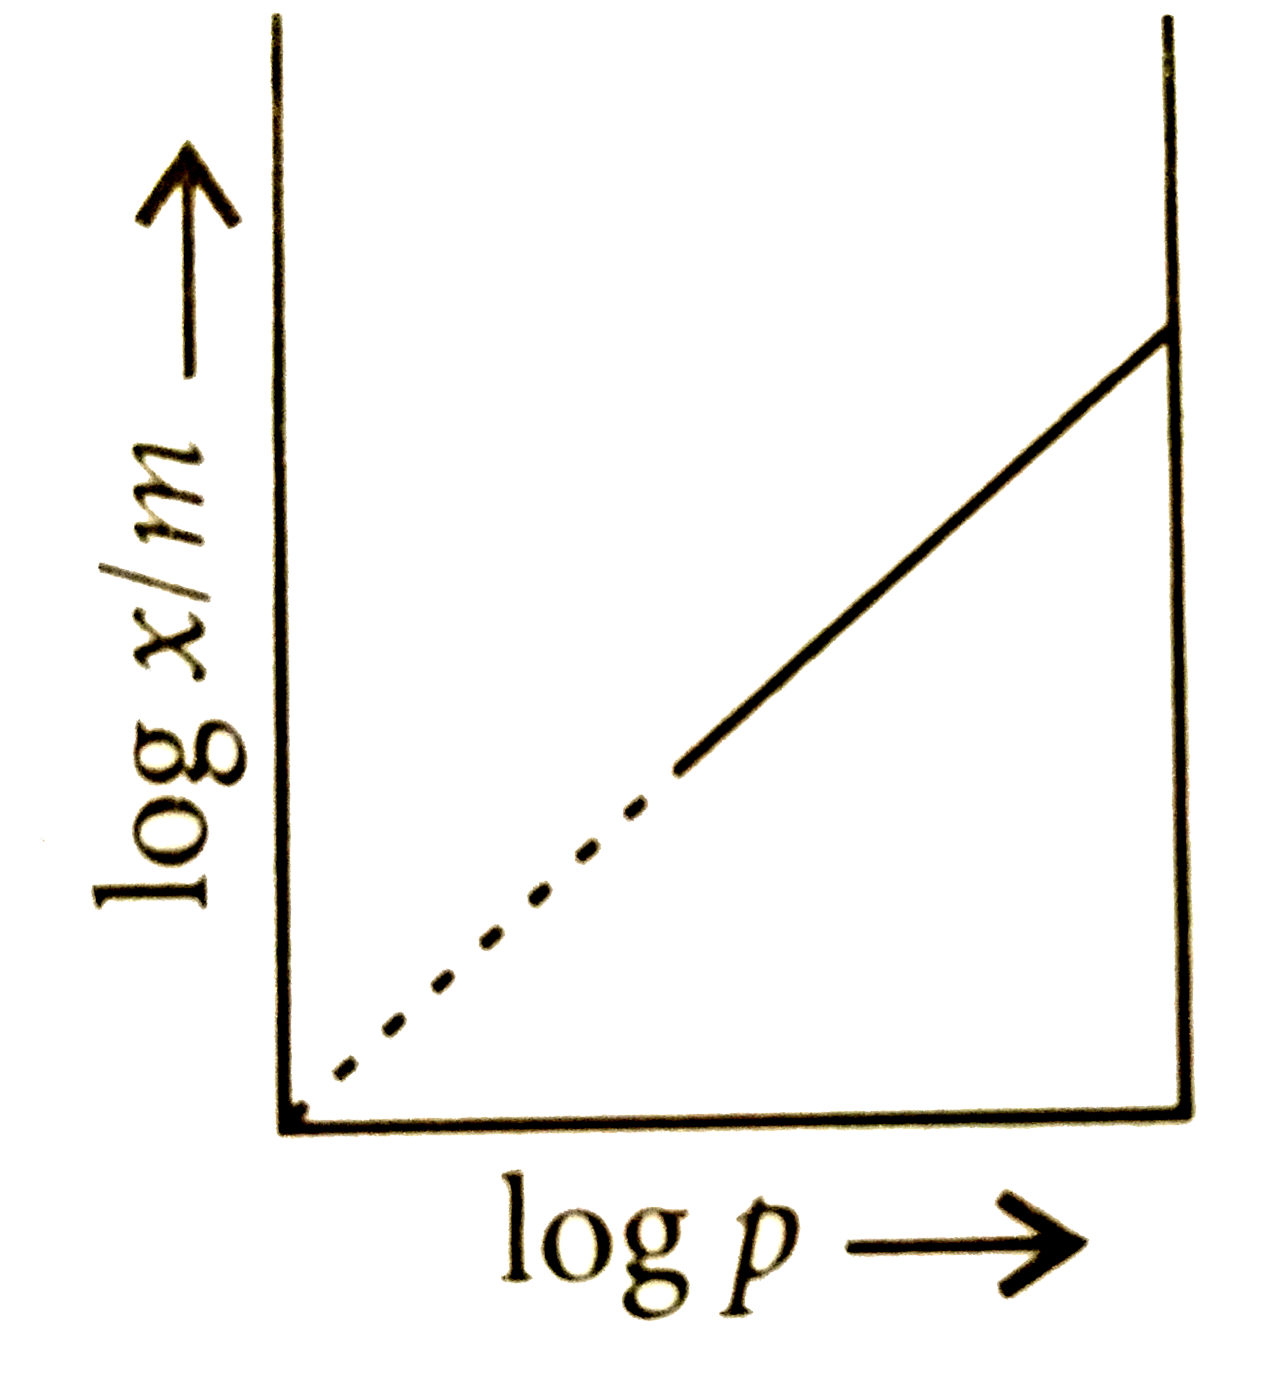
Now, we need to analyze the provided curves (options 1, 2, 3, and 4) to see which one represents a linear relationship between log(XM) and log(P).
- Option 1: log(XM) vs. P (not correct, should be vs. log(P))
- Option 2: log(XM) vs. P (not correct, same reason)
- Option 3: log(XM) vs. log(P) (correct, should show a linear relationship)
- Option 4: log(XM) vs. log(P) (correct, but we need to verify if it represents the same relationship as option 3)
Step 5: Conclusion
After analyzing the options, we find that Option 3 is the correct representation of the Freundlich adsorption isotherm, as it shows the expected linear relationship between log(XM) and log(P).
Final Answer
The curve that is in accordance with the Freundlich adsorption isotherm is Option 3.
---
The Freundlich adsorption isotherm describes how the quantity of gas adsorbed (X) by a unit mass of solid adsorbent (M) relates to the pressure (P) of the gas at a constant temperature. The equation is given by:
- X = mass of gas adsorbed
- M = mass of adsorbent
- K and n = constants
- P = pressure
To analyze the relationship graphically, we take the logarithm of both sides:
This equation indicates that if we plot log(XM) (y-axis) against log(P) (x-axis), we should get a straight line. The slope of this line will be 1n and the y-intercept will be log(K).
Now, we need to analyze the provided curves (options 1, 2, 3, and 4) to see which one represents a linear relationship between log(XM) and log(P).
- Option 2: log(XM) vs. P (not correct, same reason)
- Option 3: log(XM) vs. log(P) (correct, should show a linear relationship)
- Option 4: log(XM) vs. log(P) (correct, but we need to verify if it represents the same relationship as option 3)
After analyzing the options, we find that Option 3 is the correct representation of the Freundlich adsorption isotherm, as it shows the expected linear relationship between log(XM) and log(P).
The curve that is in accordance with the Freundlich adsorption isotherm is Option 3.
Topper's Solved these Questions
- SURFACE CHEMISTRYBook:NCERT FINGERTPS ENGLISHChapter:SURFACE CHEMISTRYExercise:ASSERTION & REASON
Explore 15 Videos
- SURFACE CHEMISTRYBook:NCERT FINGERTPS ENGLISHChapter:SURFACE CHEMISTRYExercise:Adsorption
Explore 26 Videos
- SURFACE CHEMISTRYBook:NCERT FINGERTPS ENGLISHChapter:SURFACE CHEMISTRYExercise:HOTS
Explore 7 Videos
- SOLUTIONS Book:NCERT FINGERTPS ENGLISHChapter:SOLUTIONS Exercise:Assertion And Reason
Explore 15 Videos
- THE D- AND F- BLOCK ELEMENTS Book:NCERT FINGERTPS ENGLISHChapter:THE D- AND F- BLOCK ELEMENTS Exercise:Assertion And Reason
Explore 15 Videos
Similar Questions
Knowledge Check
Which of the following is not favourable condition for physical adsorption ?
AHigh pressureBnegative ΔHChigher critical temperature of adsorbateDhigh temperature
What is Freundlich adsorption isotherm ?
View SolutionThe equation for Freundlich adsorption isotherm is
View SolutionWhat is an adsorption isotherm ?
View SolutionWhich one of the following characteristics is associated with adsorption ?
View SolutionWhich of the following does not represent freundlich
adsorption isotherm?
View SolutionWhich of the following graphs represents freundlich adsorption isotherm?
View SolutionAccording to Freundlich's isotherm,
View Solution


