An exothermic chemical reaction proceeds by two stages reactants products, The activation energy of stage is . The overall enthalpy change of the reaction is . Which diagram could represent the energy level diagram for the reaction ?
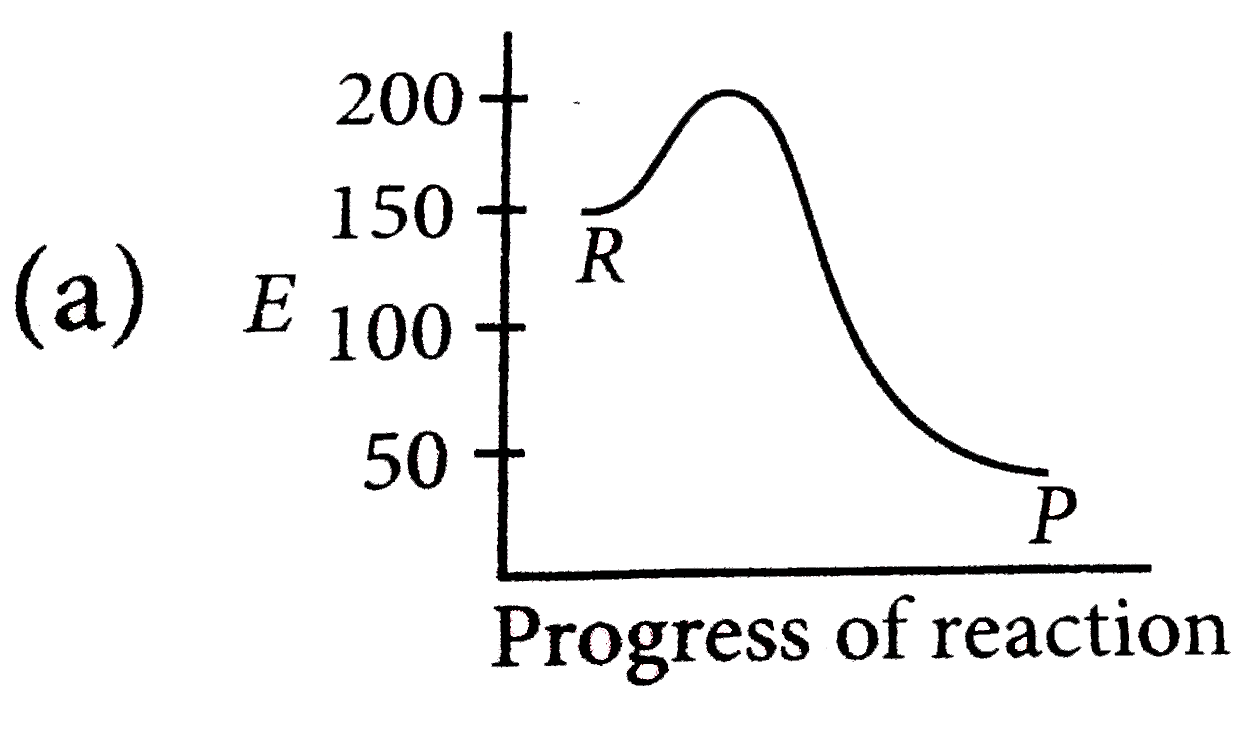
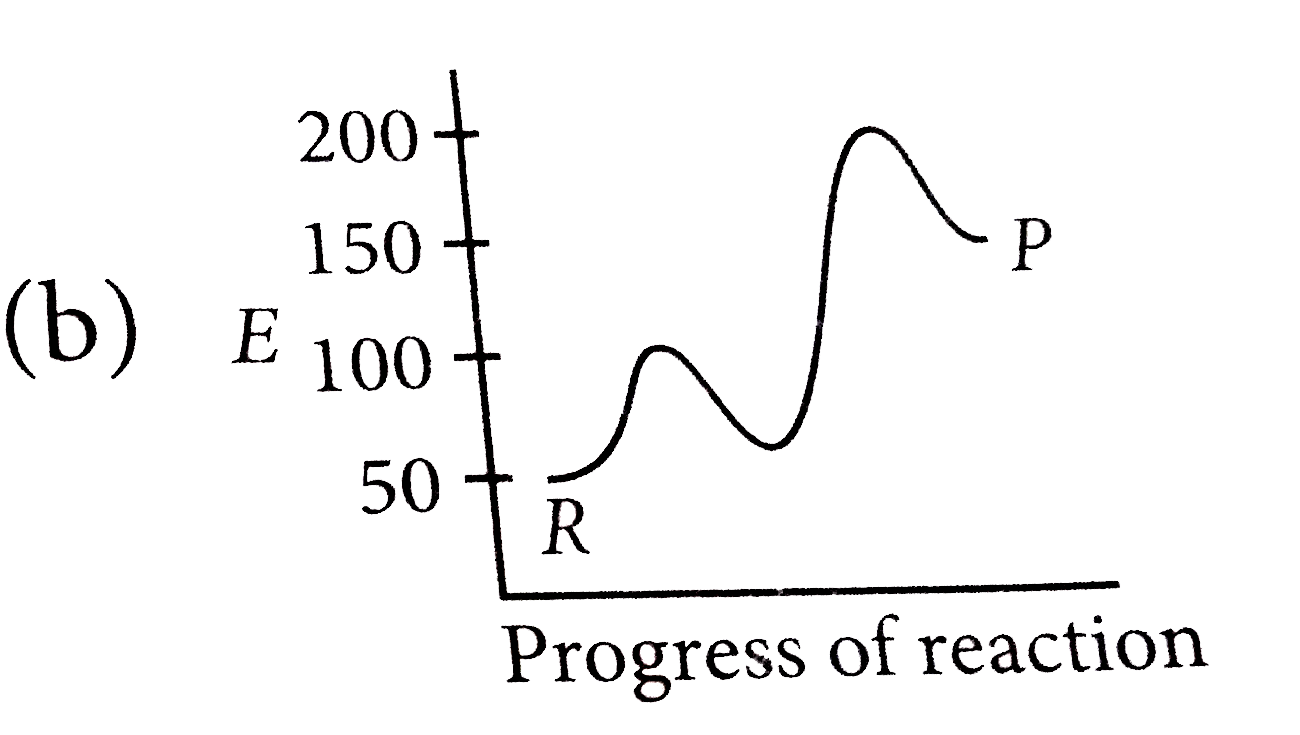
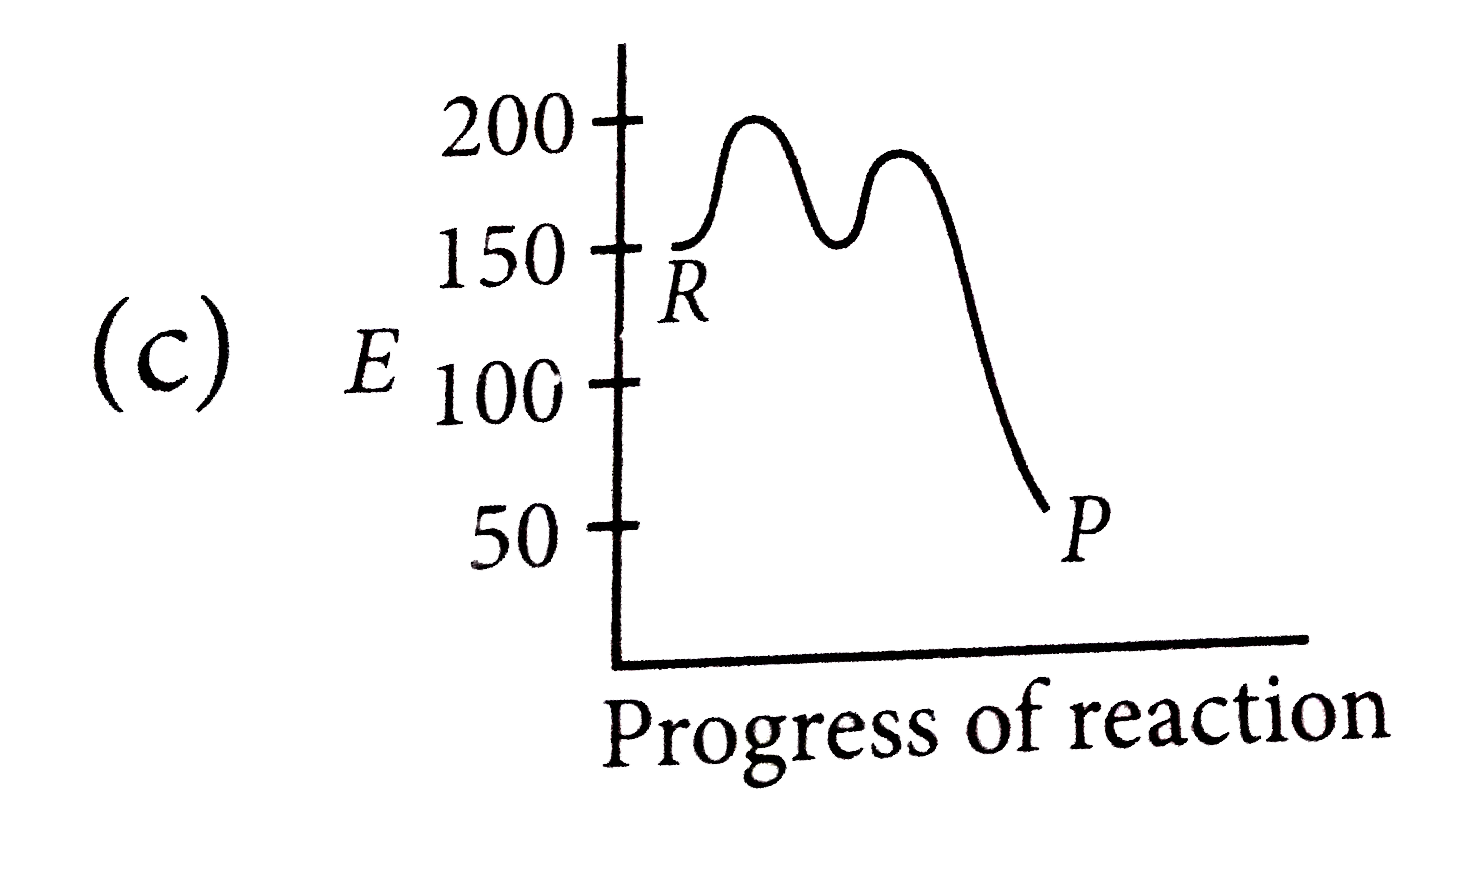
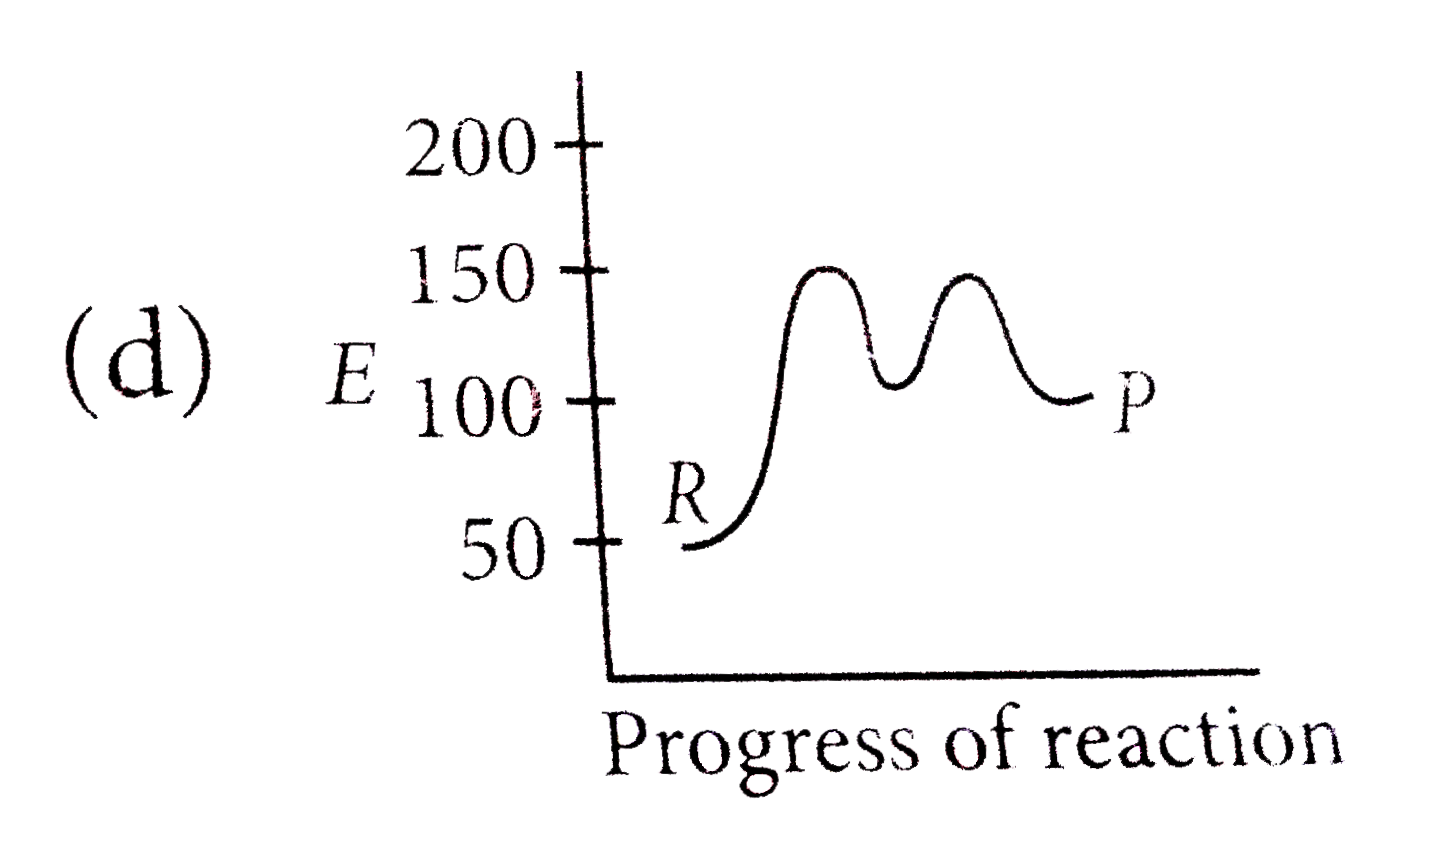
The correct Answer is:C
To solve the problem, we need to analyze the information given about the exothermic reaction that occurs in two stages. Let's break it down step by step.
Step 1: Understand the Reaction Stages
The reaction proceeds in two stages:
1. Stage I: Reactants convert to intermediates.
2. Stage II: Intermediates convert to products.
Step 2: Identify Given Data
- The activation energy (Ea) for Stage I is 50 kJ/mol.
- The overall enthalpy change (ΔH) for the reaction is -100 kJ/mol (indicating an exothermic reaction).
Step 3: Draw the Energy Level Diagram
1. Initial Energy Level: Start with the energy level of the reactants.
2. First Peak: Draw a peak representing the transition state for Stage I (the energy level will rise due to activation energy). The peak will be at 50 kJ above the reactants.
3. Intermediate Level: After Stage I, the energy level drops to the intermediate state.
4. Second Peak: Draw another peak for Stage II, which represents the transition state from intermediate to products. The height of this peak will depend on the activation energy for Stage II.
5. Final Energy Level: The energy level of the products will be lower than that of the reactants by 100 kJ (since ΔH is -100 kJ).
Step 4: Calculate the Energy Levels
- If we assume the energy of the reactants is at 0 kJ, then:
- The energy of the intermediates after Stage I will be at 50 kJ.
- The energy of the products will be at -100 kJ (0 - 100 = -100 kJ).
Step 5: Determine Activation Energy for Stage II
- The activation energy for Stage II can be calculated as the difference between the energy of the intermediates and the peak of Stage II.
- If we assume the peak for Stage II is at X kJ, then:
- Activation energy for Stage II = X - 50 kJ.
Step 6: Identify the Correct Diagram
- The correct energy level diagram must show:
- Two peaks (one for each stage).
- The energy of products lower than the reactants by 100 kJ.
- The activation energy for the backward reaction (from products to intermediates) must be greater than that for the forward reaction (from reactants to intermediates).
Conclusion
Based on the analysis, the correct energy level diagram will show:
- Two peaks.
- The energy of the products lower than the reactants by 100 kJ.
- The activation energy for the backward reaction greater than for the forward reaction.
The reaction proceeds in two stages:
1. Stage I: Reactants convert to intermediates.
2. Stage II: Intermediates convert to products.
- The activation energy (Ea) for Stage I is 50 kJ/mol.
- The overall enthalpy change (ΔH) for the reaction is -100 kJ/mol (indicating an exothermic reaction).
1. Initial Energy Level: Start with the energy level of the reactants.
2. First Peak: Draw a peak representing the transition state for Stage I (the energy level will rise due to activation energy). The peak will be at 50 kJ above the reactants.
3. Intermediate Level: After Stage I, the energy level drops to the intermediate state.
4. Second Peak: Draw another peak for Stage II, which represents the transition state from intermediate to products. The height of this peak will depend on the activation energy for Stage II.
5. Final Energy Level: The energy level of the products will be lower than that of the reactants by 100 kJ (since ΔH is -100 kJ).
- If we assume the energy of the reactants is at 0 kJ, then:
- The energy of the intermediates after Stage I will be at 50 kJ.
- The energy of the products will be at -100 kJ (0 - 100 = -100 kJ).
Step 5: Determine Activation Energy for Stage II
- The activation energy for Stage II can be calculated as the difference between the energy of the intermediates and the peak of Stage II.
- If we assume the peak for Stage II is at X kJ, then:
- Activation energy for Stage II = X - 50 kJ.
Step 6: Identify the Correct Diagram
- The correct energy level diagram must show:
- Two peaks (one for each stage).
- The energy of products lower than the reactants by 100 kJ.
- The activation energy for the backward reaction (from products to intermediates) must be greater than that for the forward reaction (from reactants to intermediates).
Based on the analysis, the correct energy level diagram will show:
- Two peaks.
- The energy of the products lower than the reactants by 100 kJ.
- The activation energy for the backward reaction greater than for the forward reaction.
Topper's Solved these Questions
- CHEMICAL KINETICSBook:NCERT FINGERTPS ENGLISHChapter:CHEMICAL KINETICSExercise:NCERT EXEMPLAR PROBLEMS
Explore 17 Videos
- CHEMICAL KINETICSBook:NCERT FINGERTPS ENGLISHChapter:CHEMICAL KINETICSExercise:ASSERTION & REASON
Explore 15 Videos
- CHEMICAL KINETICSBook:NCERT FINGERTPS ENGLISHChapter:CHEMICAL KINETICSExercise:Assertion And Reason
Explore 15 Videos
- BIOMOLECULESBook:NCERT FINGERTPS ENGLISHChapter:BIOMOLECULESExercise:Assertion And Reason
Explore 15 Videos
- CHEMISTRY IN EVERYDAY LIFE Book:NCERT FINGERTPS ENGLISHChapter:CHEMISTRY IN EVERYDAY LIFE Exercise:NCERT Exemplar
Explore 15 Videos
Similar Questions
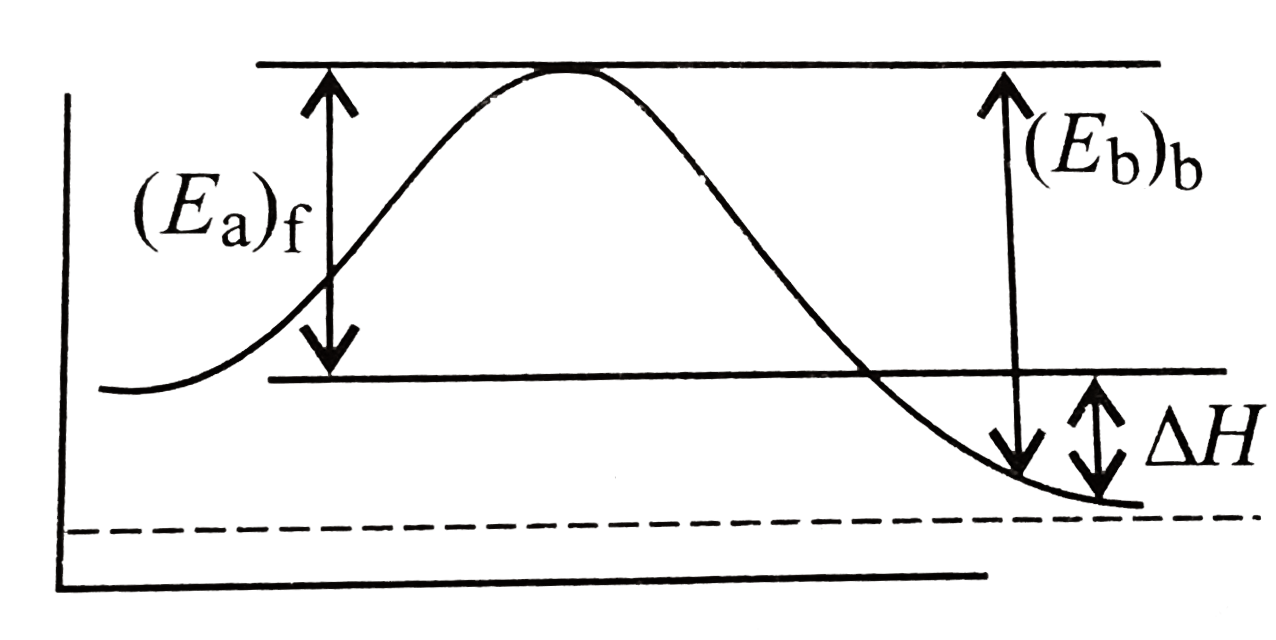
In an exothermic reaction X→Y, the activation energy is 100kJmol−1 of X. The enthalphy of the reaction is −140kJmol−1. The activation energy of the reverse reaction Y→X is
View SolutionThe activation energy of exothermic reaction A→B is 80 kJ mol−1 . The heat of reaction is 200kJmol−1. The activation energy for the reactionB→a ( in kJ/mol) will be :
View Solution
Knowledge Check
In a reaction P+Q→R+S, there is no change in entropy, Enthalpy change for the reaction (ΔH) is 12 kJ mol−1. Under what conditions, reaction will have negative value of free energy change?
AIf ΔH is positiveBIf ΔH is negative.CIf ΔH is 24 kJ mol−1.DIf temperature of reaction is high
The standard free energy change for a reaction is −213.3KJmol−1at25∘C. If the enthalpy change of the reaction is −217.77KJmole−1 . Calculate the magnitude of entropy change for the reaction in Joule mole−1
View SolutionThe activation energy for the forward reaction X→Y is 60kJmol−1 and ΔH is −20kJmol−1. The activation energy for the reverse reaction is
View SolutionAn exothermic reaction, A→B, has an activation energy of 15 kcal mol−1 and the energy of reaction is 5 kcal mol−1. The activation energy in kcal mol−1 for the reaction, B→A is
View SolutionThe energy change accompanying the equilibrium reaction A⇔B is −33.0kJmol−1. Calculate Equilibrium constant Ka for the reaction at 300 K
View SolutionThe enthalpy of formation of ammonia is −46.0KJmol−1 . The enthalpy change for the reaction 2NH3(g)→N2(g)+3H2(g) is :
View SolutionThe activation energy for most of the reaction is approximately 50kJmol−1. The rate for temperature coefficient for such reaction will be
View SolutionAn exothermic reaction X→Y has an activation energy of 90kJmol−1 of X and the heat of reaction is 250kJ. Find the activation energy of the reaction Y→X.
View Solution