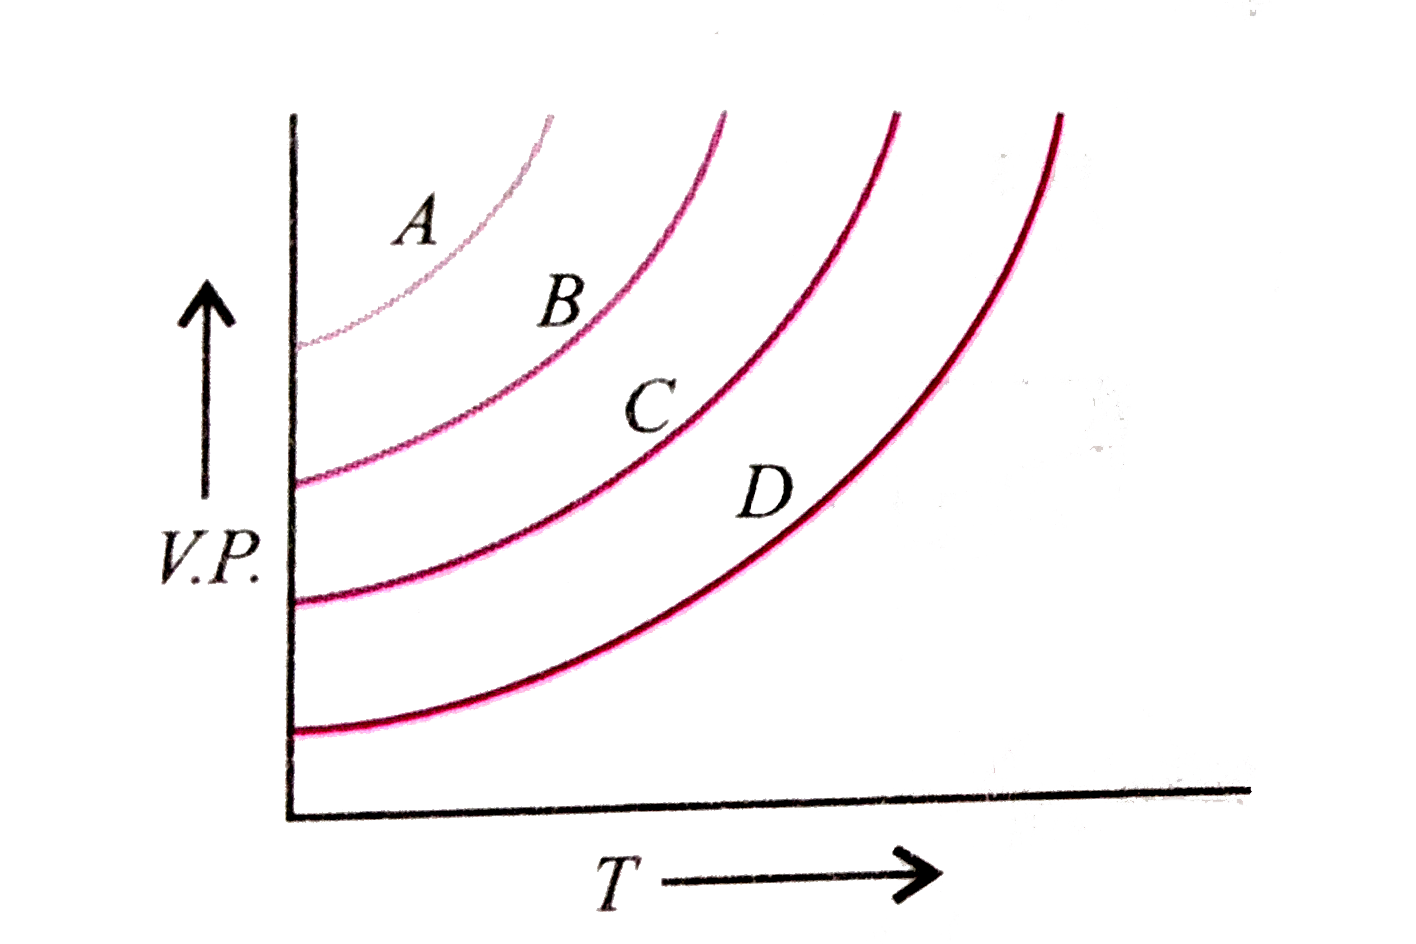
The given graph shows the vapour pressure - temperature curves for some liquids

Liquids A,B, C and D respectively are
diethyl ether, acetone , ethyl alcohol , water
acetone , ethyl alcohol, diethyl ether , water
water, ethyl alcohol , acetone , diethyl ether
ethyl alcohol, acetone , diethyl ether, water
The correct Answer is:A
The vapour pressure increases with decrease in intermolecular forces . When the forces are weak, the liquid has high volatility and maximum vapour pressure . Diethyl ether has highest vapour pressure while water has lowest vapour pressure.
Topper's Solved these Questions
- SOLUTIONS BOOK - NCERT FINGERTPS ENGLISHCHAPTER - SOLUTIONS EXERCISE - HOTS
10 Videos
- SOLUTIONS BOOK - NCERT FINGERTPS ENGLISHCHAPTER - SOLUTIONS EXERCISE - EXEMPLAR PROBLEMS
24 Videos
- PRACTICE PAPER -3BOOK - NCERT FINGERTPS ENGLISHCHAPTER - PRACTICE PAPER -3EXERCISE - Practice Paper 3
50 Videos
- SURFACE CHEMISTRYBOOK - NCERT FINGERTPS ENGLISHCHAPTER - SURFACE CHEMISTRYEXERCISE - Assertion And Reason
15 Videos
Similar Questions
Knowledge Check
The given graph shows the vapour pressure temperature curves for some liquids.

Liquids A, B, C and Drespectively are,AEthyl alcohol, acetone, diethyl ether, waterBWater, ethyl alcohol, acetone, diethyl etherCAcetone, ethyl alcohol, diethyl ether, waterDDiethyl ether, acetone, ethyl alcohol, waterVapour pressure of a liquid decreases with
Adecrease in temperatureBincrease in temperatureCincrease in surface areaDincrease in volume .
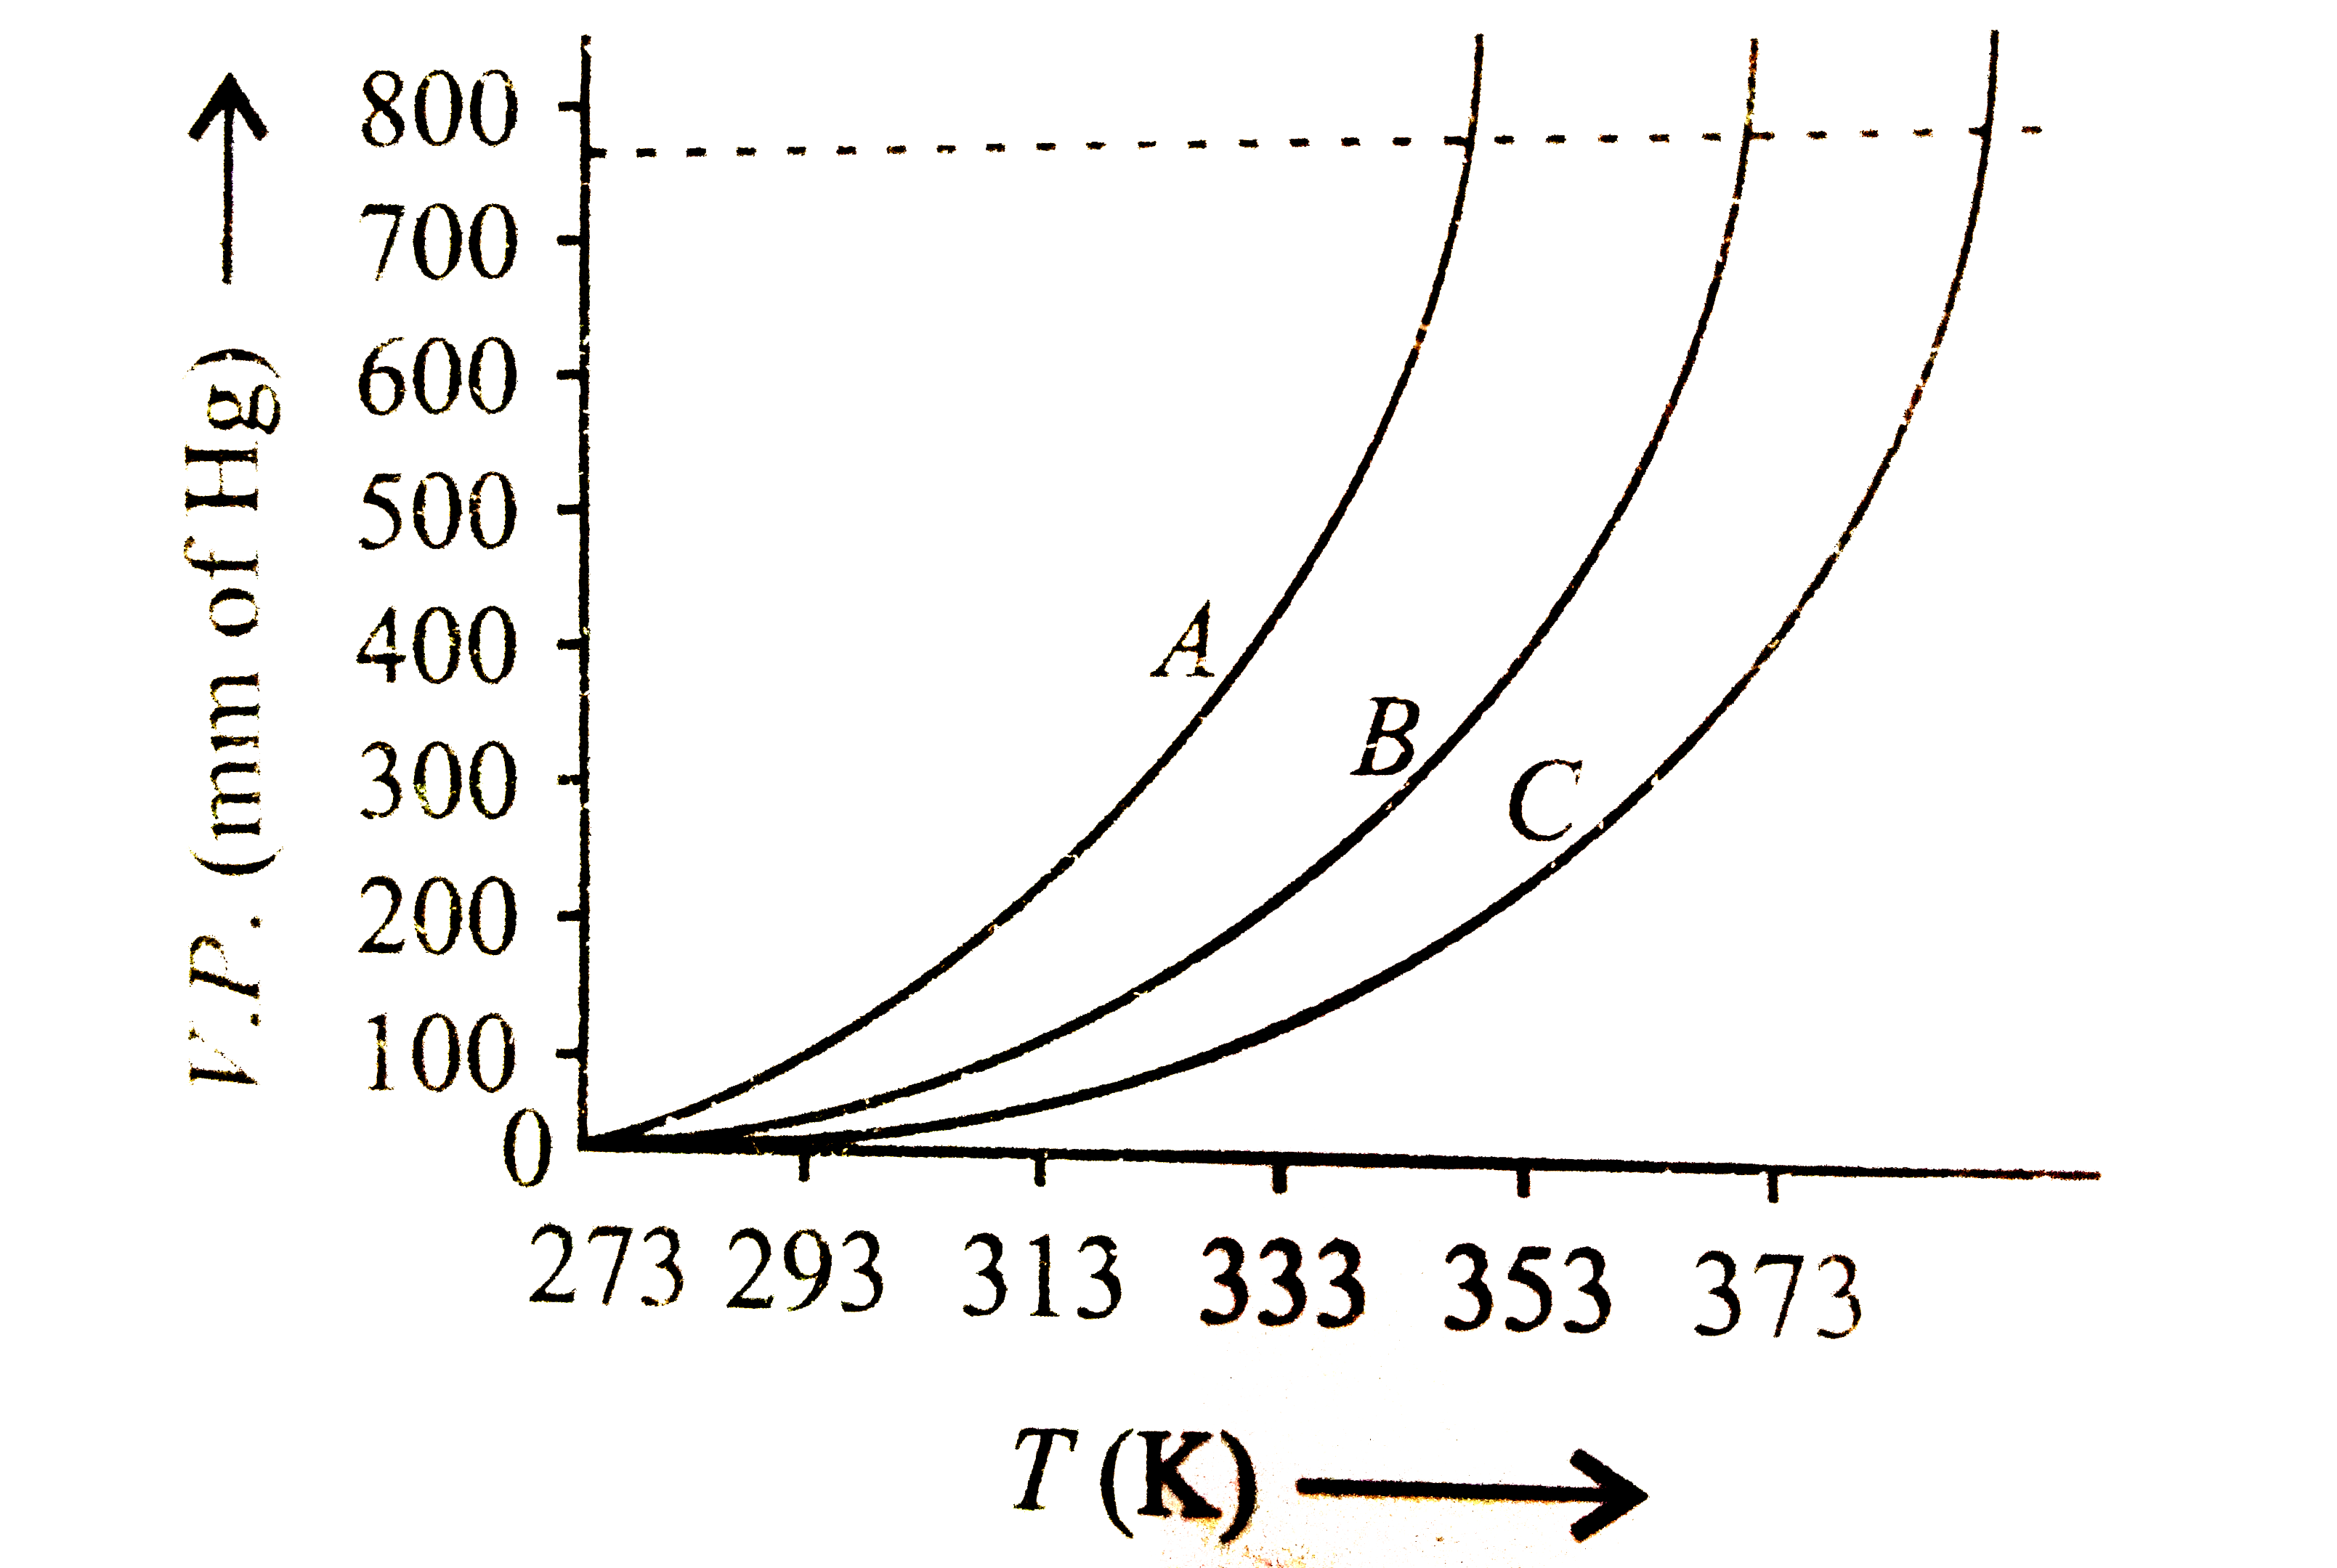
A graph between vapour pressure and temperature of few liquids is given below . Study the graph and answer the following :

Which of the following statements is true ?
View SolutionVapour pressure of a pure liquid does not depend upon
View SolutionThe vapour pressure of a given liquid will increase if
View SolutionIdentify which liquid will have a higher vapour pressure at 90∘C If the boiling point of two liquids A and B are 140∘ C and 180∘ C, respectively.
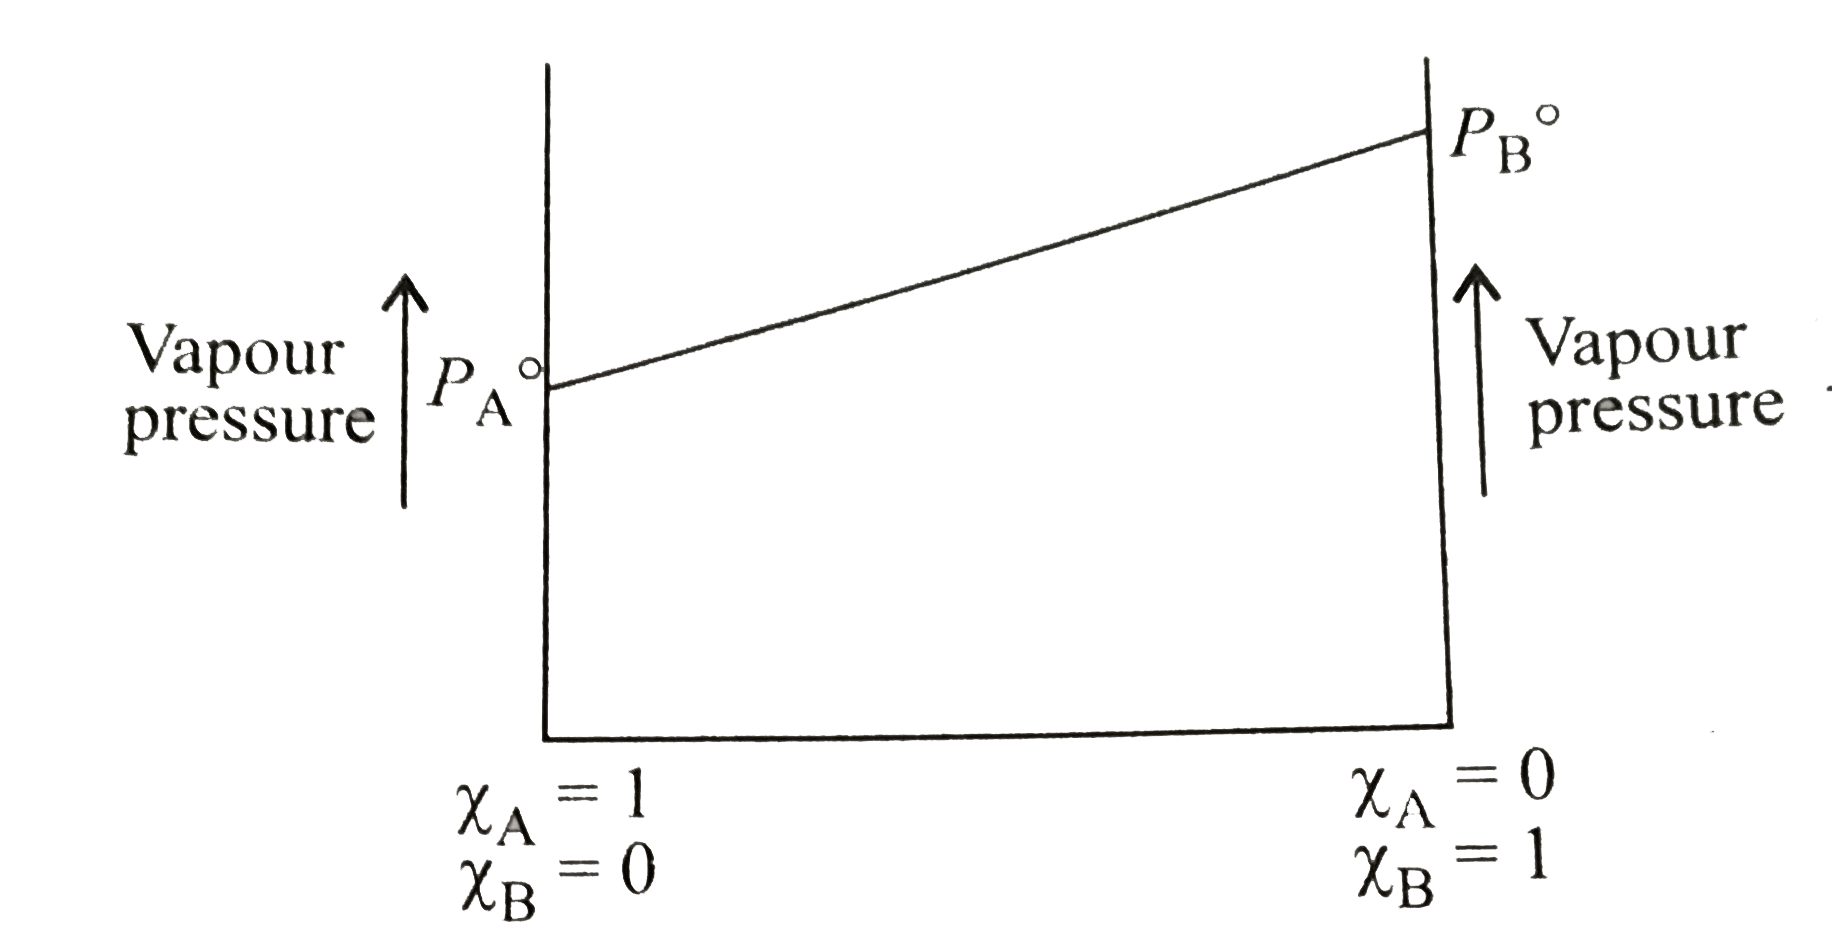
View SolutionThe following is a graph plotted between the vapour pressure of two volatile liquids against their respective mole fractions. Which of the following statements is/are correct?

View SolutionThe vapour pressure of a given liquid will decrease if :
View Solution
