A scientist was studying an in vitro euckaryotic transcription system, which produced both capped and uncapped mRNAs. For an experiment, he incubated these mRNAs with mammalian cell nuclear extract and quantified the different products as shown . Which of the following graphs represents the expected result correctly ?
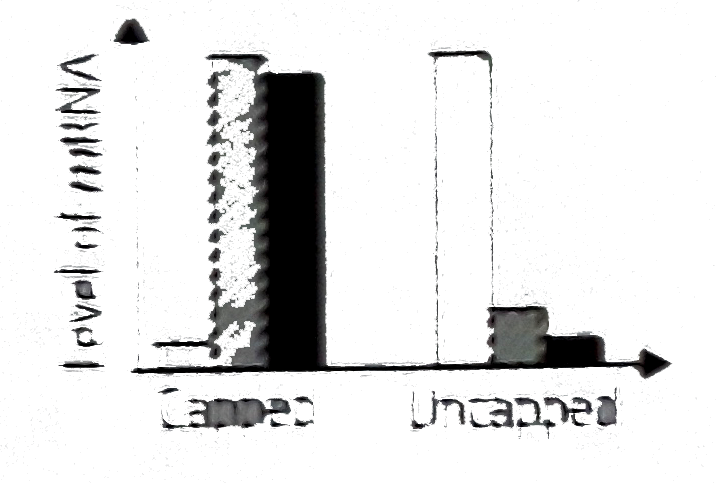
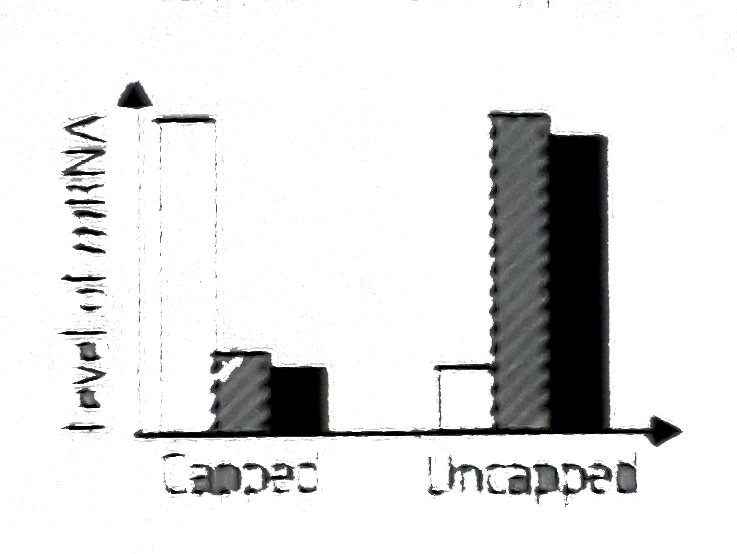
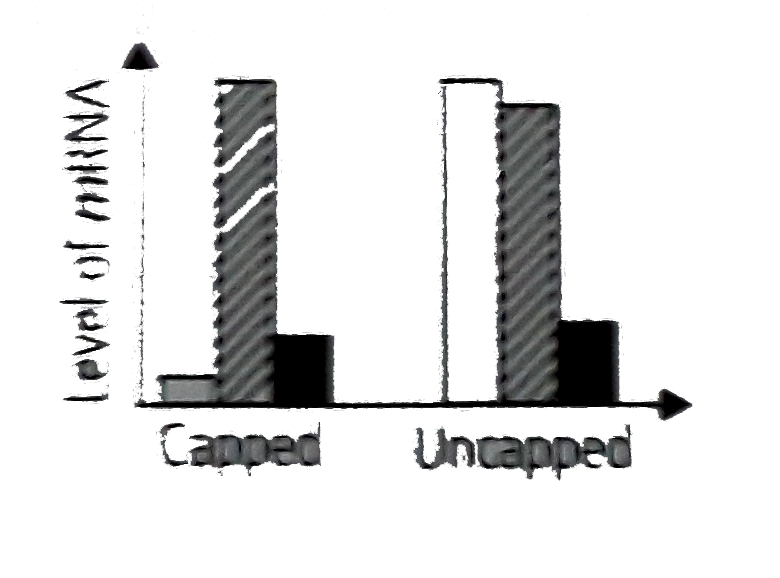
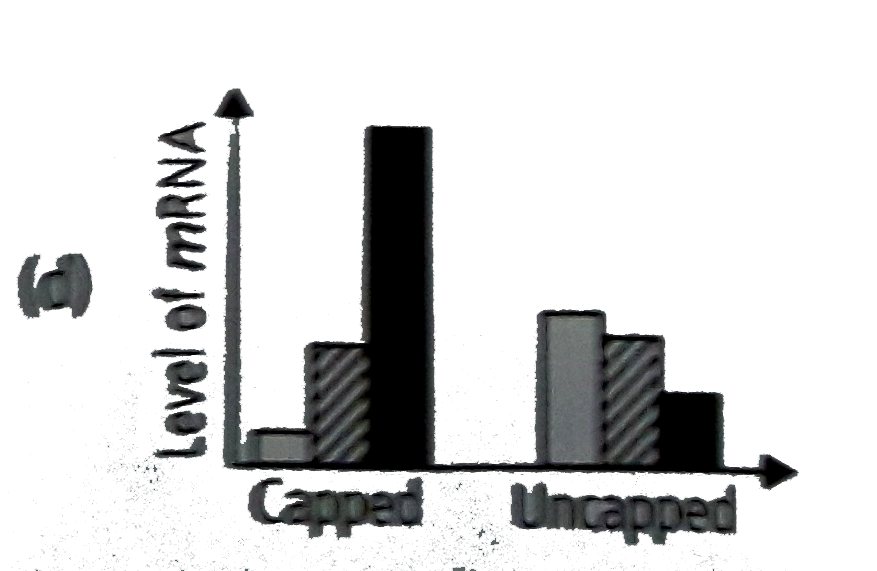
The correct Answer is:d
To solve the question regarding the expected results of an in vitro eukaryotic transcription system that produces both capped and uncapped mRNAs, we will analyze the processes involved in mRNA processing and how they relate to the graphs provided.
1. Understanding Pre-mRNA:
- Eukaryotic transcripts initially exist as pre-mRNA, which contains both introns and exons. This form is not yet functional and is the starting point for further processing.
2. Splicing Process:
- The first step in mRNA processing is splicing, where introns are removed, and exons are joined together. This results in spliced mRNA, which is a more stable and functional form of mRNA.
3. Capping and Polyadenylation:
- After splicing, the next step is capping, where a 7-methylguanylate cap is added to the 5' end of the mRNA. This cap protects the mRNA from degradation and assists in ribosome binding during translation.
- Additionally, a polyadenylate (poly-A) tail is added to the 3' end of the mRNA. This tail also contributes to the stability of the mRNA and aids in the export of mRNA from the nucleus to the cytoplasm.
4. Quantification of mRNA Forms:
- After processing, we can expect to quantify three forms of mRNA:
- Pre-mRNA: This will be the least abundant since it is the starting material and is rapidly processed.
- Spliced mRNA: This will be more abundant than pre-mRNA but less than polyadenylated mRNA.
- Polyadenylated mRNA: This will be the most abundant form, as it represents the final processed and stable mRNA ready for translation.
5. Analyzing the Graphs:
- When analyzing the graphs, we should look for a representation where:
- The quantity of pre-mRNA is the lowest.
- The quantity of spliced mRNA is intermediate.
- The quantity of polyadenylated mRNA is the highest.
- The graph that meets these criteria will represent the expected results correctly.
6. Conclusion:
- Based on the analysis, the correct graph will show the highest quantity of polyadenylated mRNA, followed by spliced mRNA, and the lowest for pre-mRNA. This corresponds to option D, which accurately reflects the expected results of the experiment.
- Eukaryotic transcripts initially exist as pre-mRNA, which contains both introns and exons. This form is not yet functional and is the starting point for further processing.
- The first step in mRNA processing is splicing, where introns are removed, and exons are joined together. This results in spliced mRNA, which is a more stable and functional form of mRNA.
- After splicing, the next step is capping, where a 7-methylguanylate cap is added to the 5' end of the mRNA. This cap protects the mRNA from degradation and assists in ribosome binding during translation.
- Additionally, a polyadenylate (poly-A) tail is added to the 3' end of the mRNA. This tail also contributes to the stability of the mRNA and aids in the export of mRNA from the nucleus to the cytoplasm.
- After processing, we can expect to quantify three forms of mRNA:
- Pre-mRNA: This will be the least abundant since it is the starting material and is rapidly processed.
- Spliced mRNA: This will be more abundant than pre-mRNA but less than polyadenylated mRNA.
- Polyadenylated mRNA: This will be the most abundant form, as it represents the final processed and stable mRNA ready for translation.
- When analyzing the graphs, we should look for a representation where:
- The quantity of pre-mRNA is the lowest.
- The quantity of spliced mRNA is intermediate.
- The quantity of polyadenylated mRNA is the highest.
- The graph that meets these criteria will represent the expected results correctly.
- Based on the analysis, the correct graph will show the highest quantity of polyadenylated mRNA, followed by spliced mRNA, and the lowest for pre-mRNA. This corresponds to option D, which accurately reflects the expected results of the experiment.
Topper's Solved these Questions
- MOLECULAR BASIS OF INHERITANCEBook:NCERT FINGERTPS ENGLISHChapter:MOLECULAR BASIS OF INHERITANCEExercise:NCERT
Explore 28 Videos
- MOLECULAR BASIS OF INHERITANCEBook:NCERT FINGERTPS ENGLISHChapter:MOLECULAR BASIS OF INHERITANCEExercise:CORNER
Explore 15 Videos
- MOLECULAR BASIS OF INHERITANCEBook:NCERT FINGERTPS ENGLISHChapter:MOLECULAR BASIS OF INHERITANCEExercise:Molecular Basis Of Inheritance
Explore 151 Videos
- MICROBES IN HUMAN WELFAREBook:NCERT FINGERTPS ENGLISHChapter:MICROBES IN HUMAN WELFAREExercise:Microbes In Human Welfare
Explore 138 Videos
- ORGANISMS AND POPULATIONBook:NCERT FINGERTPS ENGLISHChapter:ORGANISMS AND POPULATIONExercise:Organisms And Population
Explore 175 Videos
Similar Questions
In a DNA strand the nucleotides are linked together by
View SolutionAssertion : The sugar phosphatebackone of two chains in DNA double helix show anti-parallel polarity.
Reason : The phosphodiester bonds in one strand go from a 3' cardon of one nucleotide to a 5, carbon of adjacent nucleotide, whereas those in complementary strand go vice versa.
View SolutionWhat does A and B represent in the given representation ?
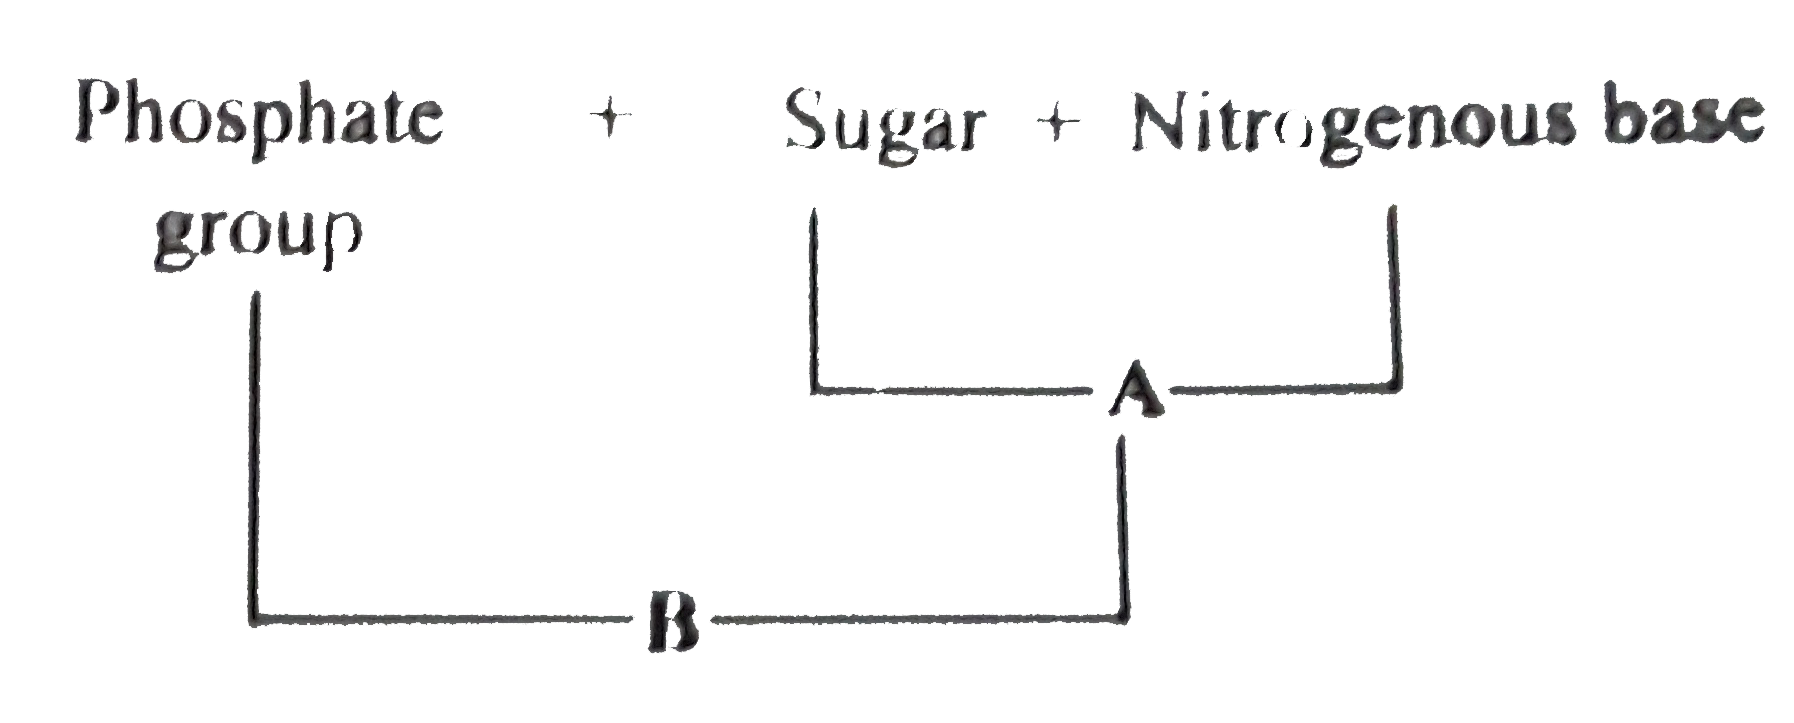
View SolutionMicrobes are present in
View SolutionRefer to the given flow chart.

Identify X and select the correct option.
View SolutionA scientist was studying an in vitro euckaryotic transcription system, which produced both capped and uncapped mRNAs. For an experiment, he incubated these mRNAs with mammalian cell nuclear extract and quantified the different products as shown . Which of the following graphs represents the expected result correctly ?
View SolutionDescribe the process of transcription of mRNA in an Eukaryotic cell.
View SolutionAfter transcription , which of the following is added to the 3' end of the eukaryotic mRNA ?
View SolutionExplain how does the RNA becomes the mRNA. OR Explain the process of splicing, capping and tailing which occur during transcription in Eukaryotes.
View SolutionCapping of mRNA occurs using …………………..
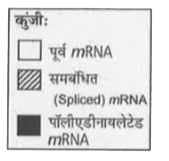
View Solutionएक वैज्ञानिक एक इन विट्रो यूकैरियोटिक अनुलेखन तंत्र का अध्ययन कर रहा था, जिससे आच्छादित और अनाच्छादित दोनों mRNAs उत्पन्न हुए। एक प्रयोग के लिये, उन्होंने इन mRNAs को स्तनी कोशिका के केन्द्रकीय निष्कर्ष के साथ इनक्यूबेट किया और उत्पादों की मात्रा निम्नानुसार दर्शाई। निम्न में से कौन-सा ग्राफ संभावित परिणाम को सही रूप से दर्शाता है?
View Solutionইউক্যারিওটিক কোশে mRNA সংশ্লেষের সময় কীভাবে ‘ক্যাপ’ গঠিত হয় ?
View Solutionट्रांसक्रिप्शन की शुरूआत में RNA पॉलिमरेज mRNA के किस विशिष्ट न्यूक्लियोटाइड क्रम से जुड़ता है
View SolutionDuring transcription, the synthesizing mRNA grows in
View SolutionTranscription|Synthesis of mRNA#!#RNA Polymerase
View Solution

