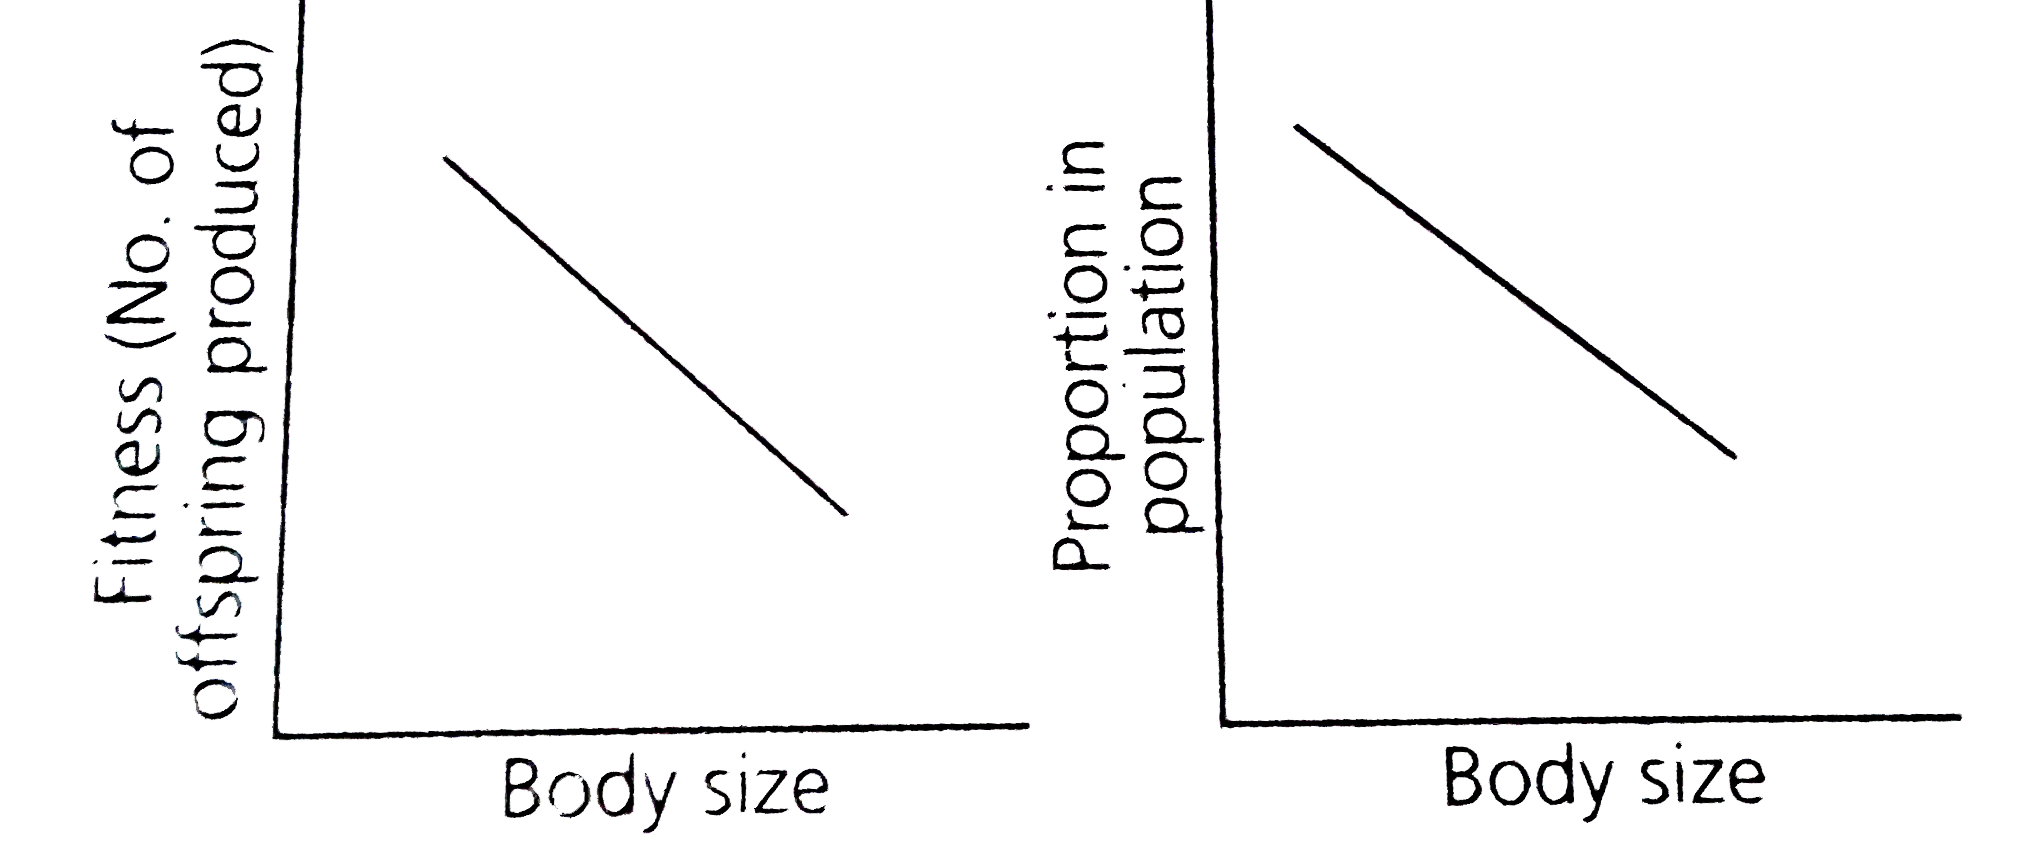
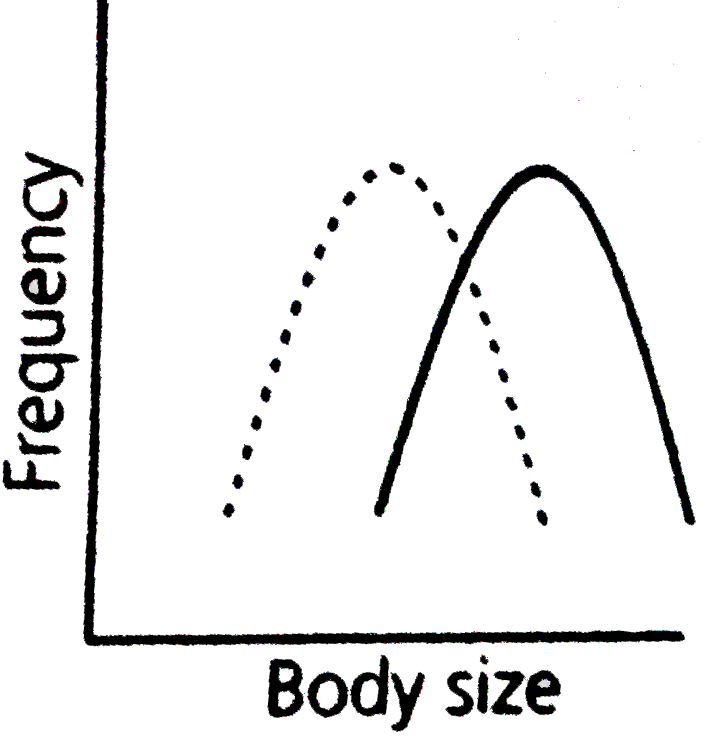
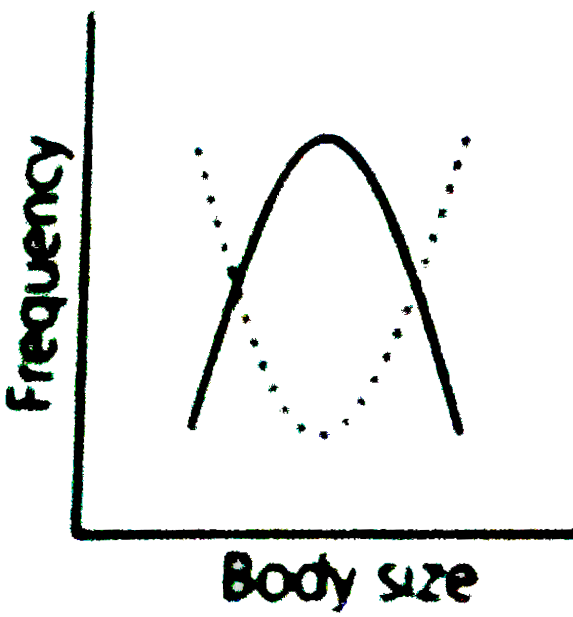
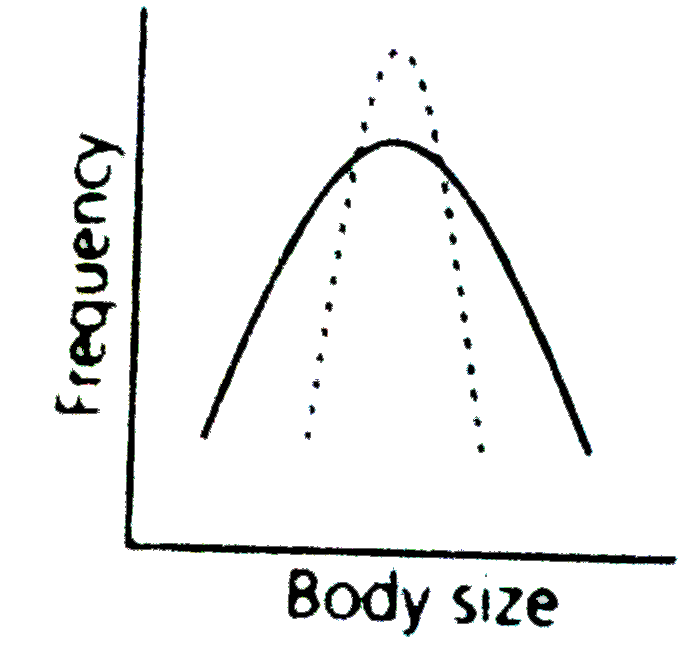
Study the charactristics of a population represented in the graphs below.
Mark the correct graph that represents the type of selection that this population is likely to undergo
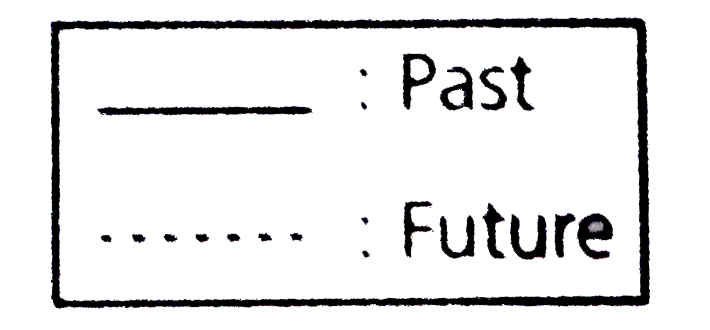
A
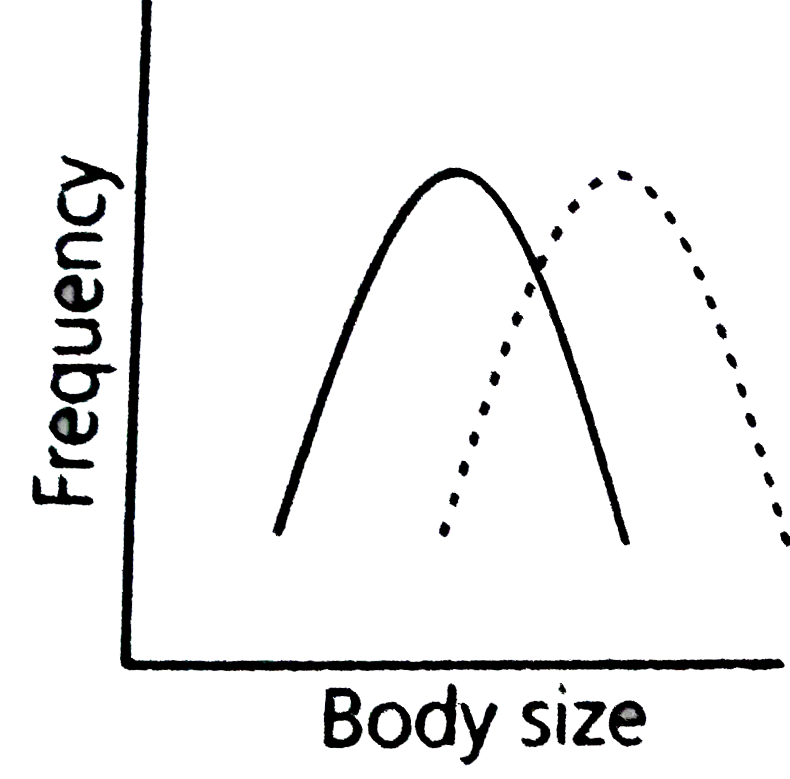
B
C
D
Video Solution
Text Solution
The correct Answer is:B
It is observed that the individuals with larger body size, in the given population, are lesser in prroportion as compared to individuals with smaller or moderate body size. Also. Large bodied individuals have low fitness, when natural slection acts on such a population, it would favour smaller or moderate sized individuals, hence shifting the body size vs. frequency graph to the left.
|
Topper's Solved these Questions
Similar Questions
Knowledge Check
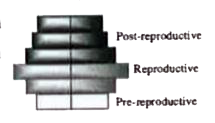
The age structures of a population represents
Arelative number of individuals at each ageBnumber of new borns each yearCnumber of individuals reaching puberty each yearDrelative number of deaths at each age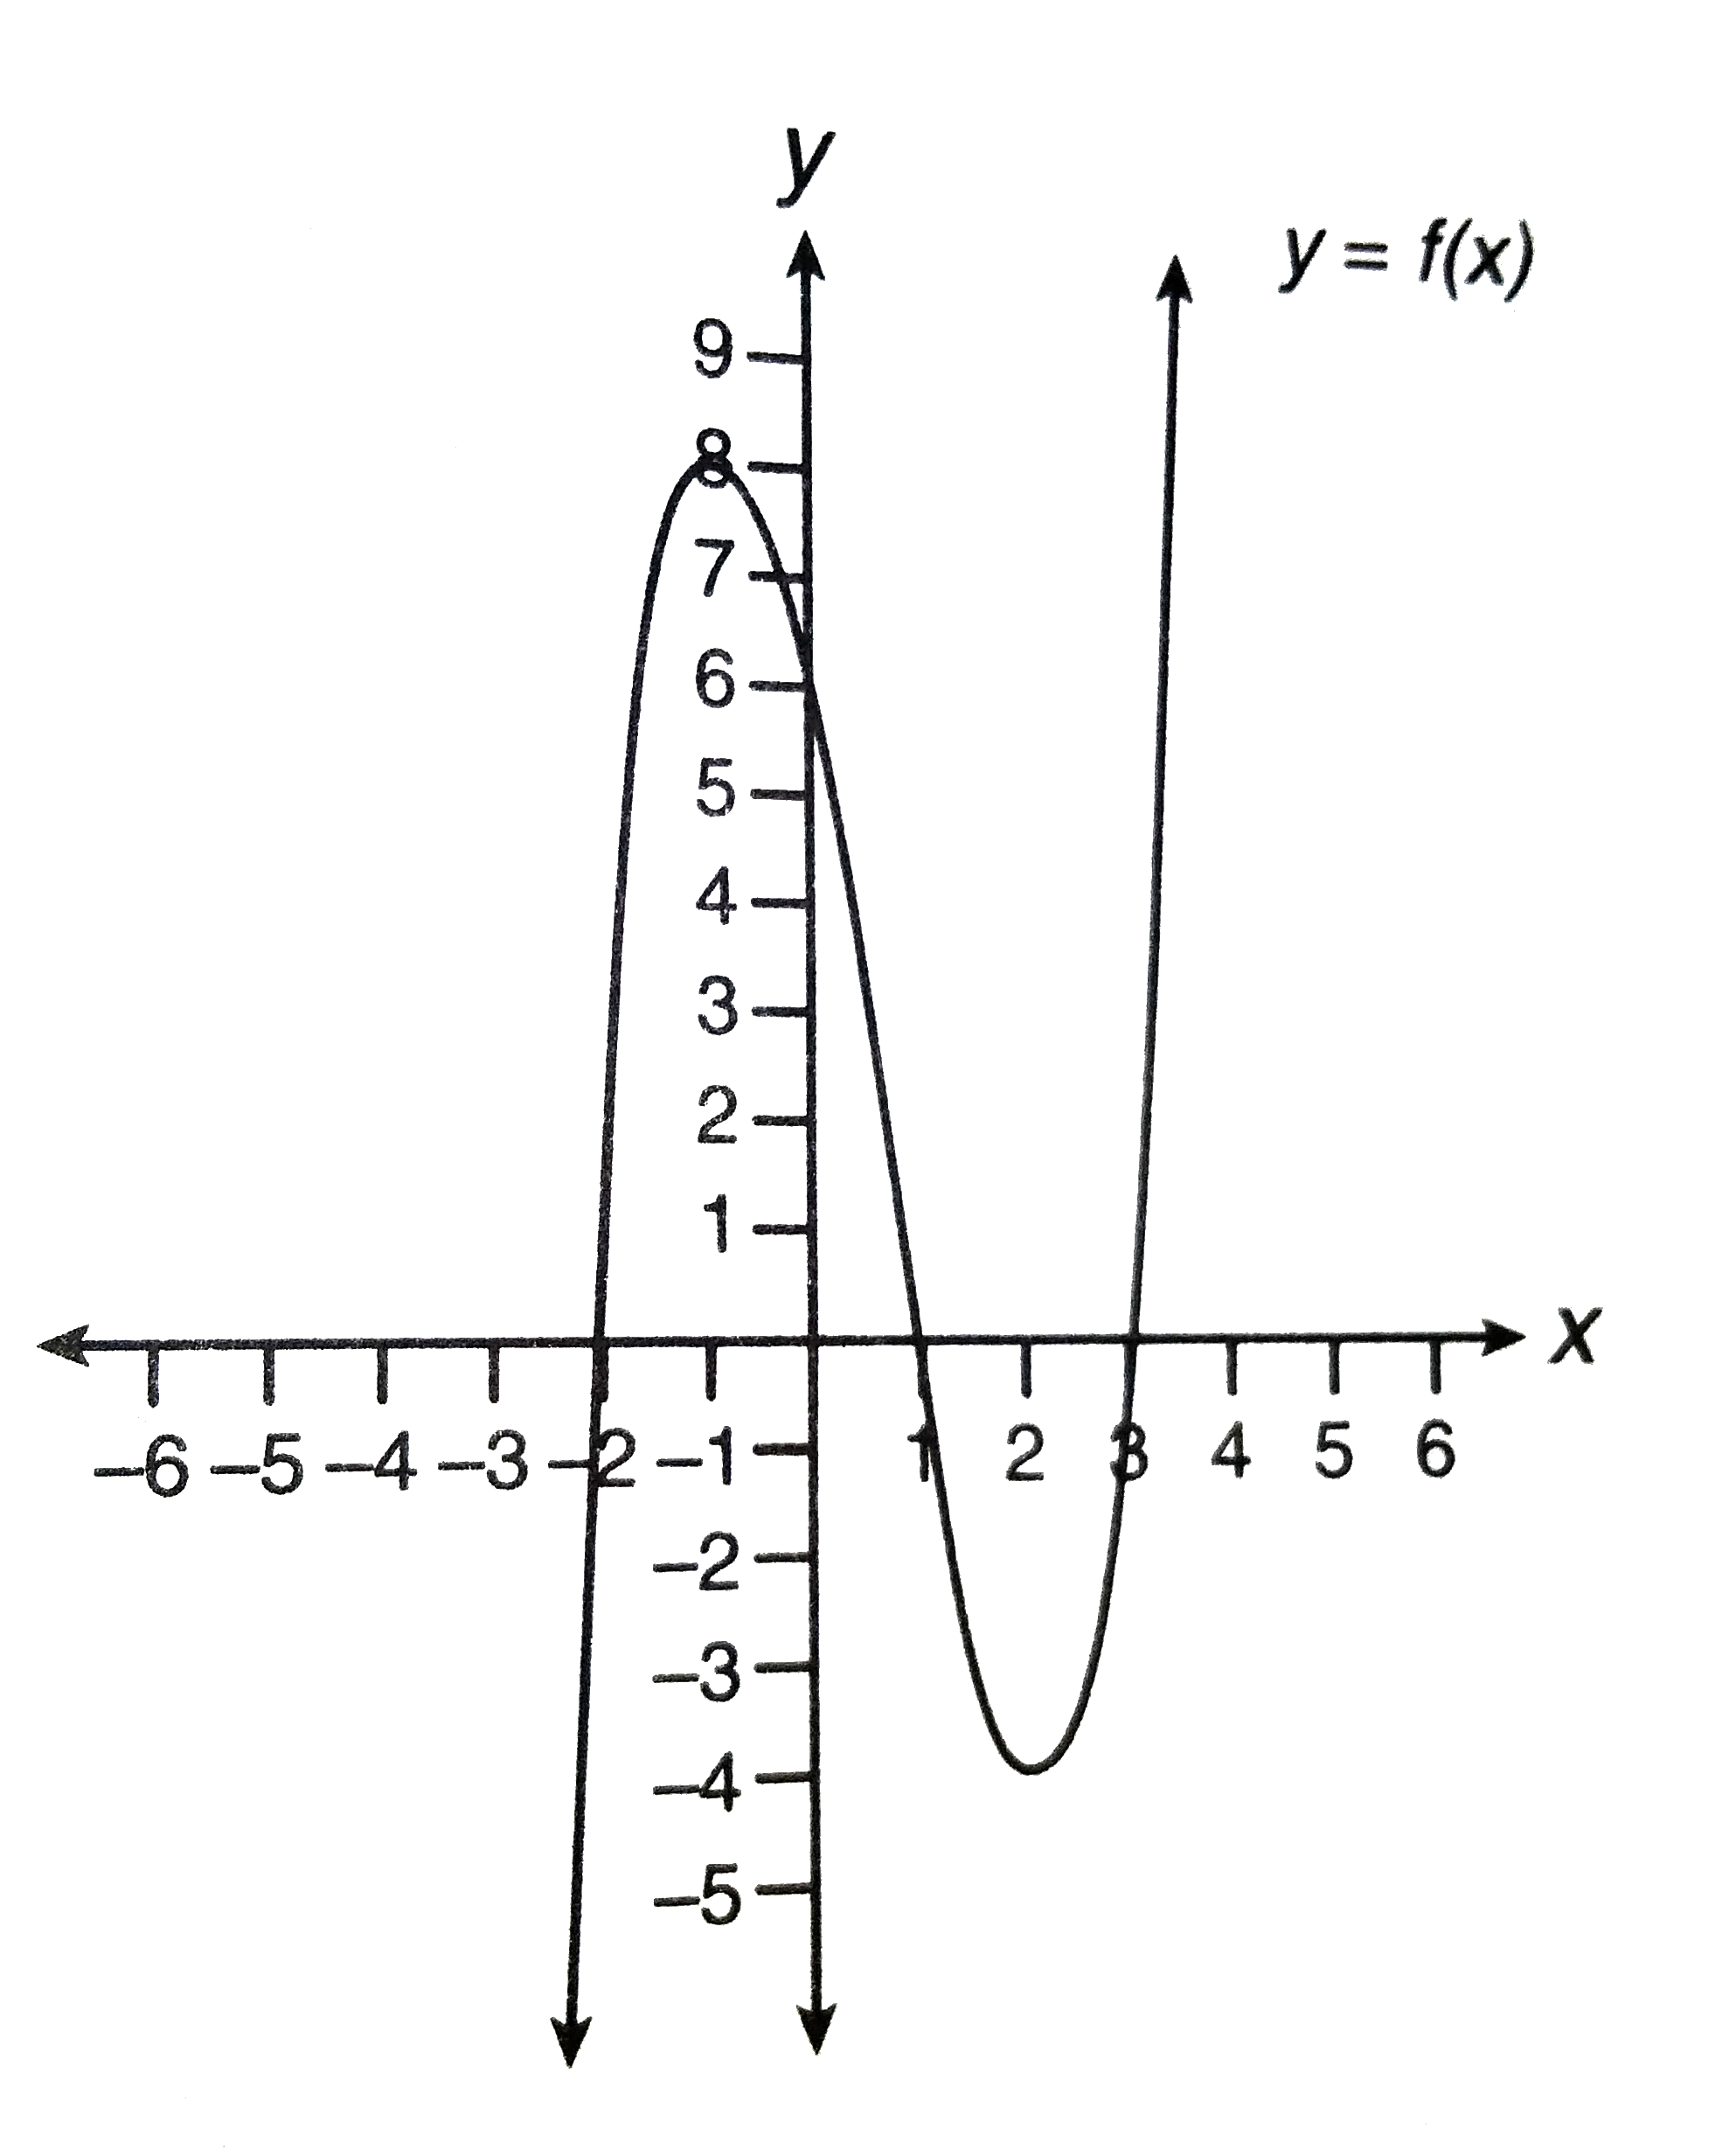
Which function could represents the graph above?Af(x)=(x−6)(x2−4x+3)Bf(x)=(x−3)(x2+x−2)Cf(x)=(x−1)(x2−5x−6)Df(x)=(x+2)(x2−4x−12)
An exothermic reaction is represented by the graph :
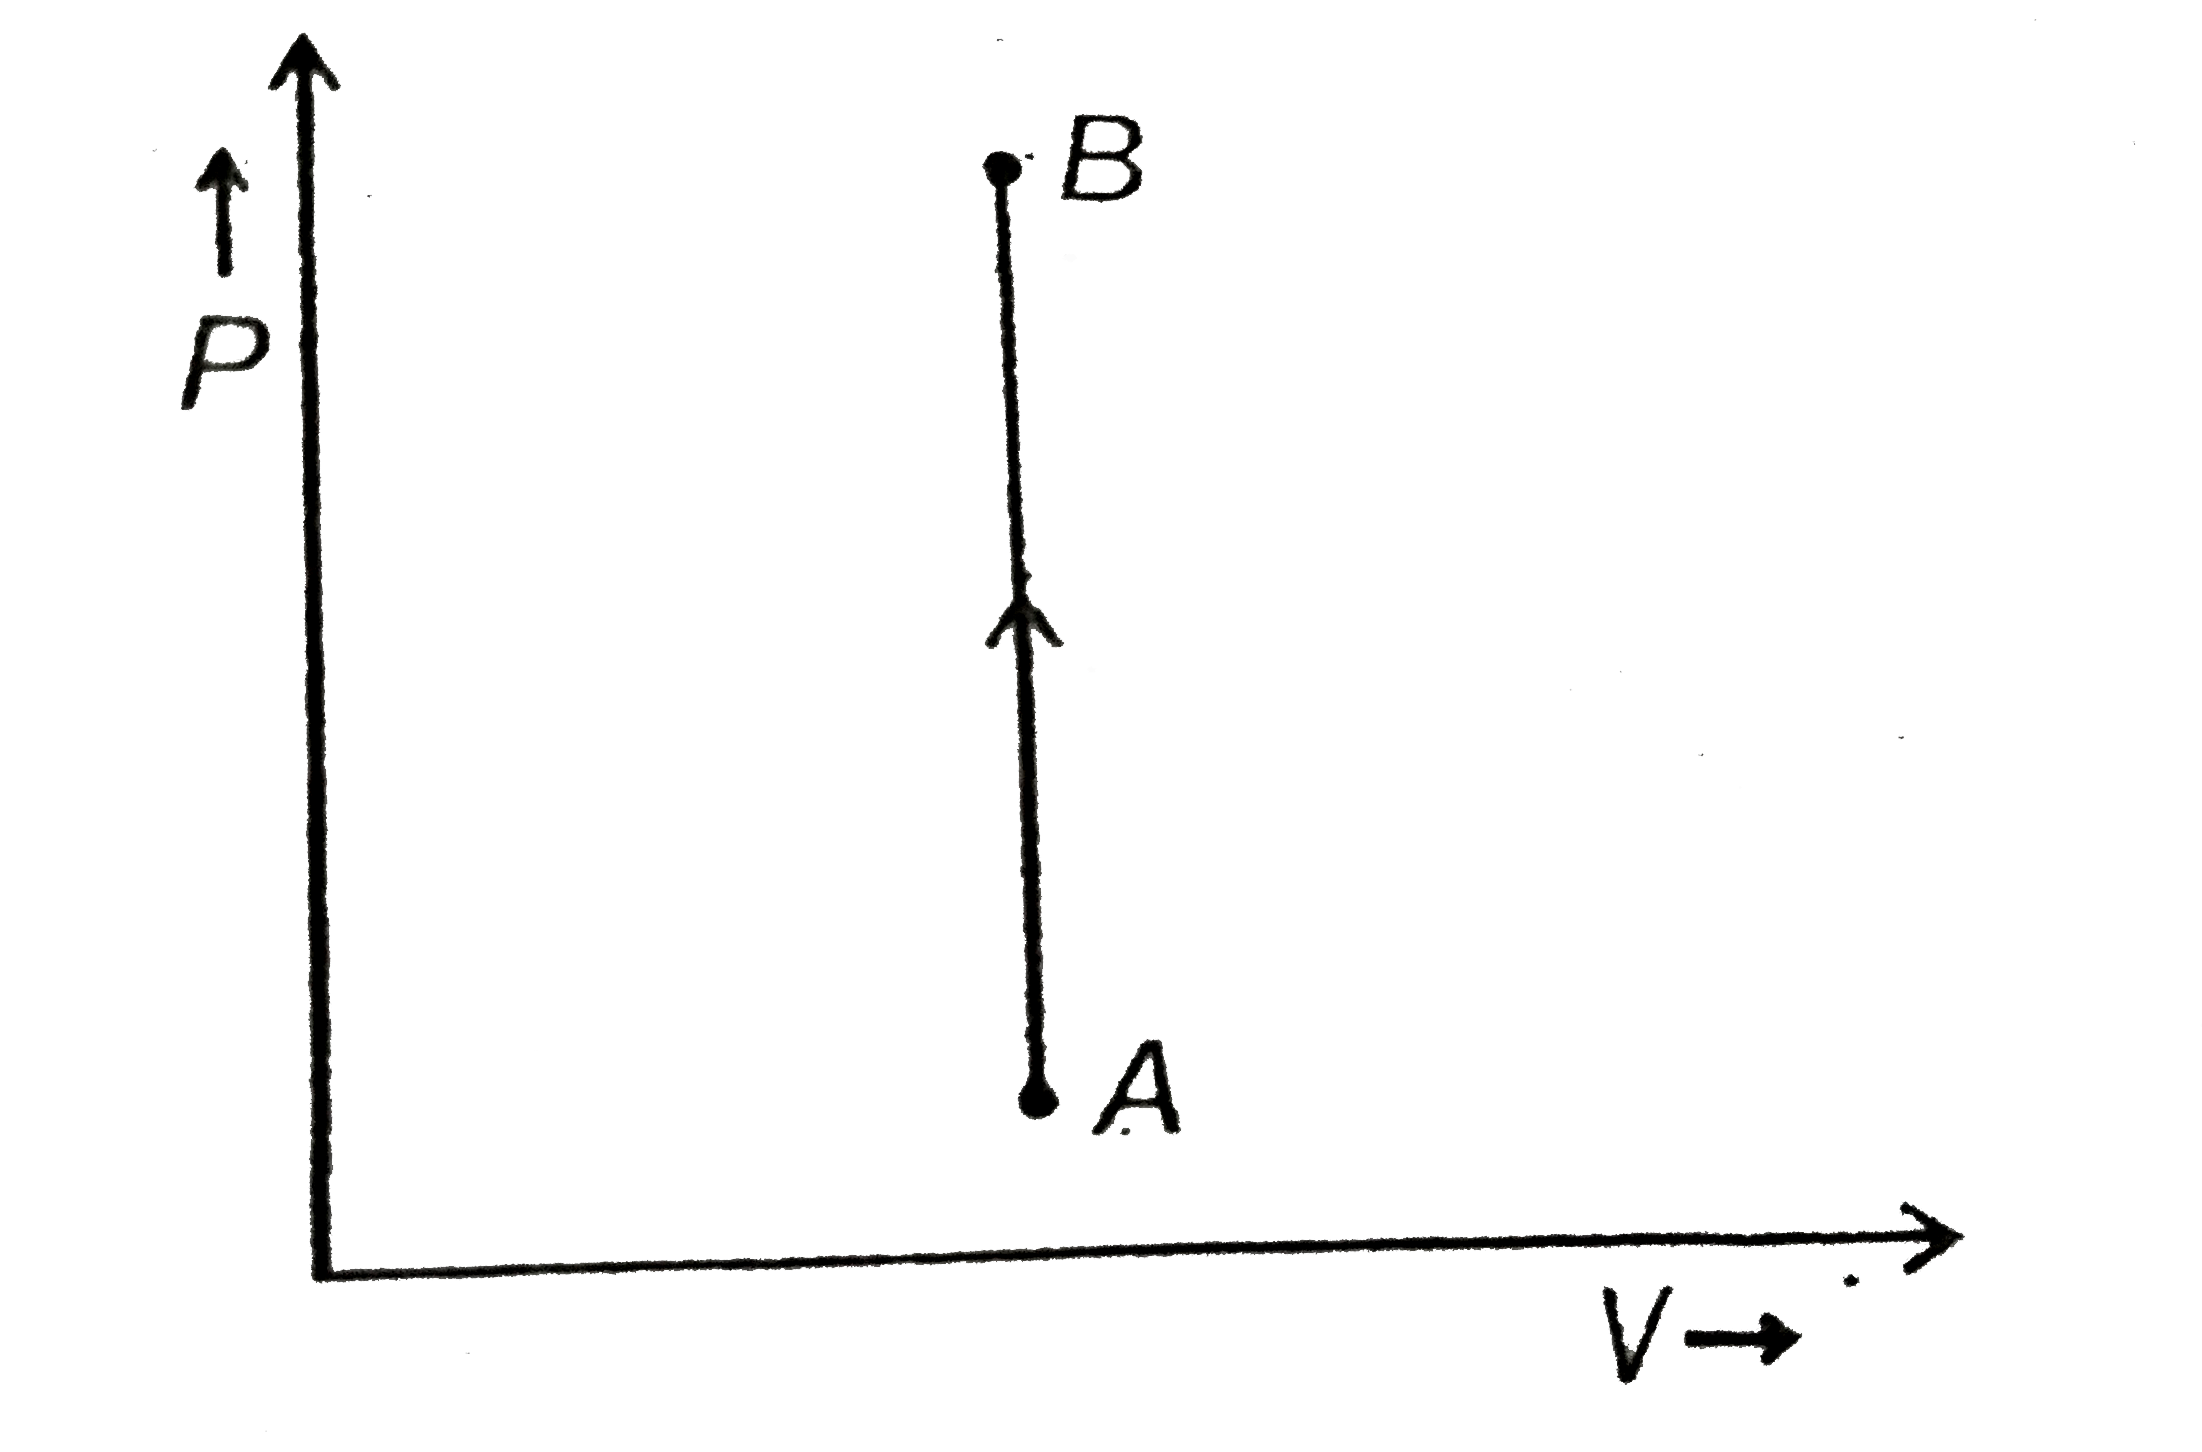
View SolutionThe following graph represents
View SolutionWhich graph represents positive acceleration ?
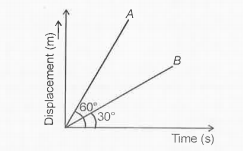
View SolutionThe ratio of velocities represented by lines A and B in the graph below is
View SolutionWhat type of human population is represented by the following age pyramid
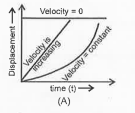
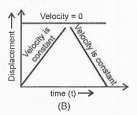
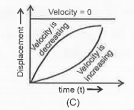
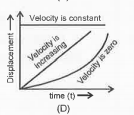
View SolutionSome characteristics of velocity on displacement-time graph are show on graphs below. Which graph correctly represents the characteristics :
View Solution


