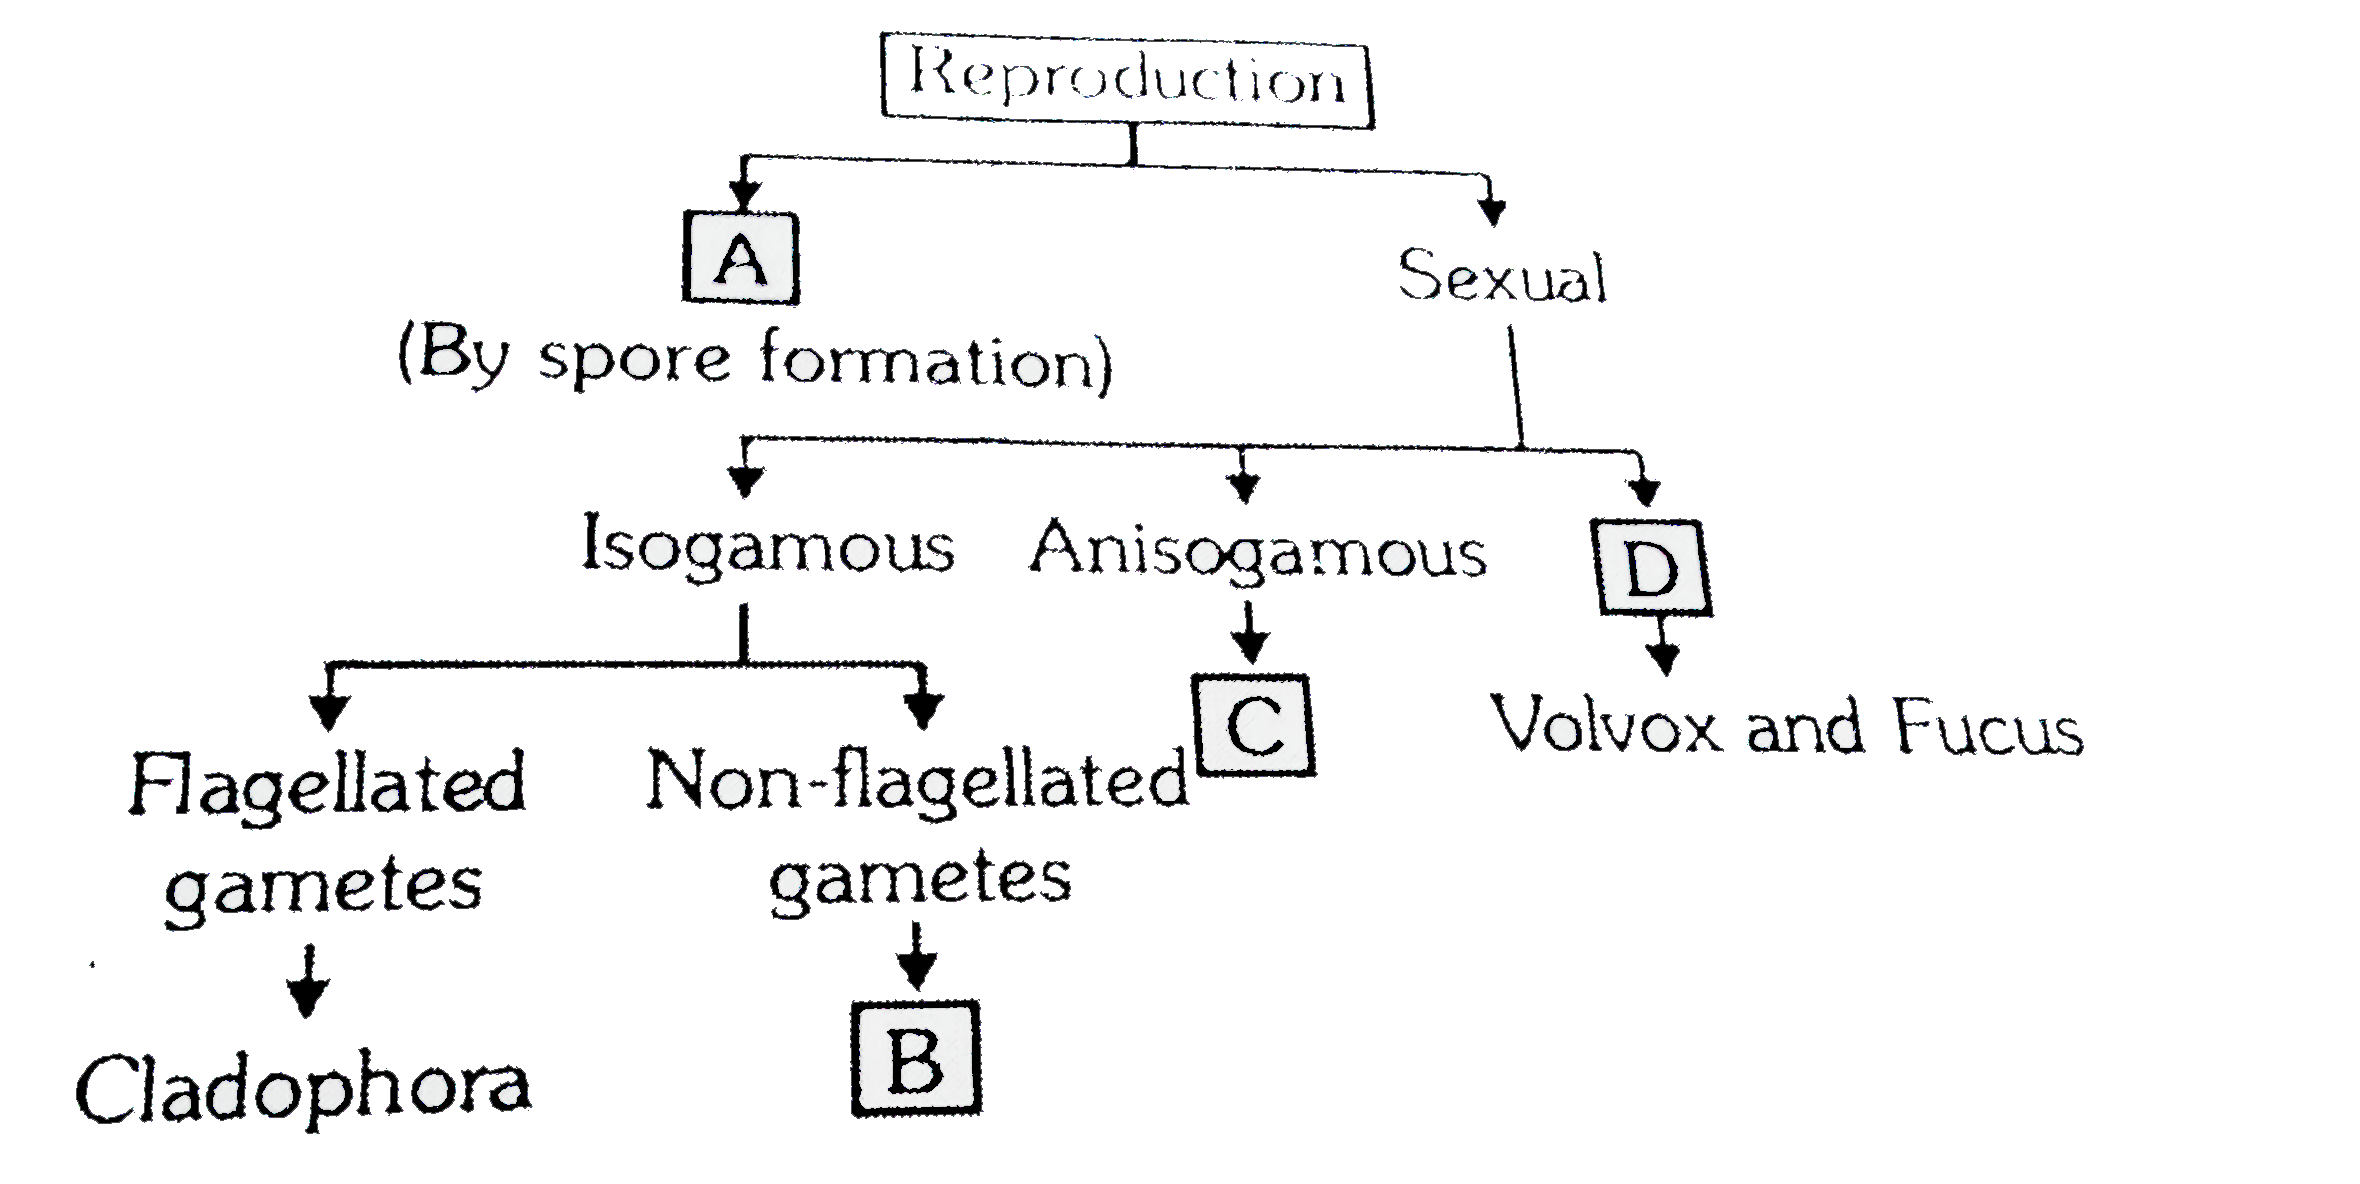
The density of a population in a given habitat during a period, fluctuates due to changes in certain basic processes. On this basis, identify A and B boxes in the given flow chart

A - Natality, B - Mortality
A - Immigration, B - Emigration
A - Natality, B- Immigration
Both (a) and (b)
The correct Answer is:D
Step by step video, text & image solution for The density of a population in a given habitat during a period, fluctuates due to changes in certain basic processes. On this basis, identify A and B boxes in the given flow chart by Biology experts to help you in doubts & scoring excellent marks in Class 12 exams.
Updated on:21/07/2023Topper's Solved these Questions
- ORGANISMS AND POPULATIONBook:NCERT FINGERTPS ENGLISHChapter:ORGANISMS AND POPULATIONExercise:Organisms And Population
Explore 175 Videos
- PRINCIPLES OF INHERITANCE & VARIATIONBook:NCERT FINGERTPS ENGLISHChapter:PRINCIPLES OF INHERITANCE & VARIATIONExercise:Principles Of Inheritance & Variation
Explore 167 Videos
Similar Questions
Knowledge Check
The density of a population in a given habit during a given period, fluctuates due to changes in certain basic processes. On this basis, fill up boxes A and B in the given flow chart with correct option.
 AA− Natality, B− MortalityBA− Immigration, B−EmigrationCA−Natality, B−ImmigrationDBoth (a) and (b)
Identify A,B,C and D in the given flow chart and slect the correct option.
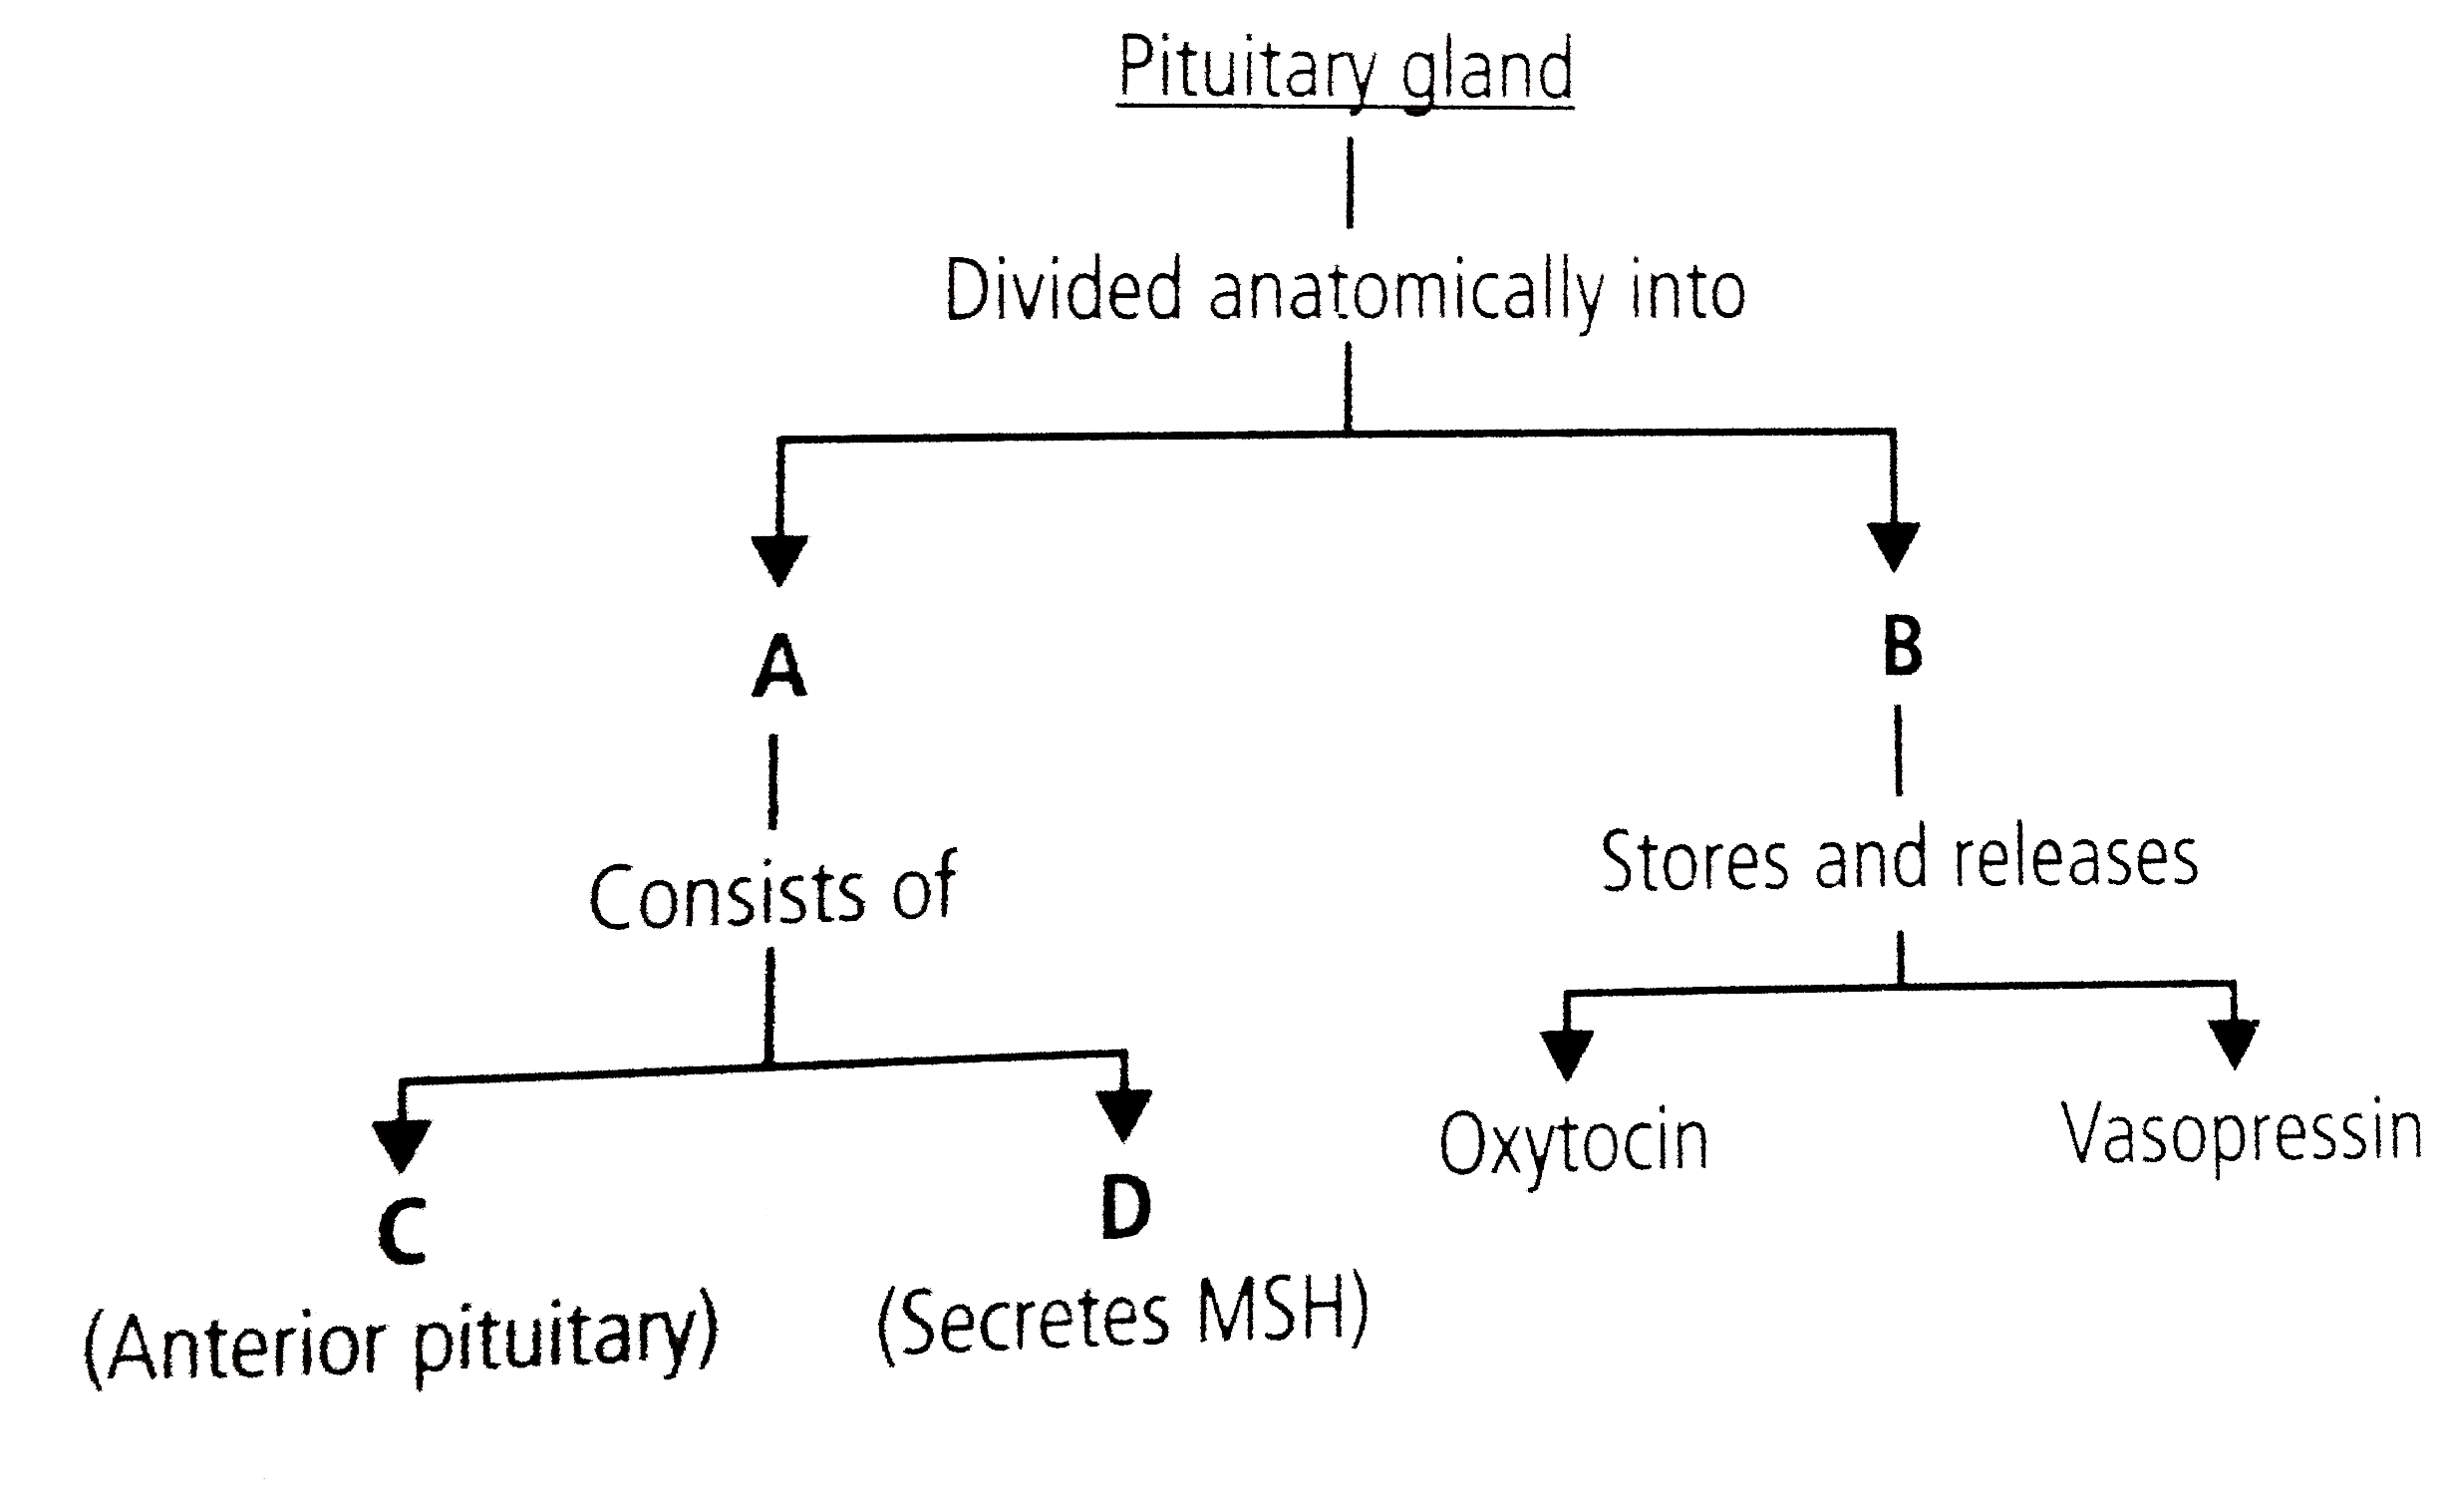 AABCDNeurohypophysisAdenohypophysisParsdistalisPars intermediaBABCDAdeno-hypophysisNeurohypophysisPars intermediaPars distailsCABCDAdenohypophysisNeuro-hypophysisParsdistailsPars intermediaDABCDNeuro-hypophysisAdeno-hypophysisPars intermediaPars distails
The given figure illustrates the changes in lung volume during the process of breathing.
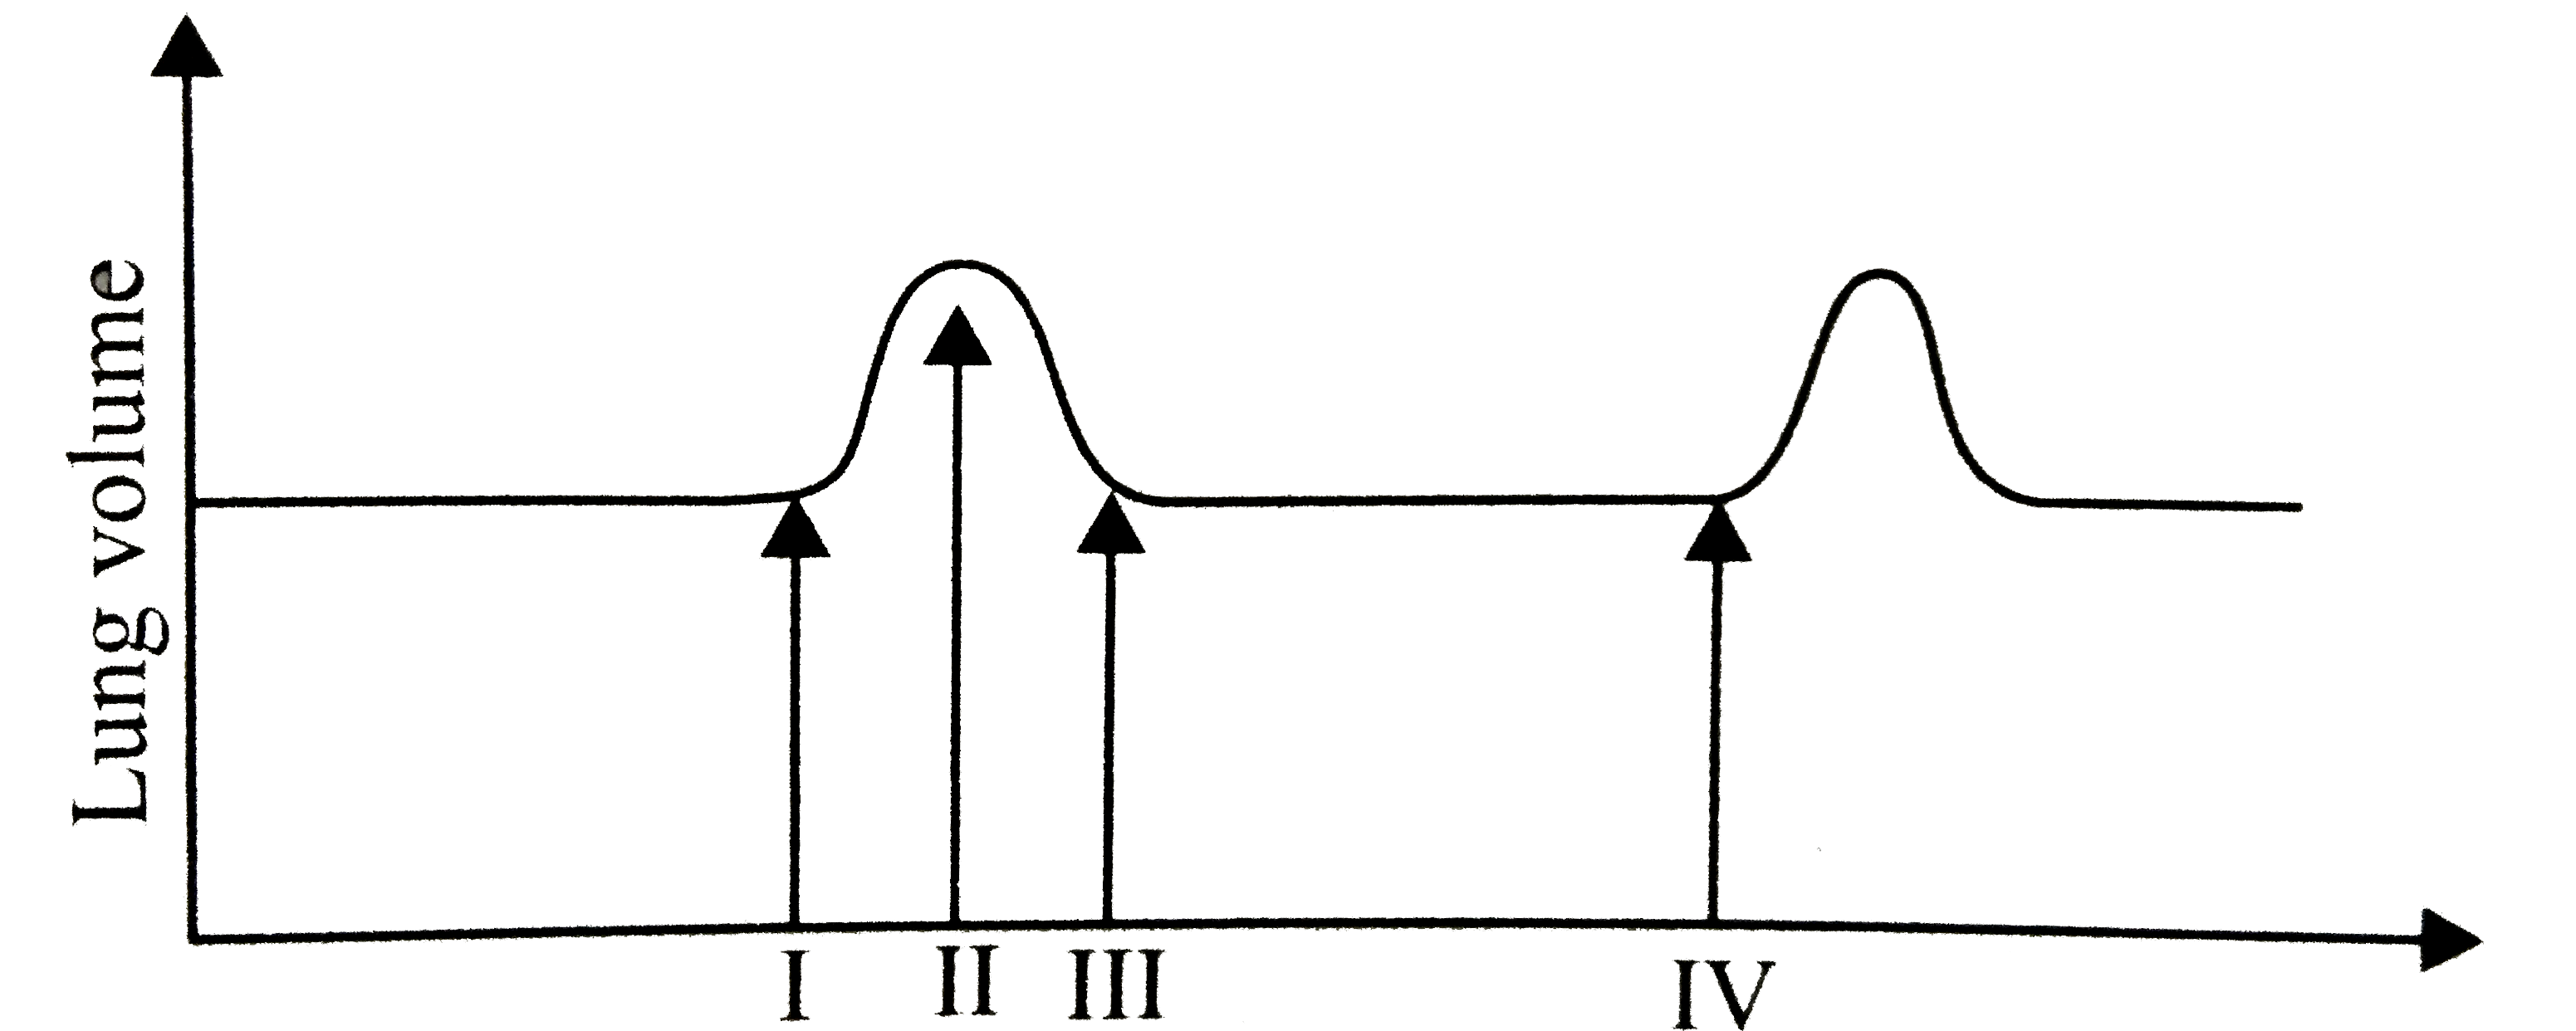
The changes from II to III indicates theAmovement of diaphragm away from the lungsBexpansion of the thoracic cavityCmovement of air out of the lungsDexpansion of ribs.
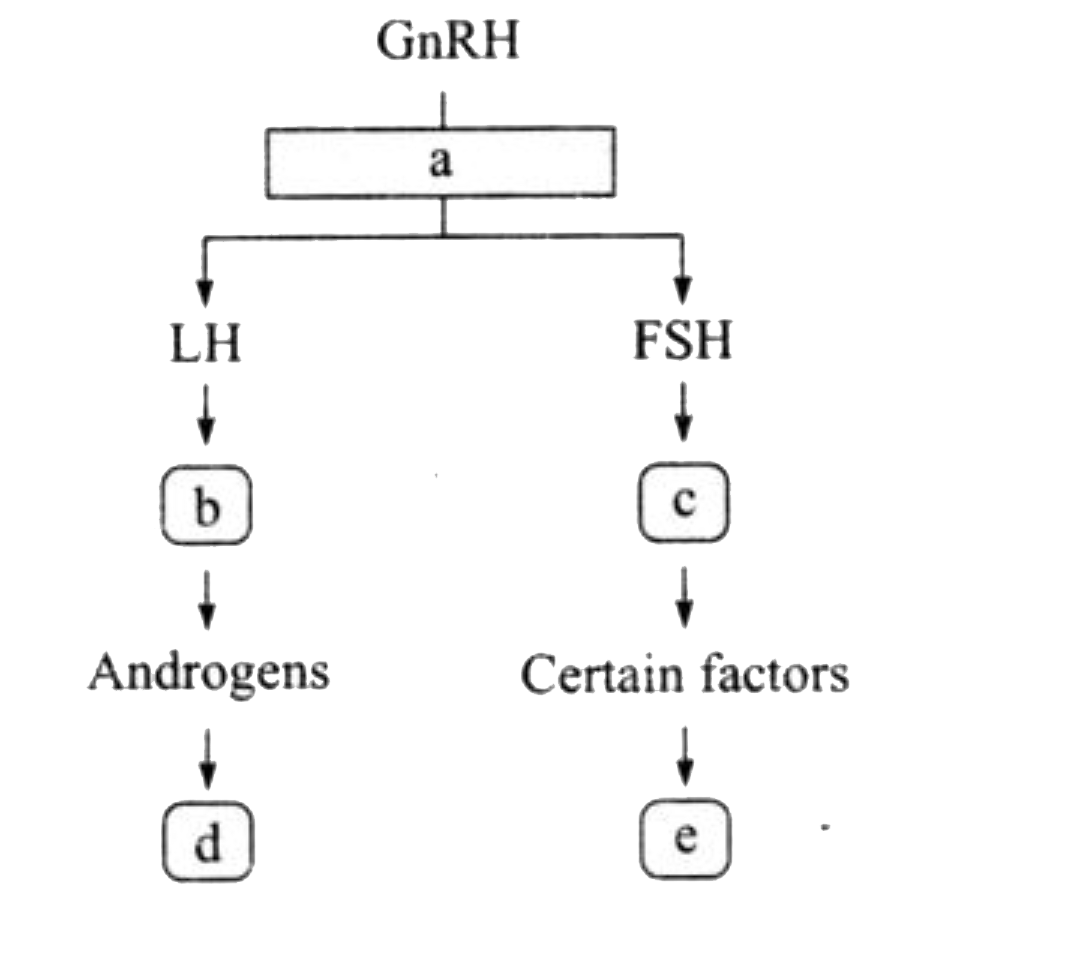
Identify the hormones a, b and c that are labelled in the given flow chart
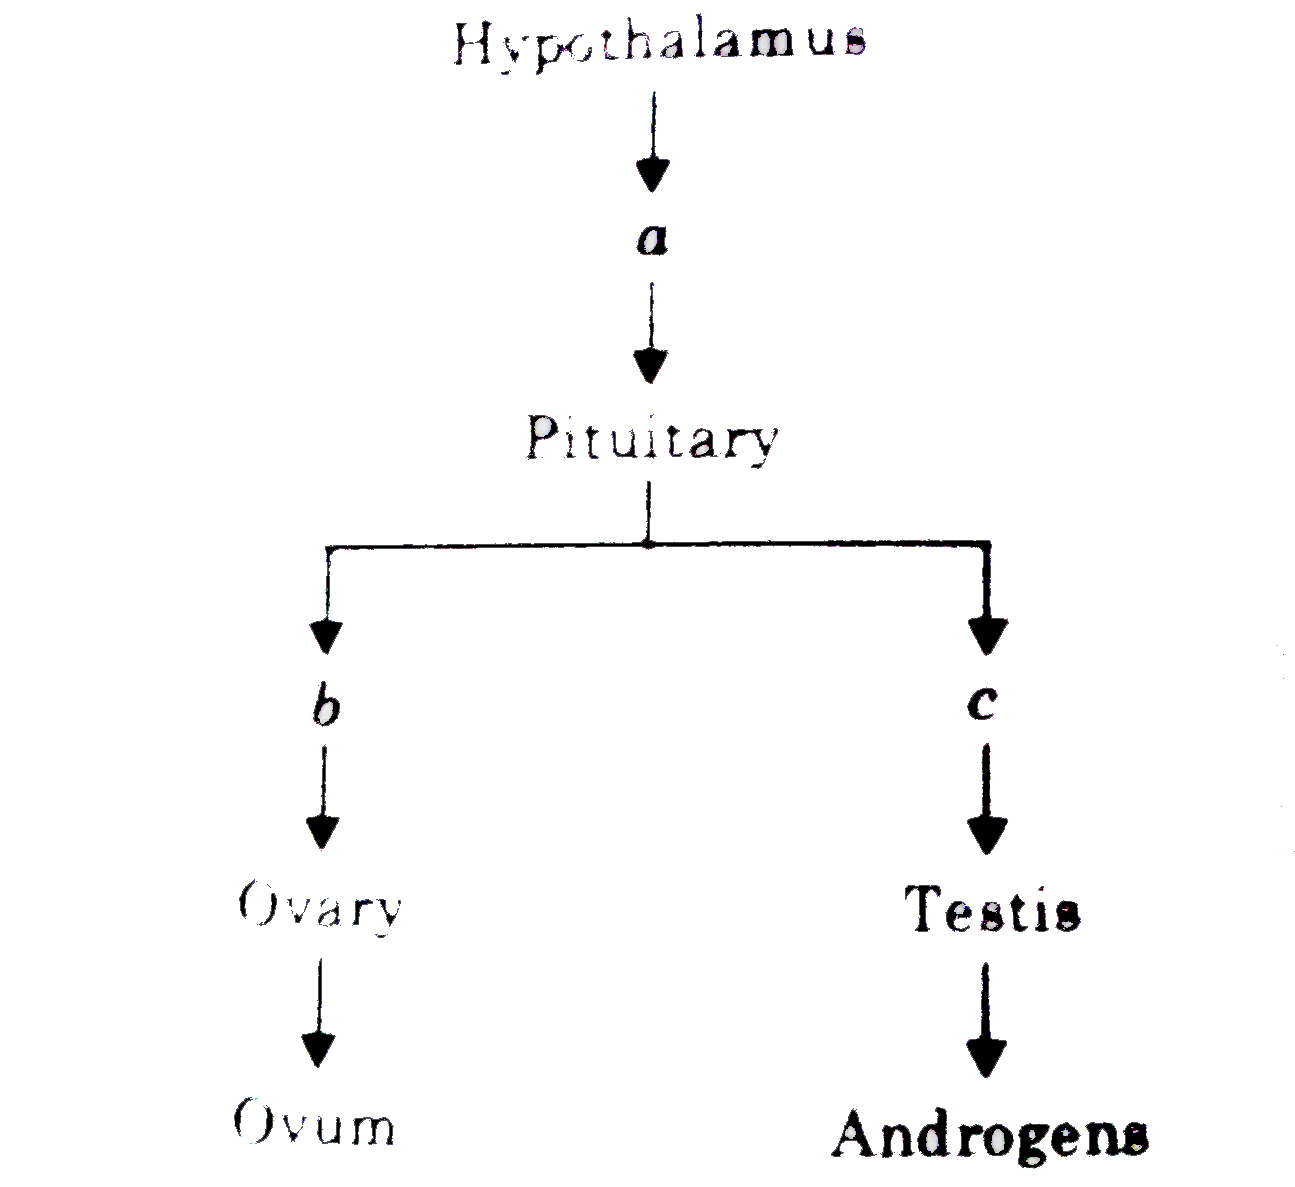
View SolutionWhich factors would necessarily decrease the density of a population in a given habitat ?
View SolutionGiven below is the flow chart showing the process of somatic hybridisation. Identify A,B,C,D and E.
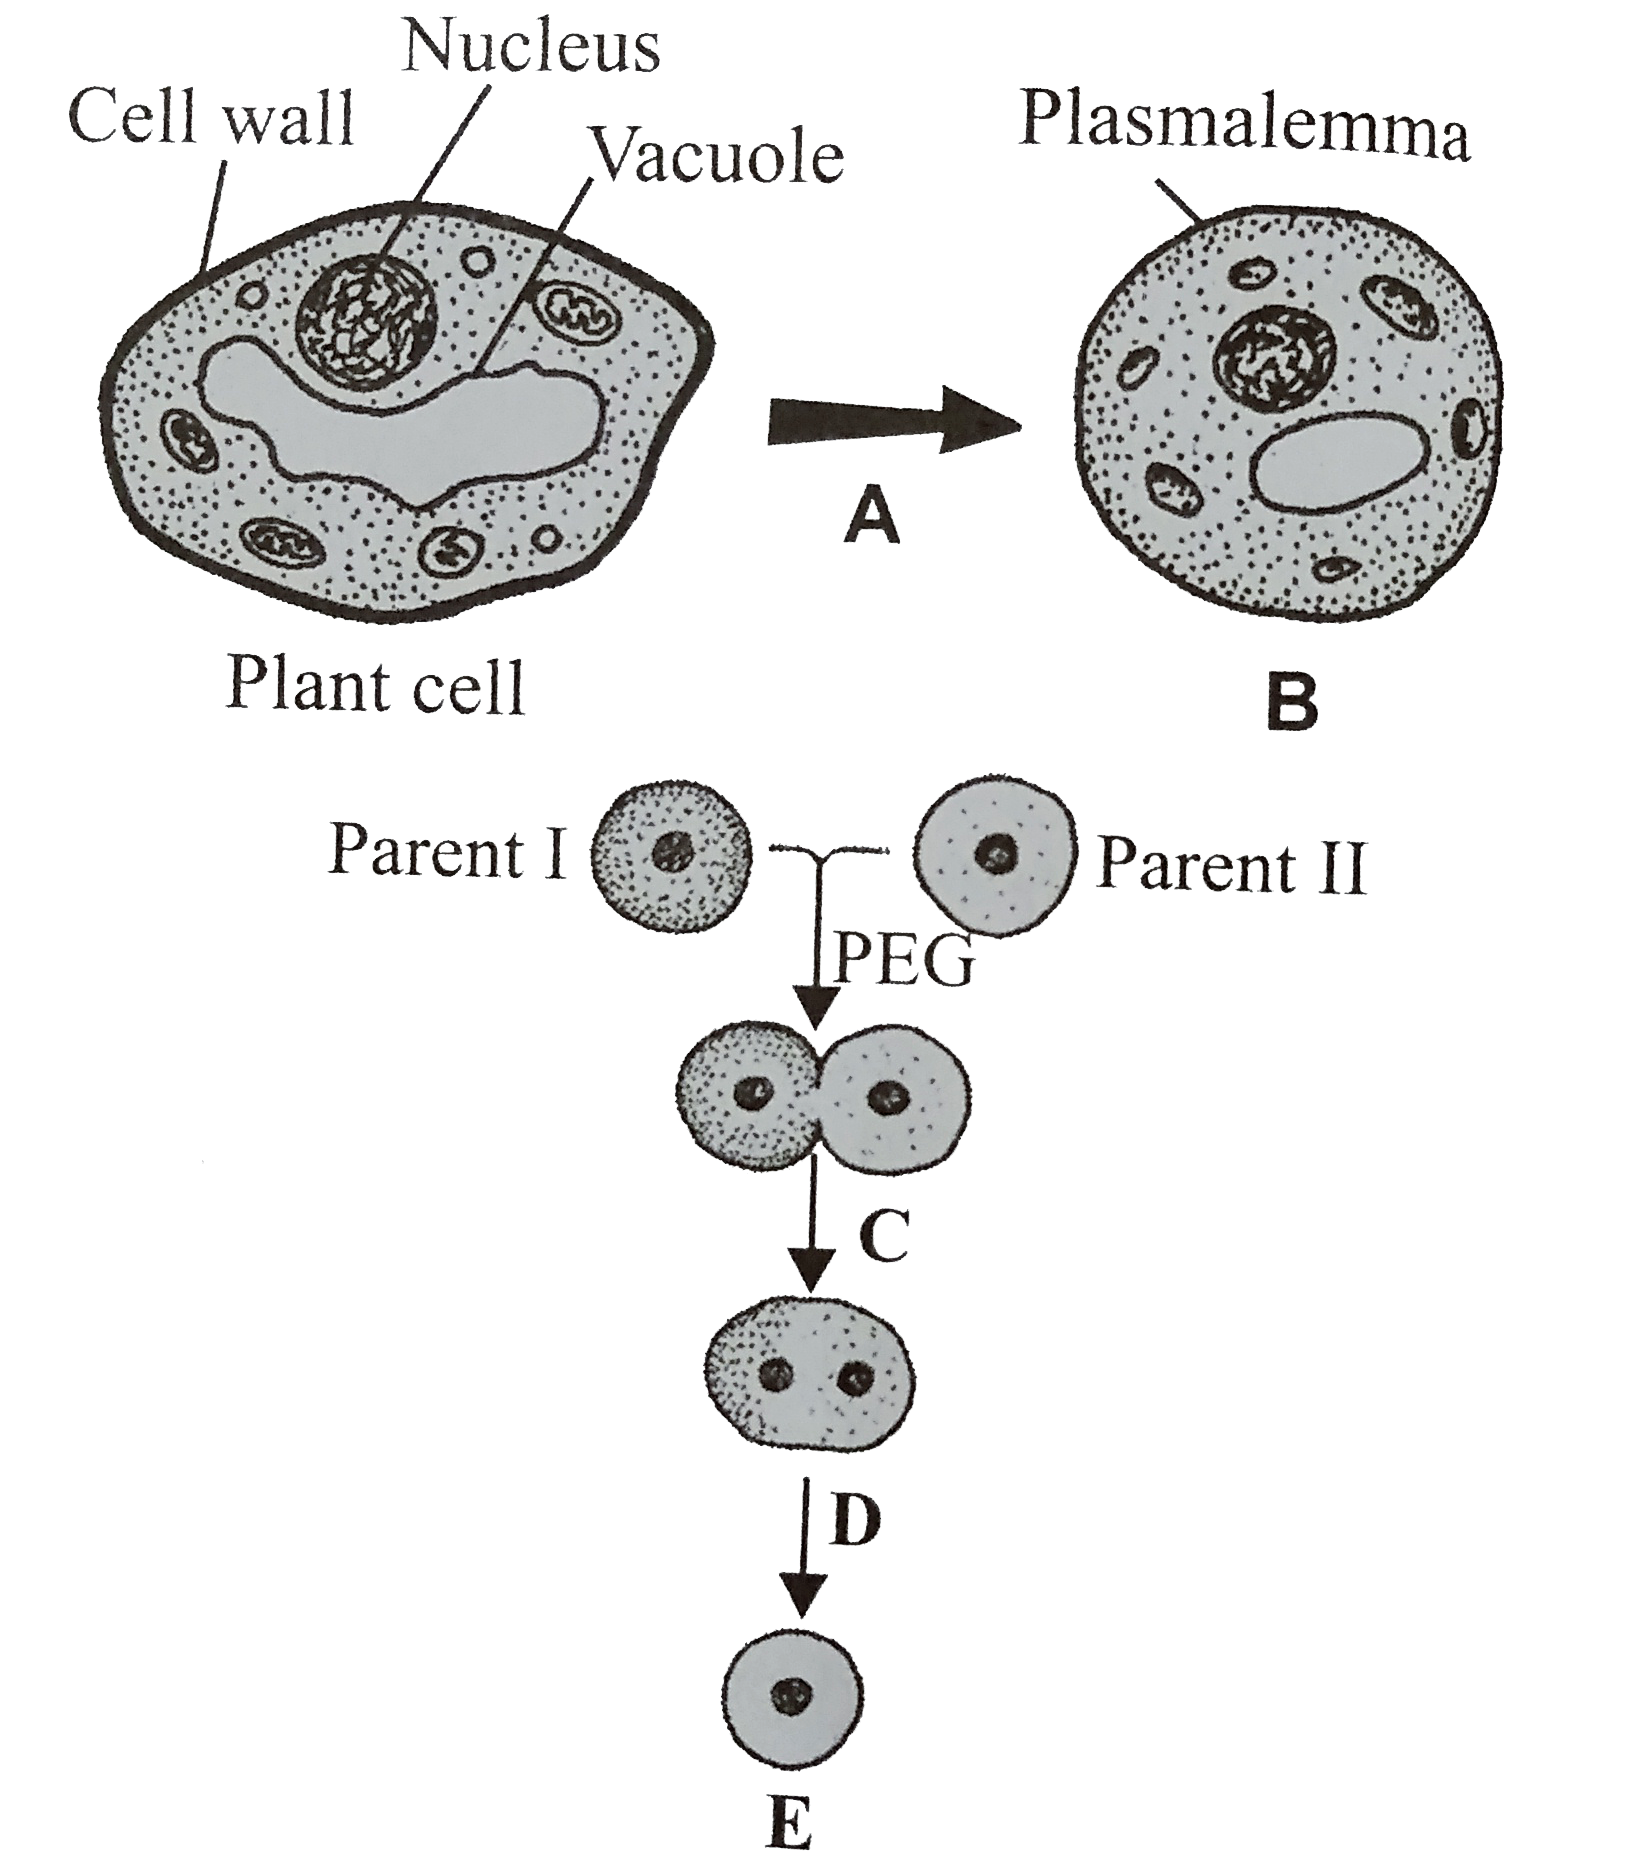
View SolutionIdentify, the beetie, fishes and ants on the basis of global species diversity given in the following pie chart
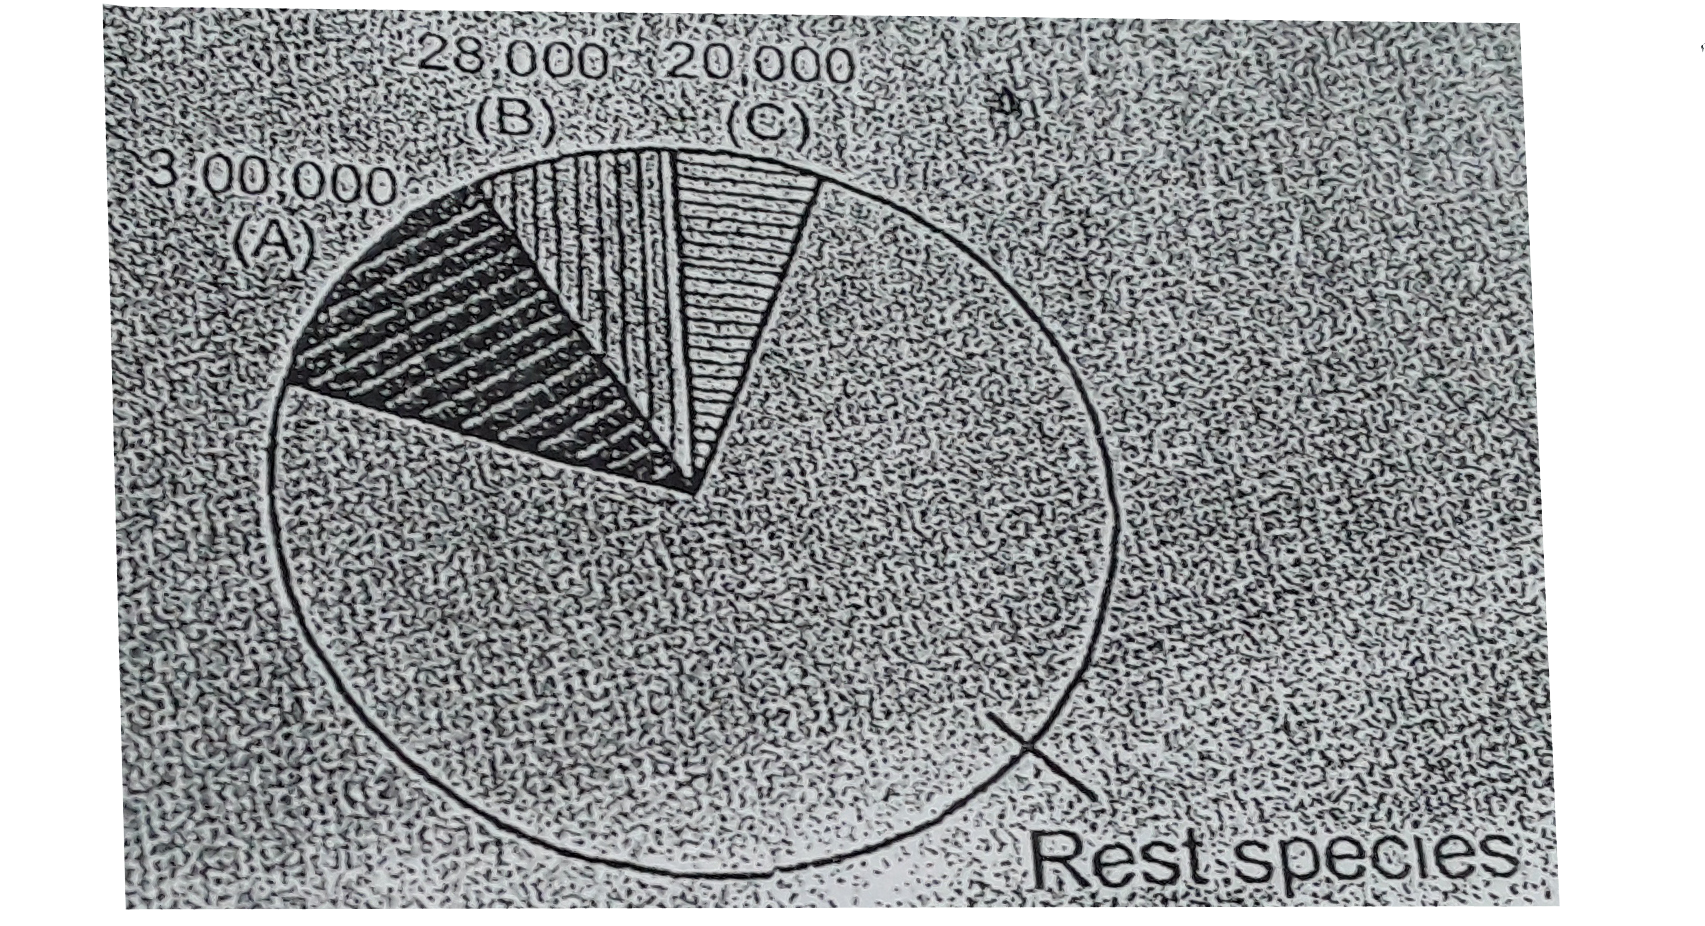
View SolutionP-V plots for two gases during an adiabatic process are given in the figure:
Plot A and plot B should correspond to :
View Solution


