The graph below shows the relationships of per capita population growth rate (r), fecundity (b) and age at first reproduction (α) in an animal speies
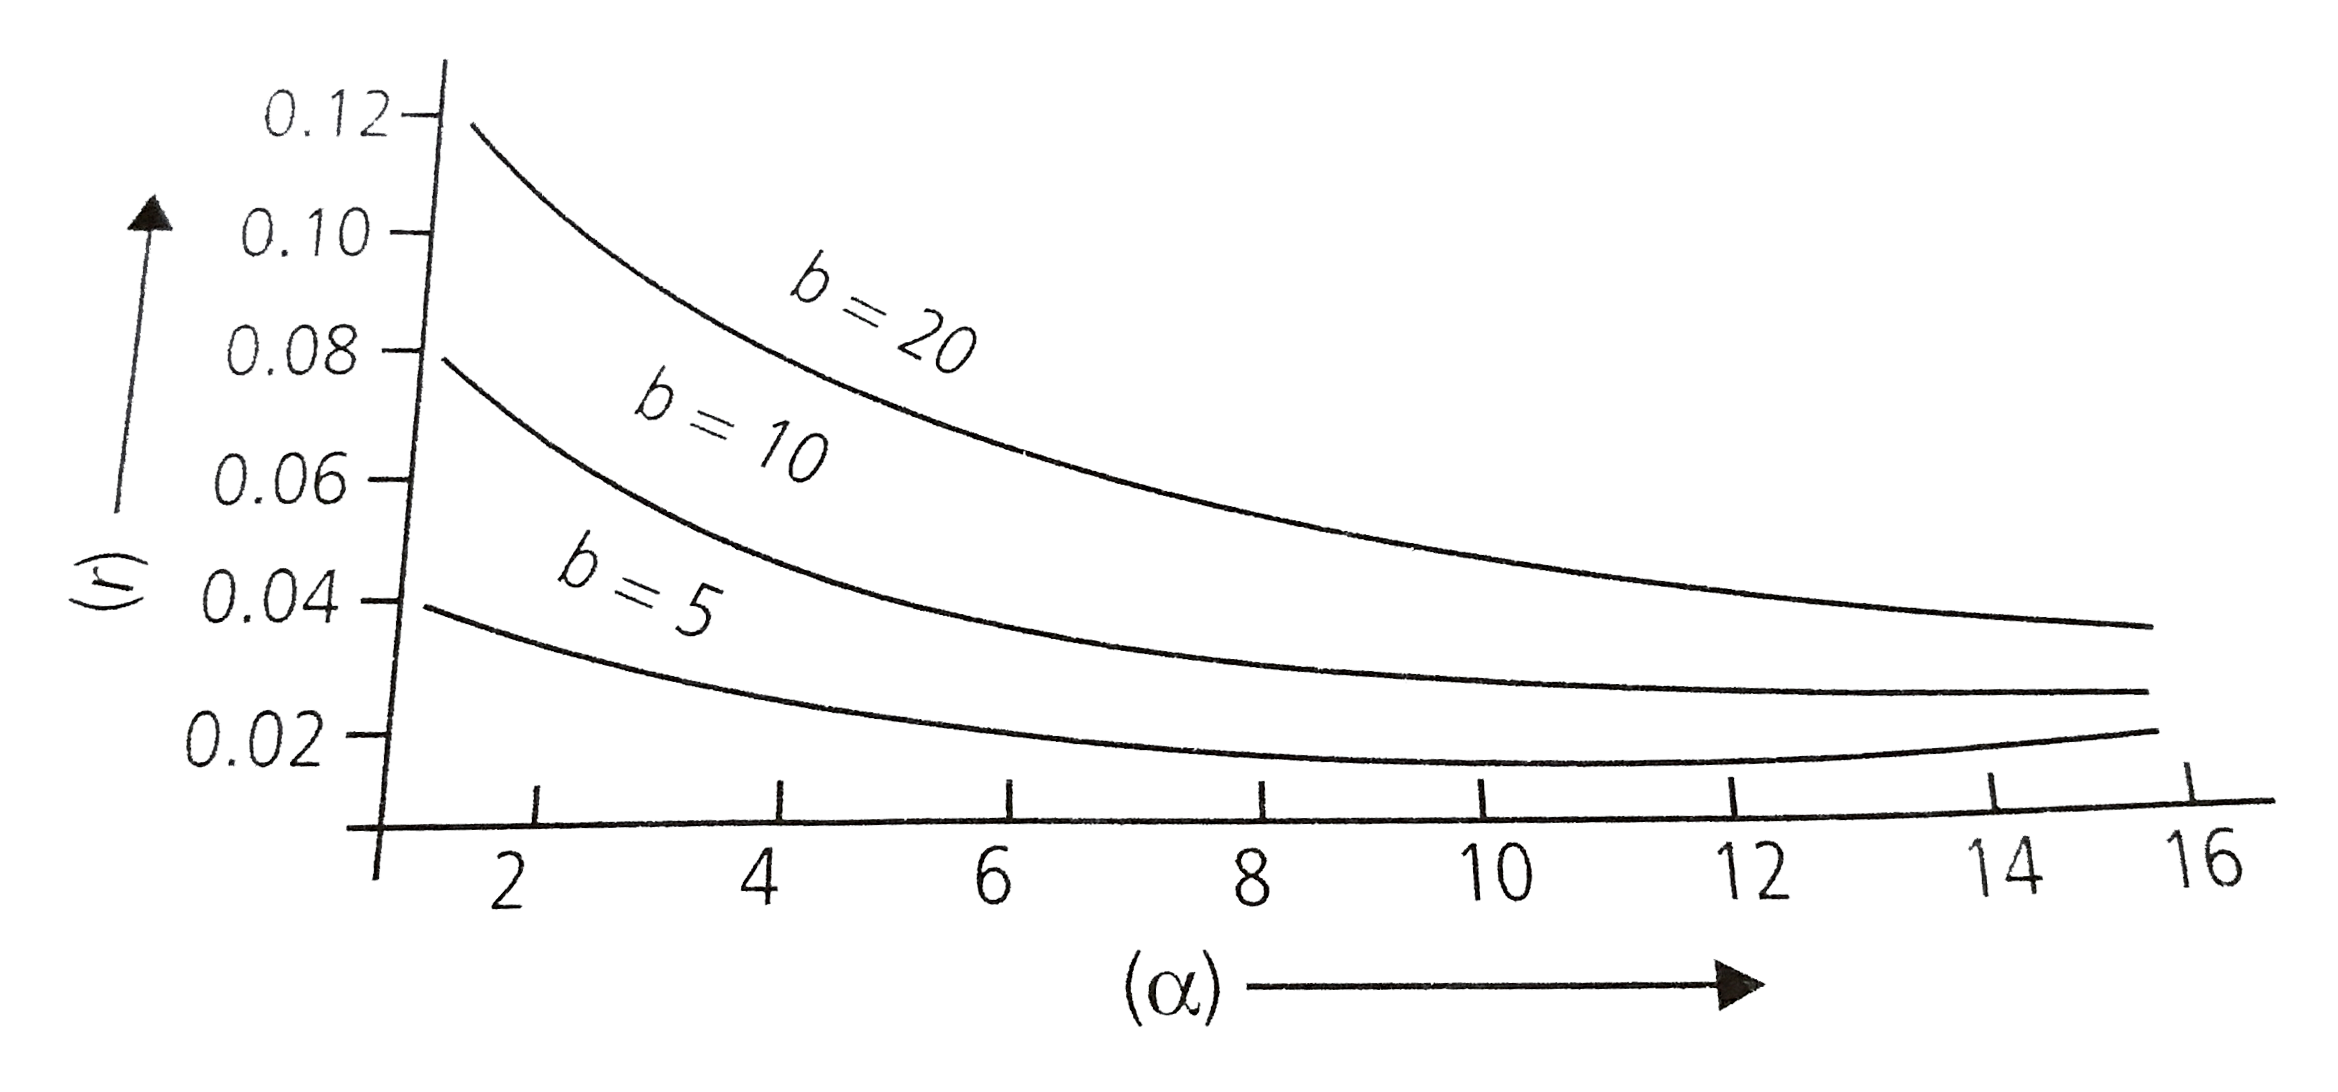
What is the most important conclusion to be drawn from the graph ?
The population growth rate decreases as first reproduction in postponed to a later stage, regardless of fecundity
At any α, the higher the fecundity the higher is the population growth rate achieved
As the age at first reproduction is postponed further, the benefits of increasing fecundity on the population growth rate become progressively negligible
None of these
The correct Answer is:A
Fecundity is the reproductive output, usually of an individual or number of offspring produced or the capacity of reproduction . In the given curve, the population growth rate decreases as first reproduction is postponed to a later stage regardless of fecundity.
Topper's Solved these Questions
- BOOK - NCERT FINGERTPS ENGLISHCHAPTER - REPRODUCTIVE HEALTHEXERCISE - EXEMPLAR13videos
REPRODUCTIVE HEALTH
- BOOK - NCERT FINGERTPS ENGLISHCHAPTER - REPRODUCTIVE HEALTHEXERCISE - ASSERTION-REASON15videos
REPRODUCTIVE HEALTH
- BOOK - NCERT FINGERTPS ENGLISHCHAPTER - REPRODUCTIVE HEALTHEXERCISE - Reproductive Health133videos
REPRODUCTIVE HEALTH
- BOOK - NCERT FINGERTPS ENGLISHCHAPTER - REPRODUCTION IN ORGANISMEXERCISE - All Questions137videos
REPRODUCTION IN ORGANISM
- BOOK - NCERT FINGERTPS ENGLISHCHAPTER - SEXUAL REPRODUCTION IN FLOWERING PLANTSEXERCISE - Sexual Reproduction In Flowering Plants145videos
SEXUAL REPRODUCTION IN FLOWERING PLANTS
Similar Questions
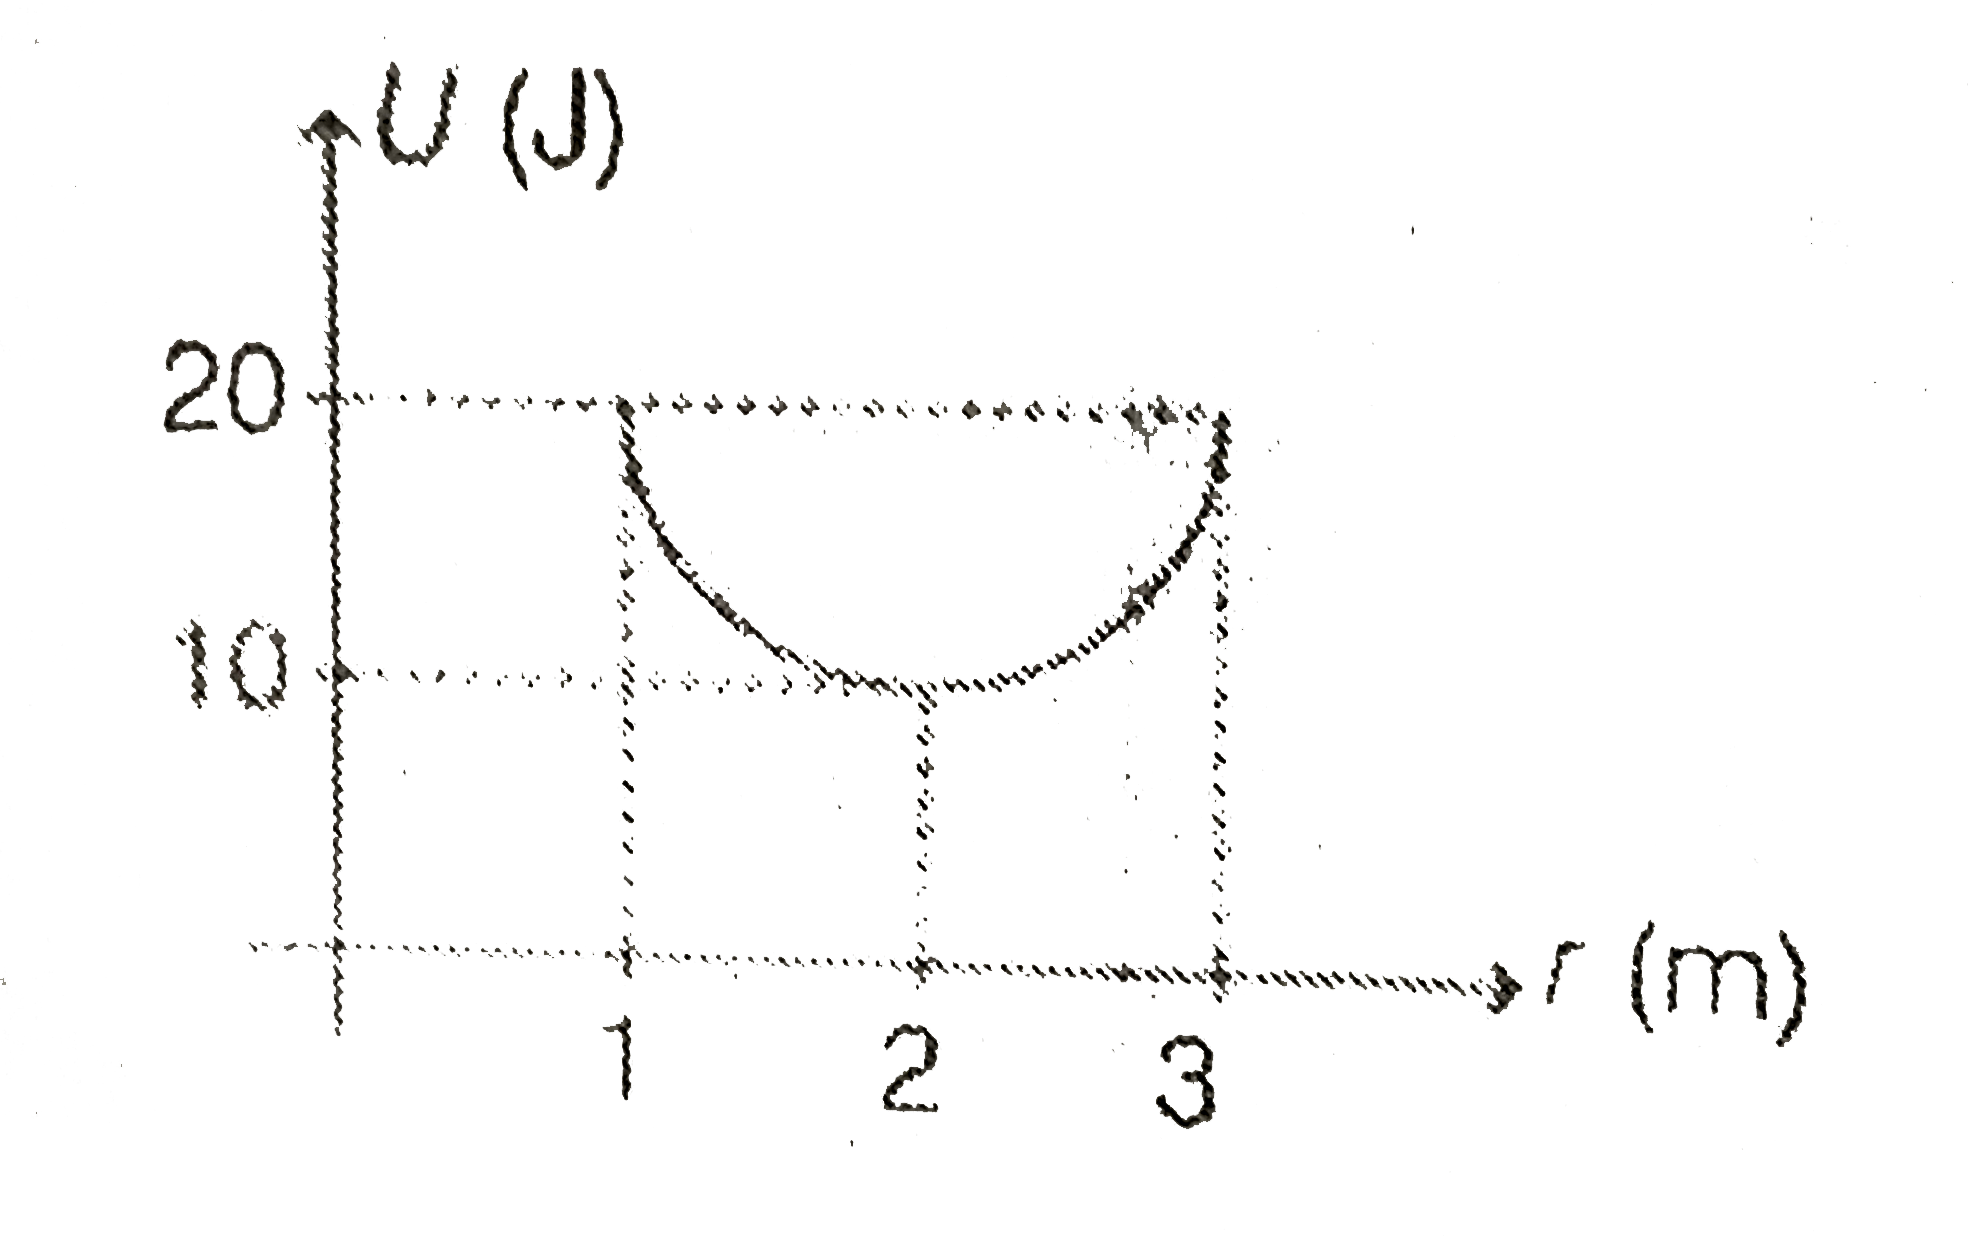
U.r graph of a particle performing SHM is as shown in figure. What conclusion cannot be drawn from the graph?
 View Solution
The diagram in Fig. 11.8 below shows the change of phases of a substance on a temperature-time graph on heating the substances at a constant rate.
(a) What do the parts AB, BC, CD and DE represent?
(b) What is the melting point of the substance ?
(c) What is the boiling point of the substance ?View Solution
Knowledge Check
- Question 1 - Select One
In laboratory experiments, two species of the protist Paramecium (species 1 and 2) were grown alond and in the presence of the other species. The following graphs show growth of species 1 and species 2, both alone and when in mixed culture with the other species.
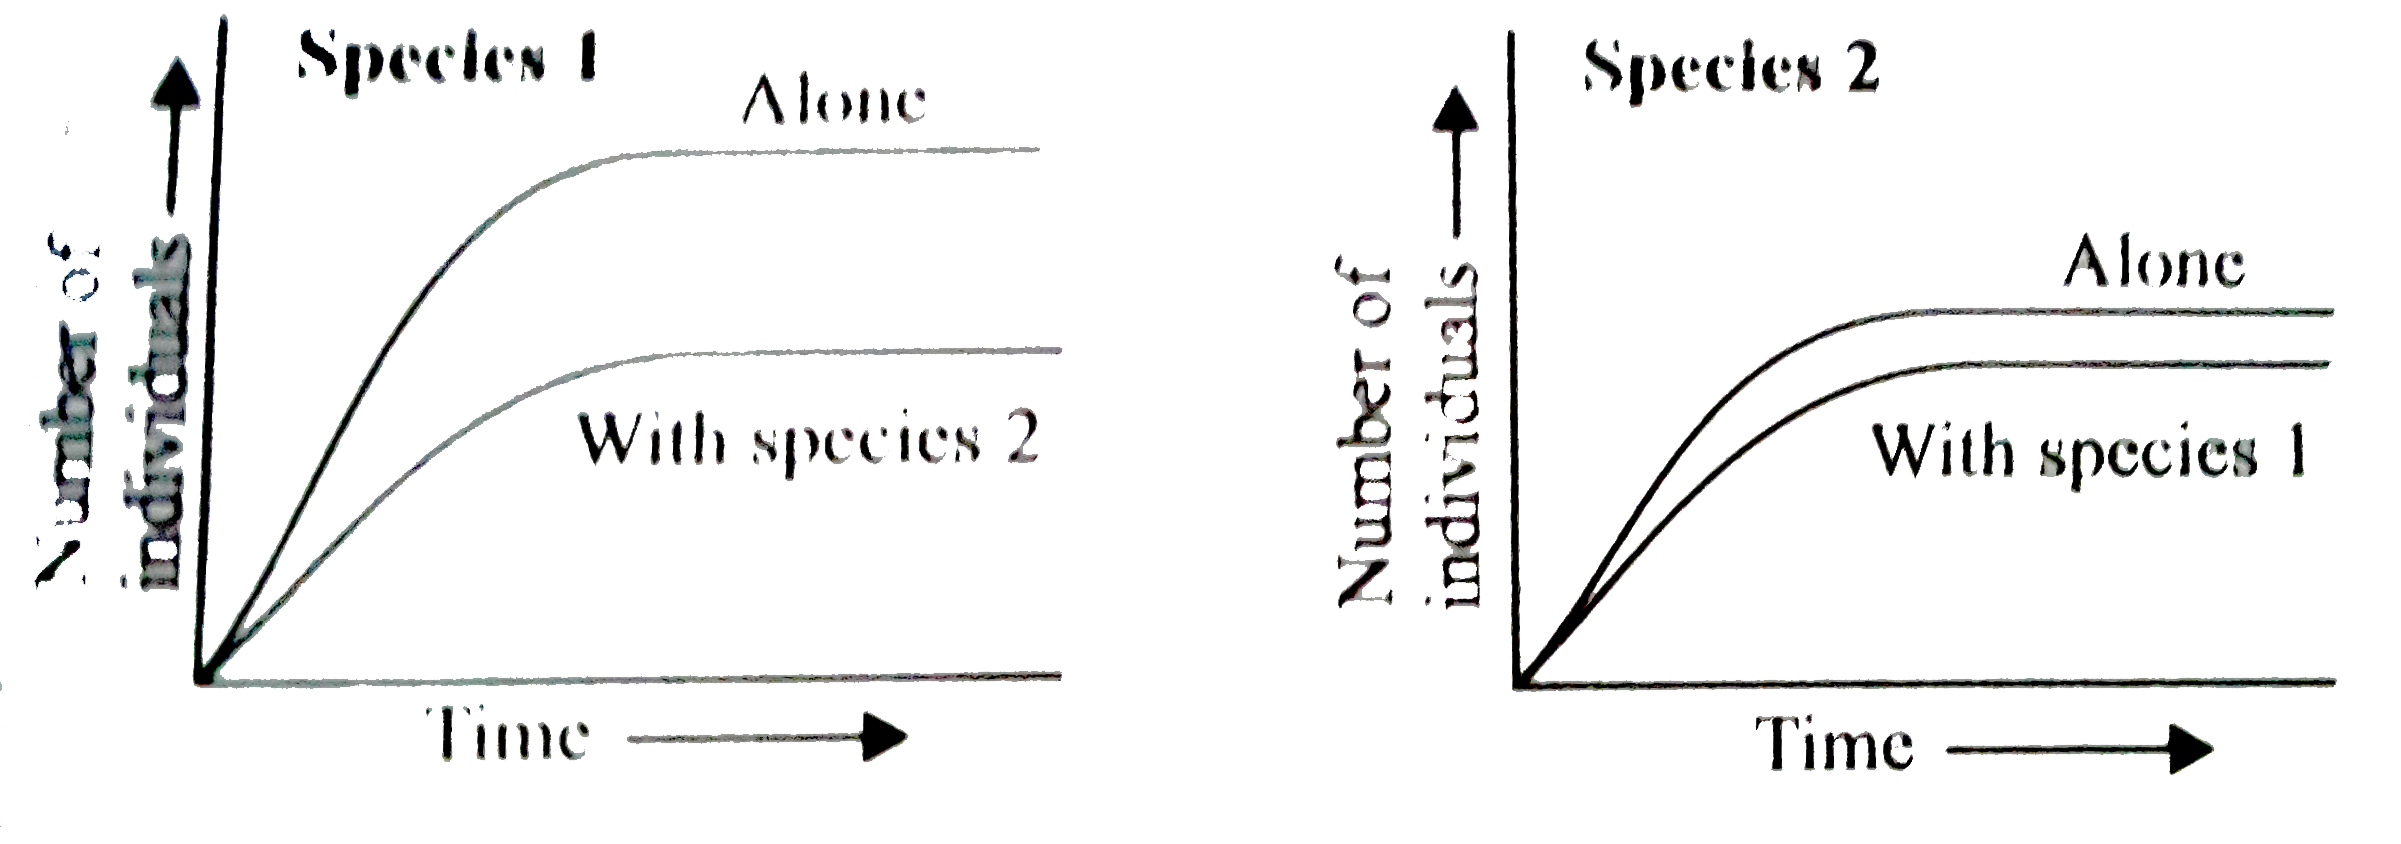 Which of the following conclusions can be drawn from the graphs ? ACompetitive exclusion occurred in these experiments.BBoth species are affected by interspecific competition but species 1 is affected less.CBoth species are affected by interspecific competition but species 2 is affected less.DBoth species are affected equally by interspecific competition.
 - Question 2 - Select One
The relationship between population density (Nt) and population growth rate (R=Nt+1lNt) in a certain animal species is shown below.
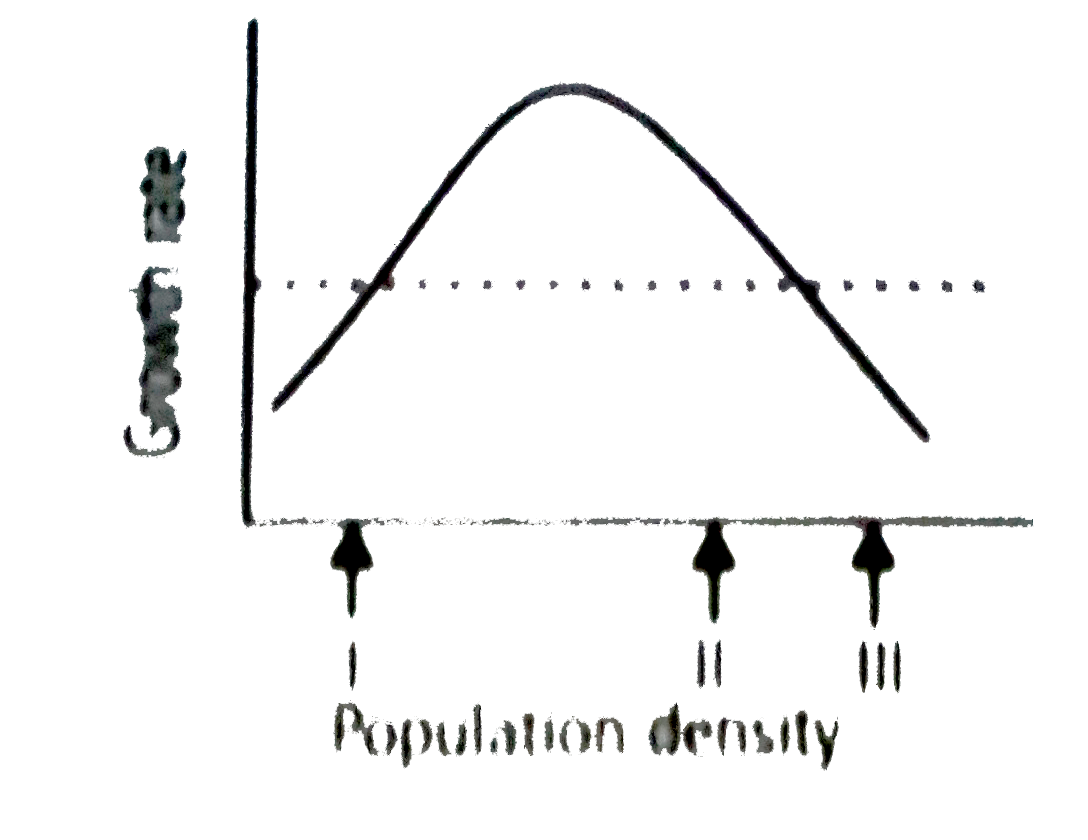
Choose from the following graphs the appropriate populations growth patterns that would be obtained if the population is at the densities (I, II, III) shown in the graph above. [Note : THe y-axis in A to D is relative density that cannot be compared to the absolute density in the figure]
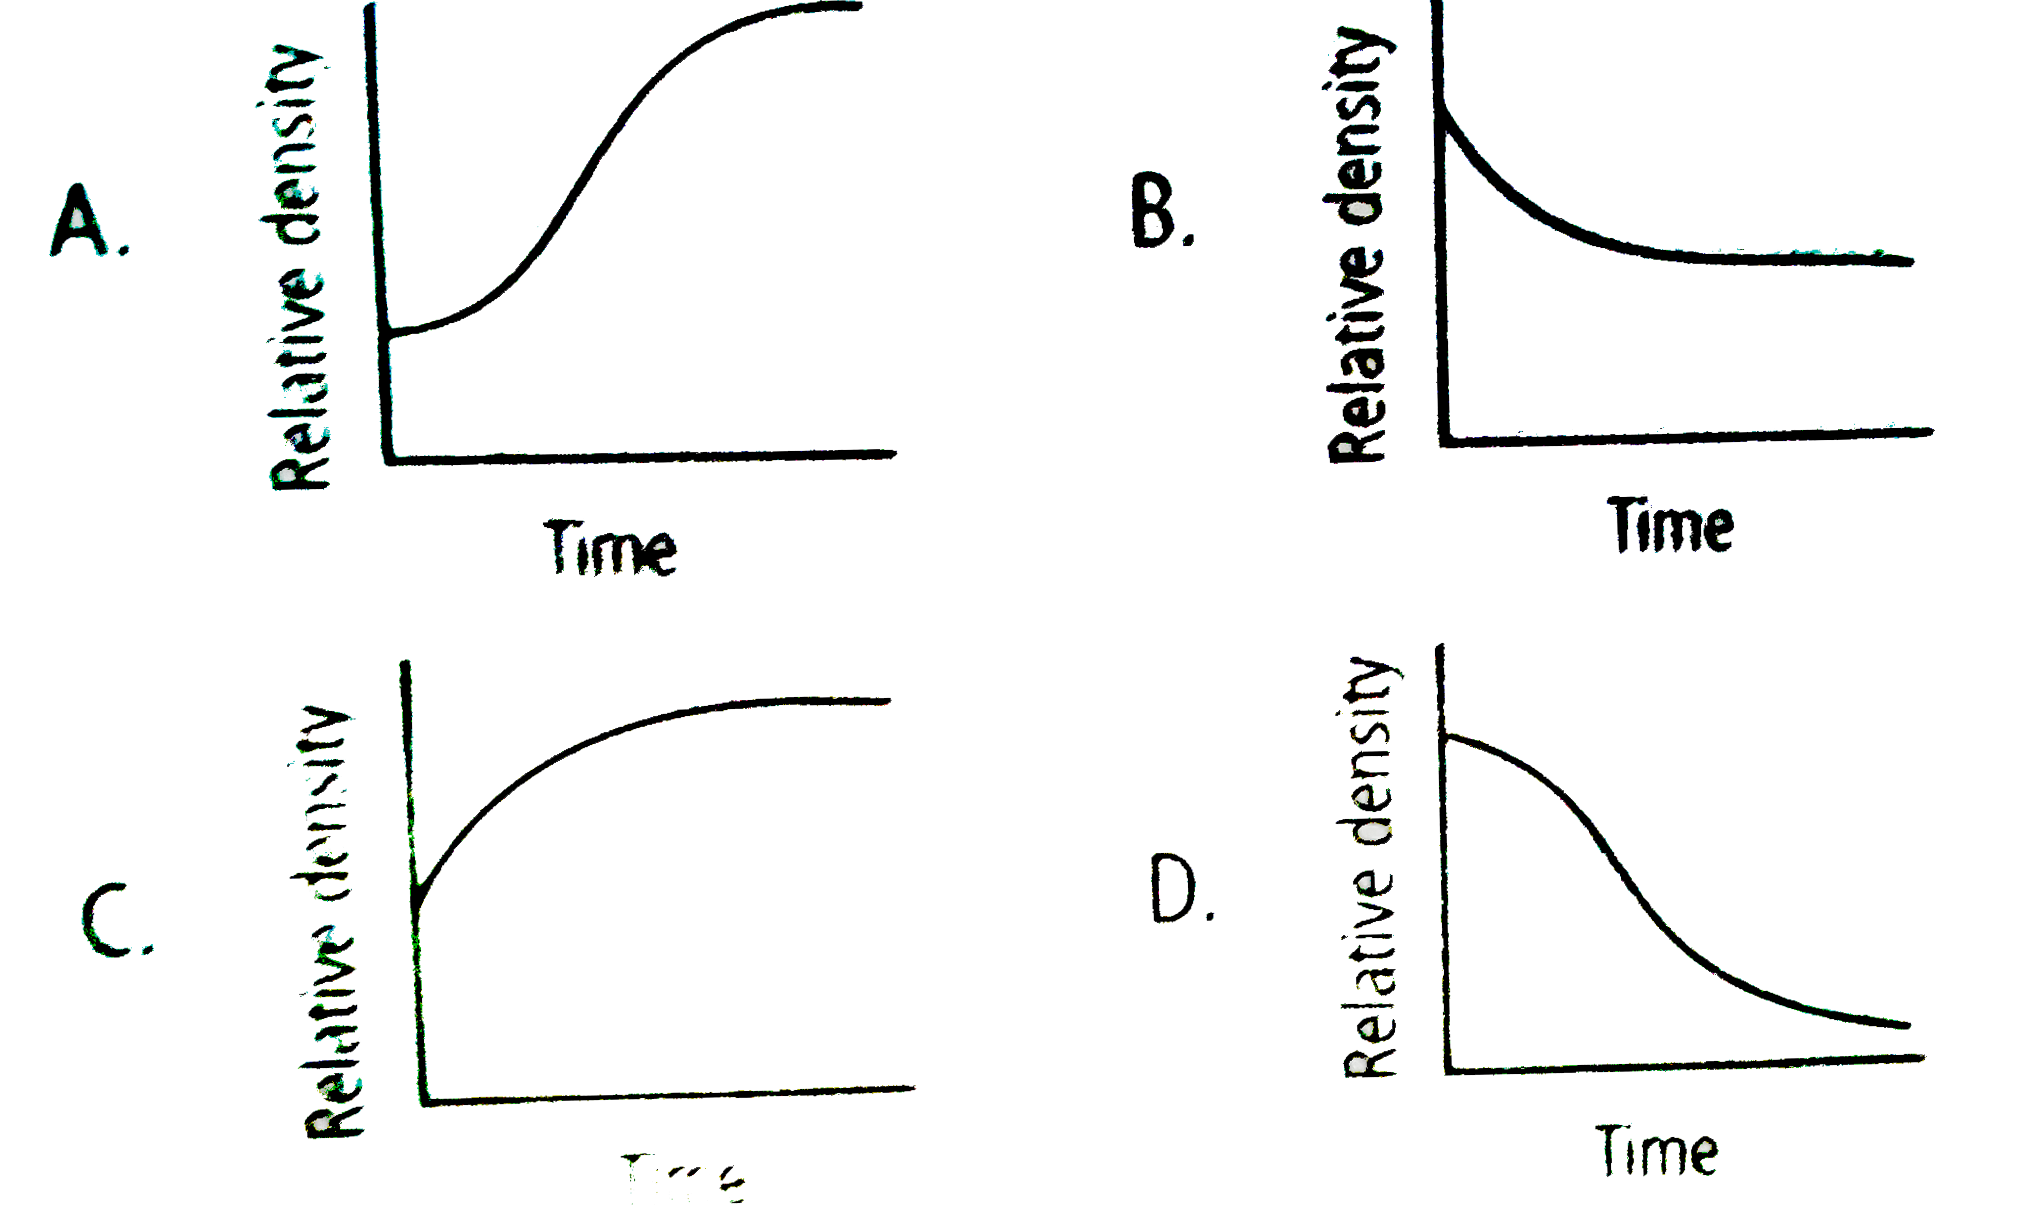 AI−A,II−B,III−CBI−D,II−C,III−BCI−B,II−C,III−DDI−C,II−A,III−B
 - Question 3 - Select One
The given graph shows how much nitrate (NO−3) is exported from the continent towards the ocean by 16 major rivers in the world rivers in the world compared to the density of human populations living along those drainage basins (i.e., along these rivers). What interpretation can be drawn from this graph ?
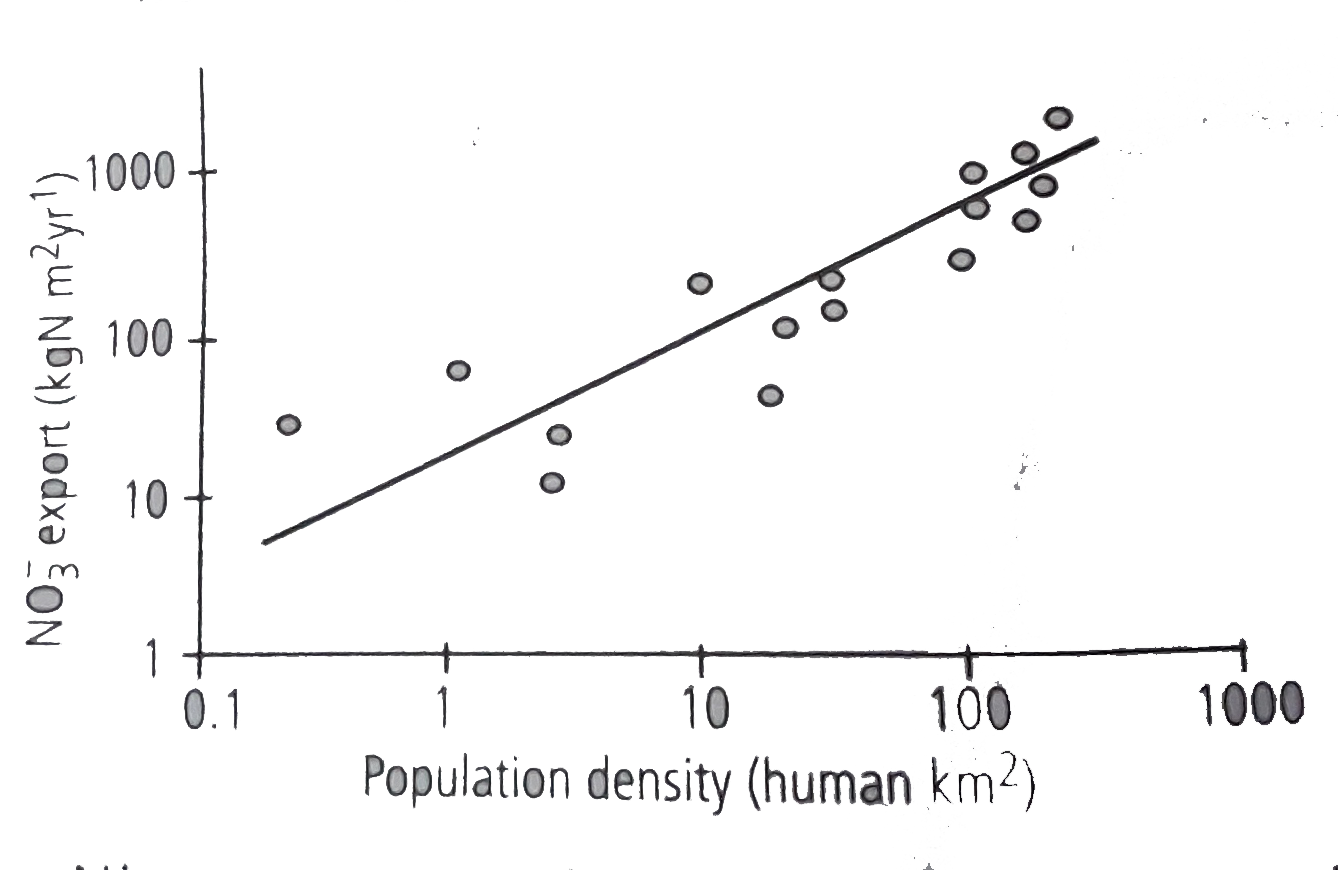 ANitrate exported through rivers from heavily populated cities can cause eutrophication and toxic algal bloom in marine coastal regions.BSmall drainage basins export more NO−3.CDrainage basins with higher populstion densities export lesser NO−3.Dboth (a) and (c )
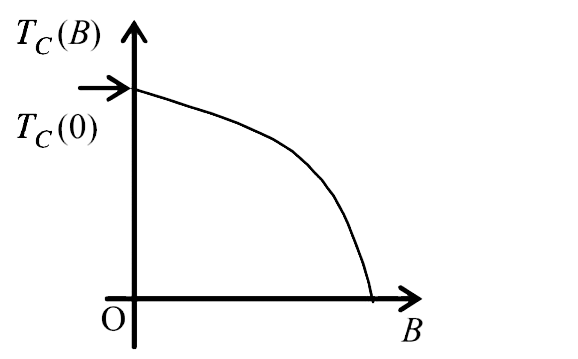
Electrical resistance of certain materials, known as superconductors, changes abruptly from a nonzero value of zero as their temperature is lowered below a critical temperature TC(0). An interesting property of super conductors is that their critical temperature becomes smaller than TC(0) if they are placed in a magnetic field, i.e., the critical temperature TC(B) is a function of the magnetic field strength B. The dependence of TC(B) on B is shown in the figure.
 .
.
In the graphs below, the resistance R of a superconductor is shown as a function of its temperature T for two different magnetic fields B1(solid line) and B2 (dashed line). If B2 is larget than B1 which of the following graphs shows the correct variation of R with T in these fields?View Solution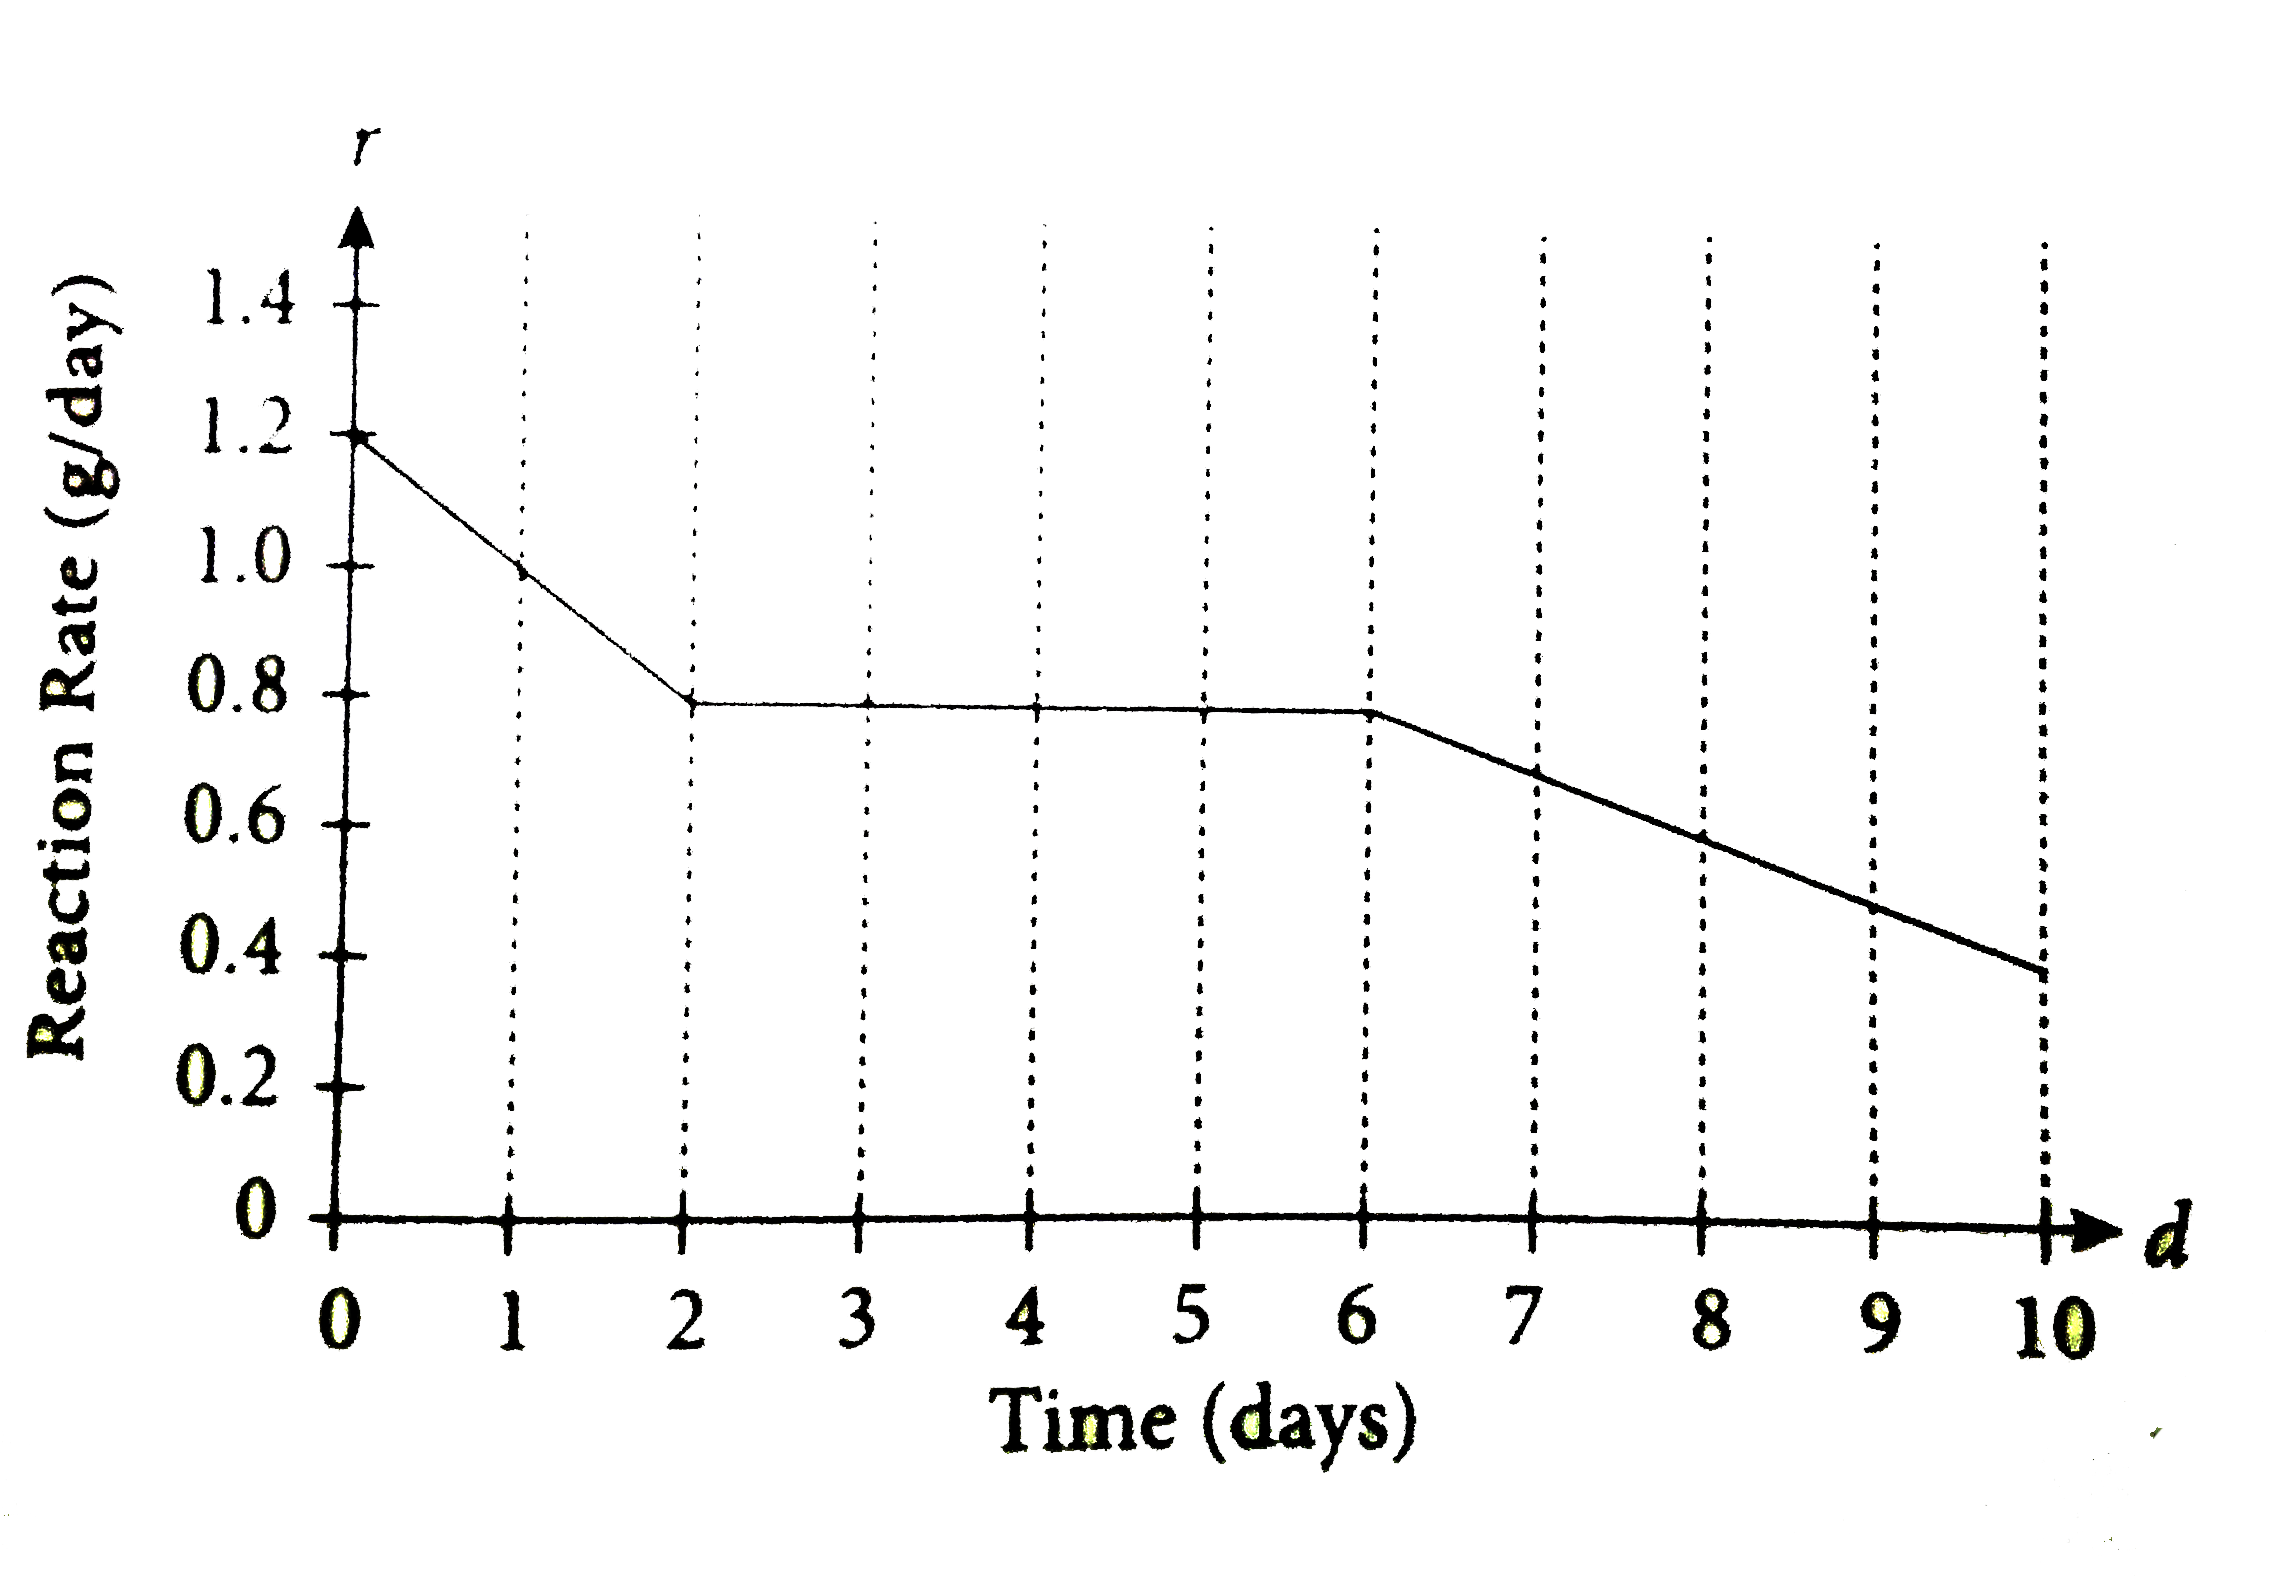
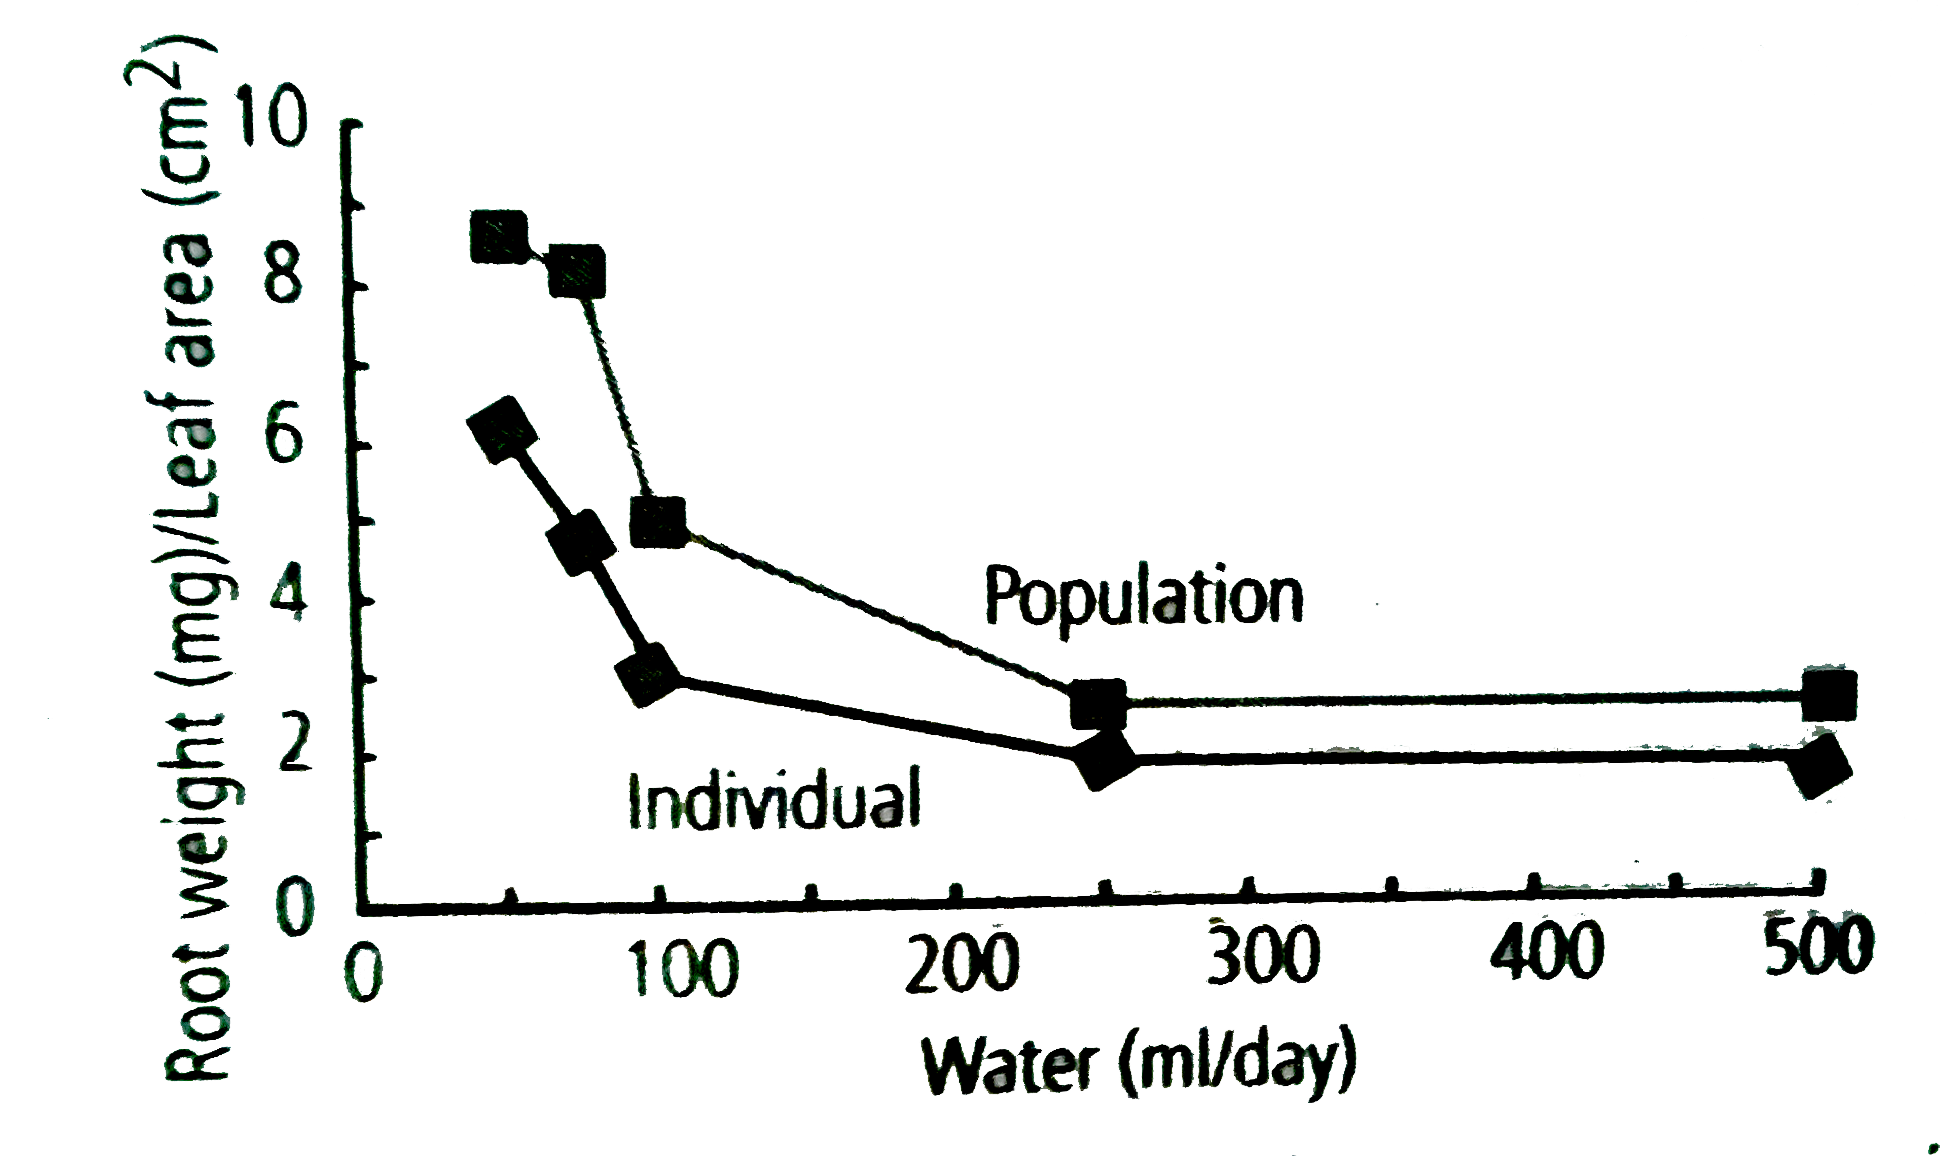
the graph above represents the reaction rate,r, at which an unfinished iron nail rists in water during the first 10 days of an experiment, where d gives time measured in days. What was the total amount of rust produced from d=2 to d=6?View SolutionTo determine the effect of intra-specific competition on the growth of saplings of Eucalyptus dives, an experiment was designed in which two sets of pots were used. In the first set only 1 sapling was planted per pot. To check for the effect of intra-specific competition on allocation to each set. the results have been graphically indicated below. Which of the following conclusions can be best drawn from the study ?
 View Solution
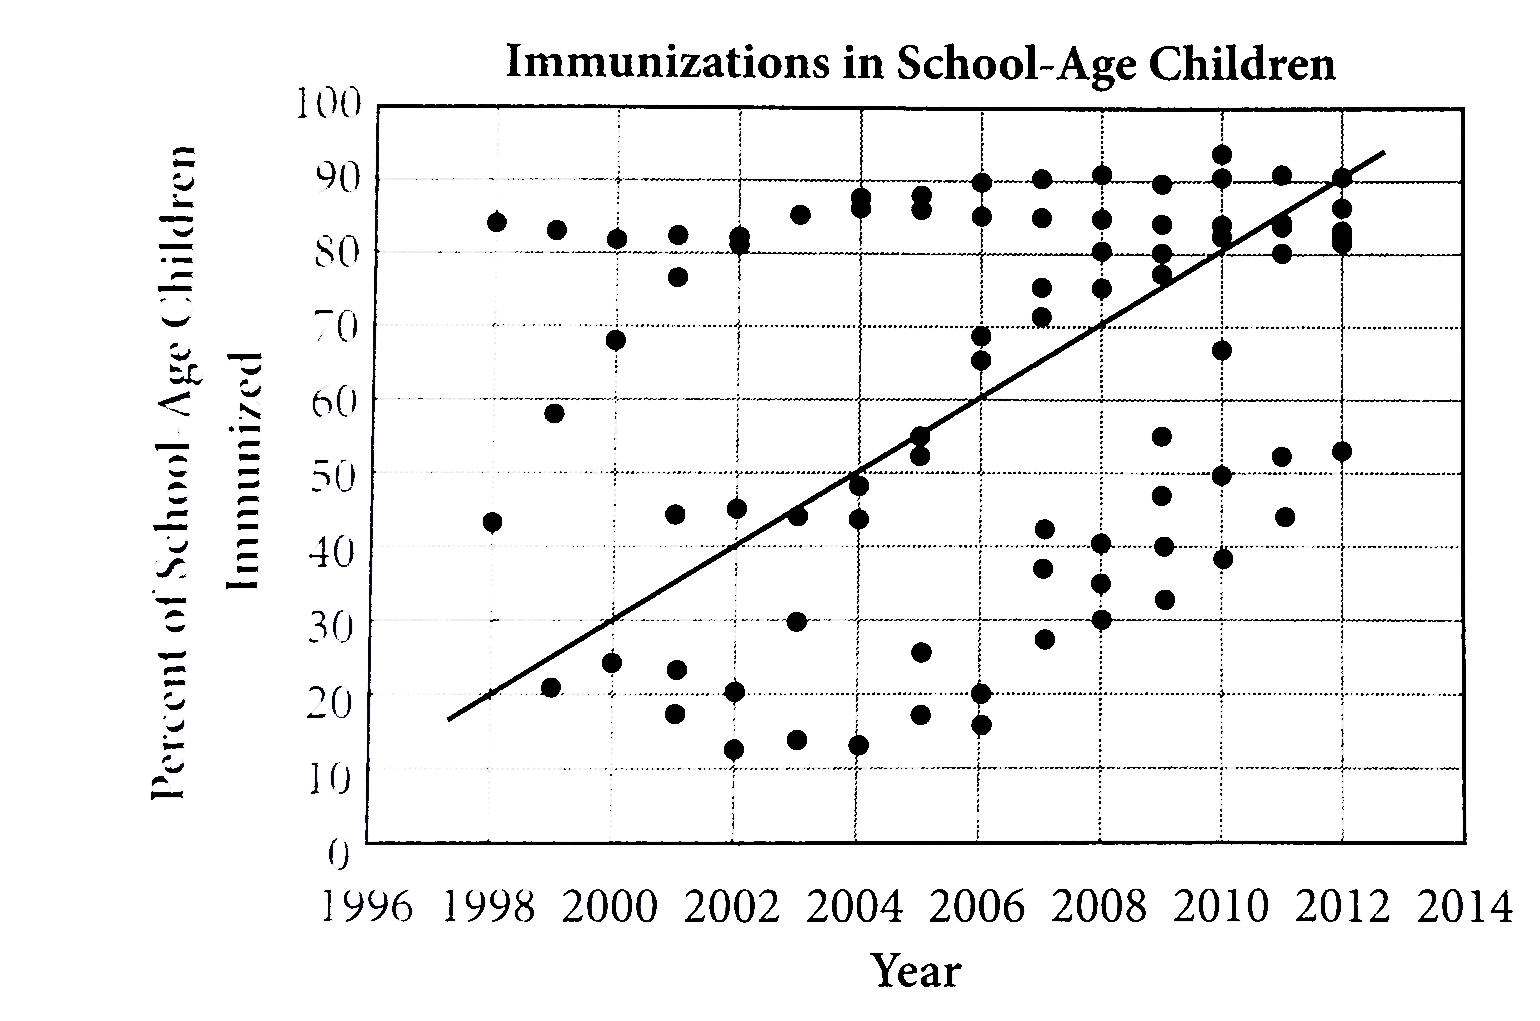
The graph above shows the percent of school-age children in the United States who received immunization for various illnesses beetween 1996 and 2012. What was the average rate of increase in the percent of children immunized per year over the given time period ?View SolutionAdriana used the data from a scatterplot she found on the U.S. Census Bureau's website to determine a regression model showing the relationship between the population in the area where she lived and the number of years, x, after she was born. The result was an exponential growth equation of the form y=x0(1+r)x. Which of the following does x0 most likely represent in the equation ?
View Solution
