The given figure shows______

the major target sites and the metabolic actions of the anabolic homone secreted by the beta cells of heterocrine gland
the major target sites and the metabolic action of the hormone secreted by alpha cells of pancreas
the major target sites and the functions of the hormone secreted by the anterior pituitary gland.
the major target sites and the metabolic actions of the hormone secreted by the parafollicular C cells
The correct Answer is:A
Beta cells of pancreas produce insulin. It promotes protein synthesis in tissue from amino acids and reduces catabolism of proteins. It increases the synthesis of fat in the adipose tissue from fatty acids and reduces the breakdown and oxidation of fat.
Insulin decreases the lvel of glucose in the blood it acts by increasing the rate at which glucose is transported out of the blood and into cells and by stimulating muscle cells to take up sugar from the blood and convert it to glycogen.
Topper's Solved these Questions
Similar Questions
The given figures show the unfolded sheet of paper after holes have been punched on the folded paper. Find the lines of symmetry.

View SolutionThe given figures show the unfolded sheet of paper after holes have been punched on the folded paper. Find the lines of symmetry.
Equilateral triangle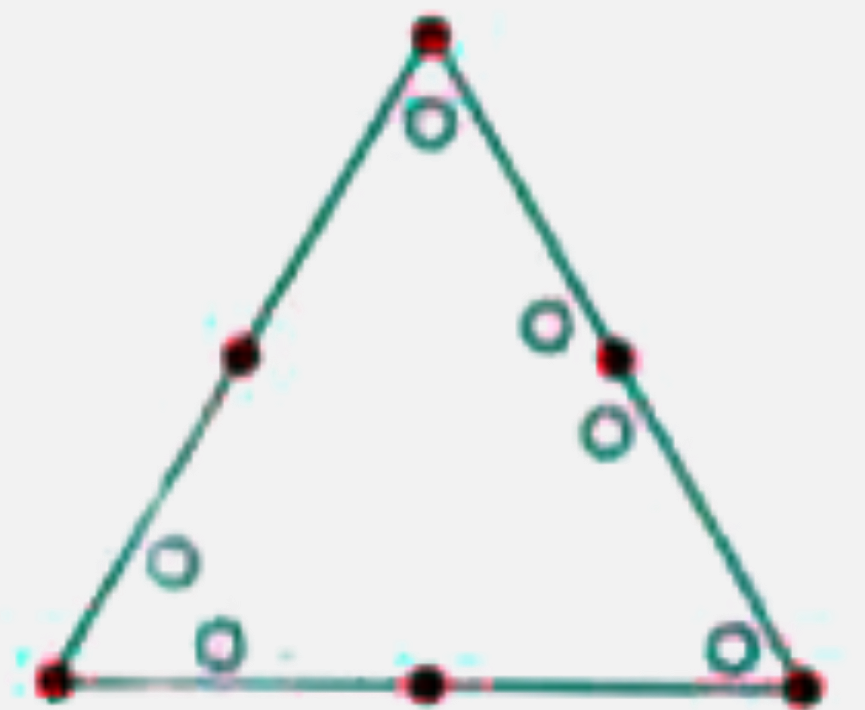
View Solution
Knowledge Check
What type of inflorescence does the given figure show ?
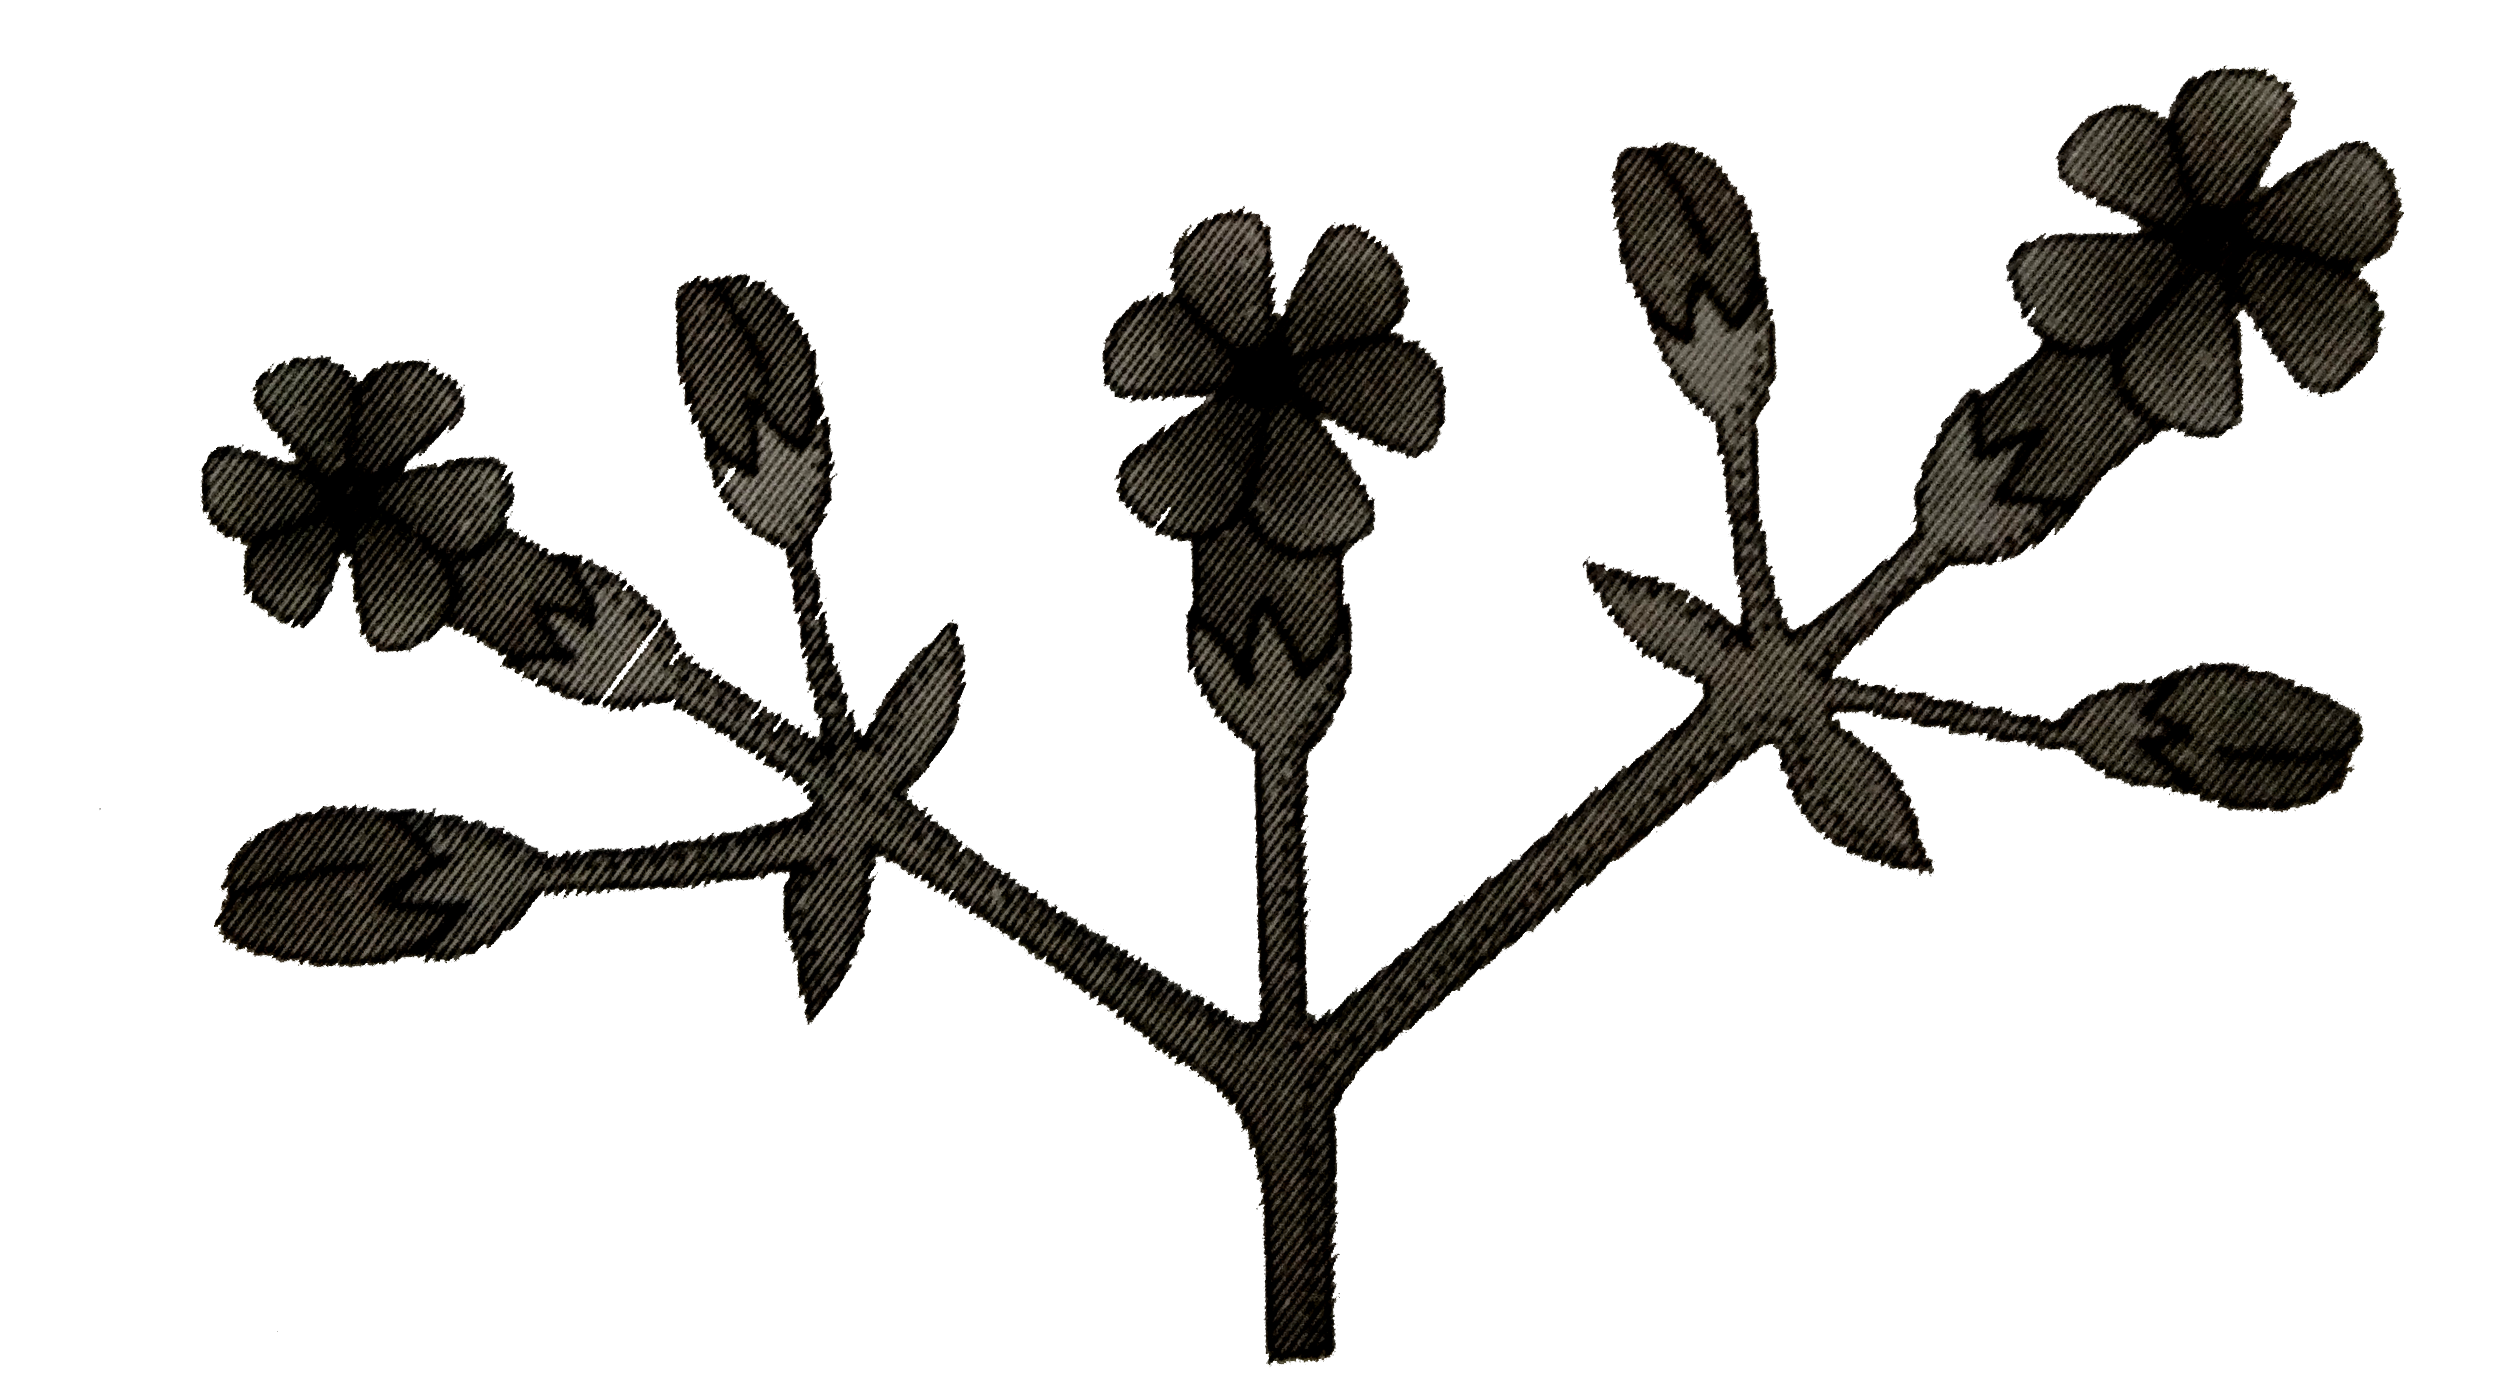 AUniparous cymeBBiparous cymeCMultiparousDRacemose
Identify the parts marked as A,B and C in the given figure showing ATP synthesis thorugh chemiosmosis.
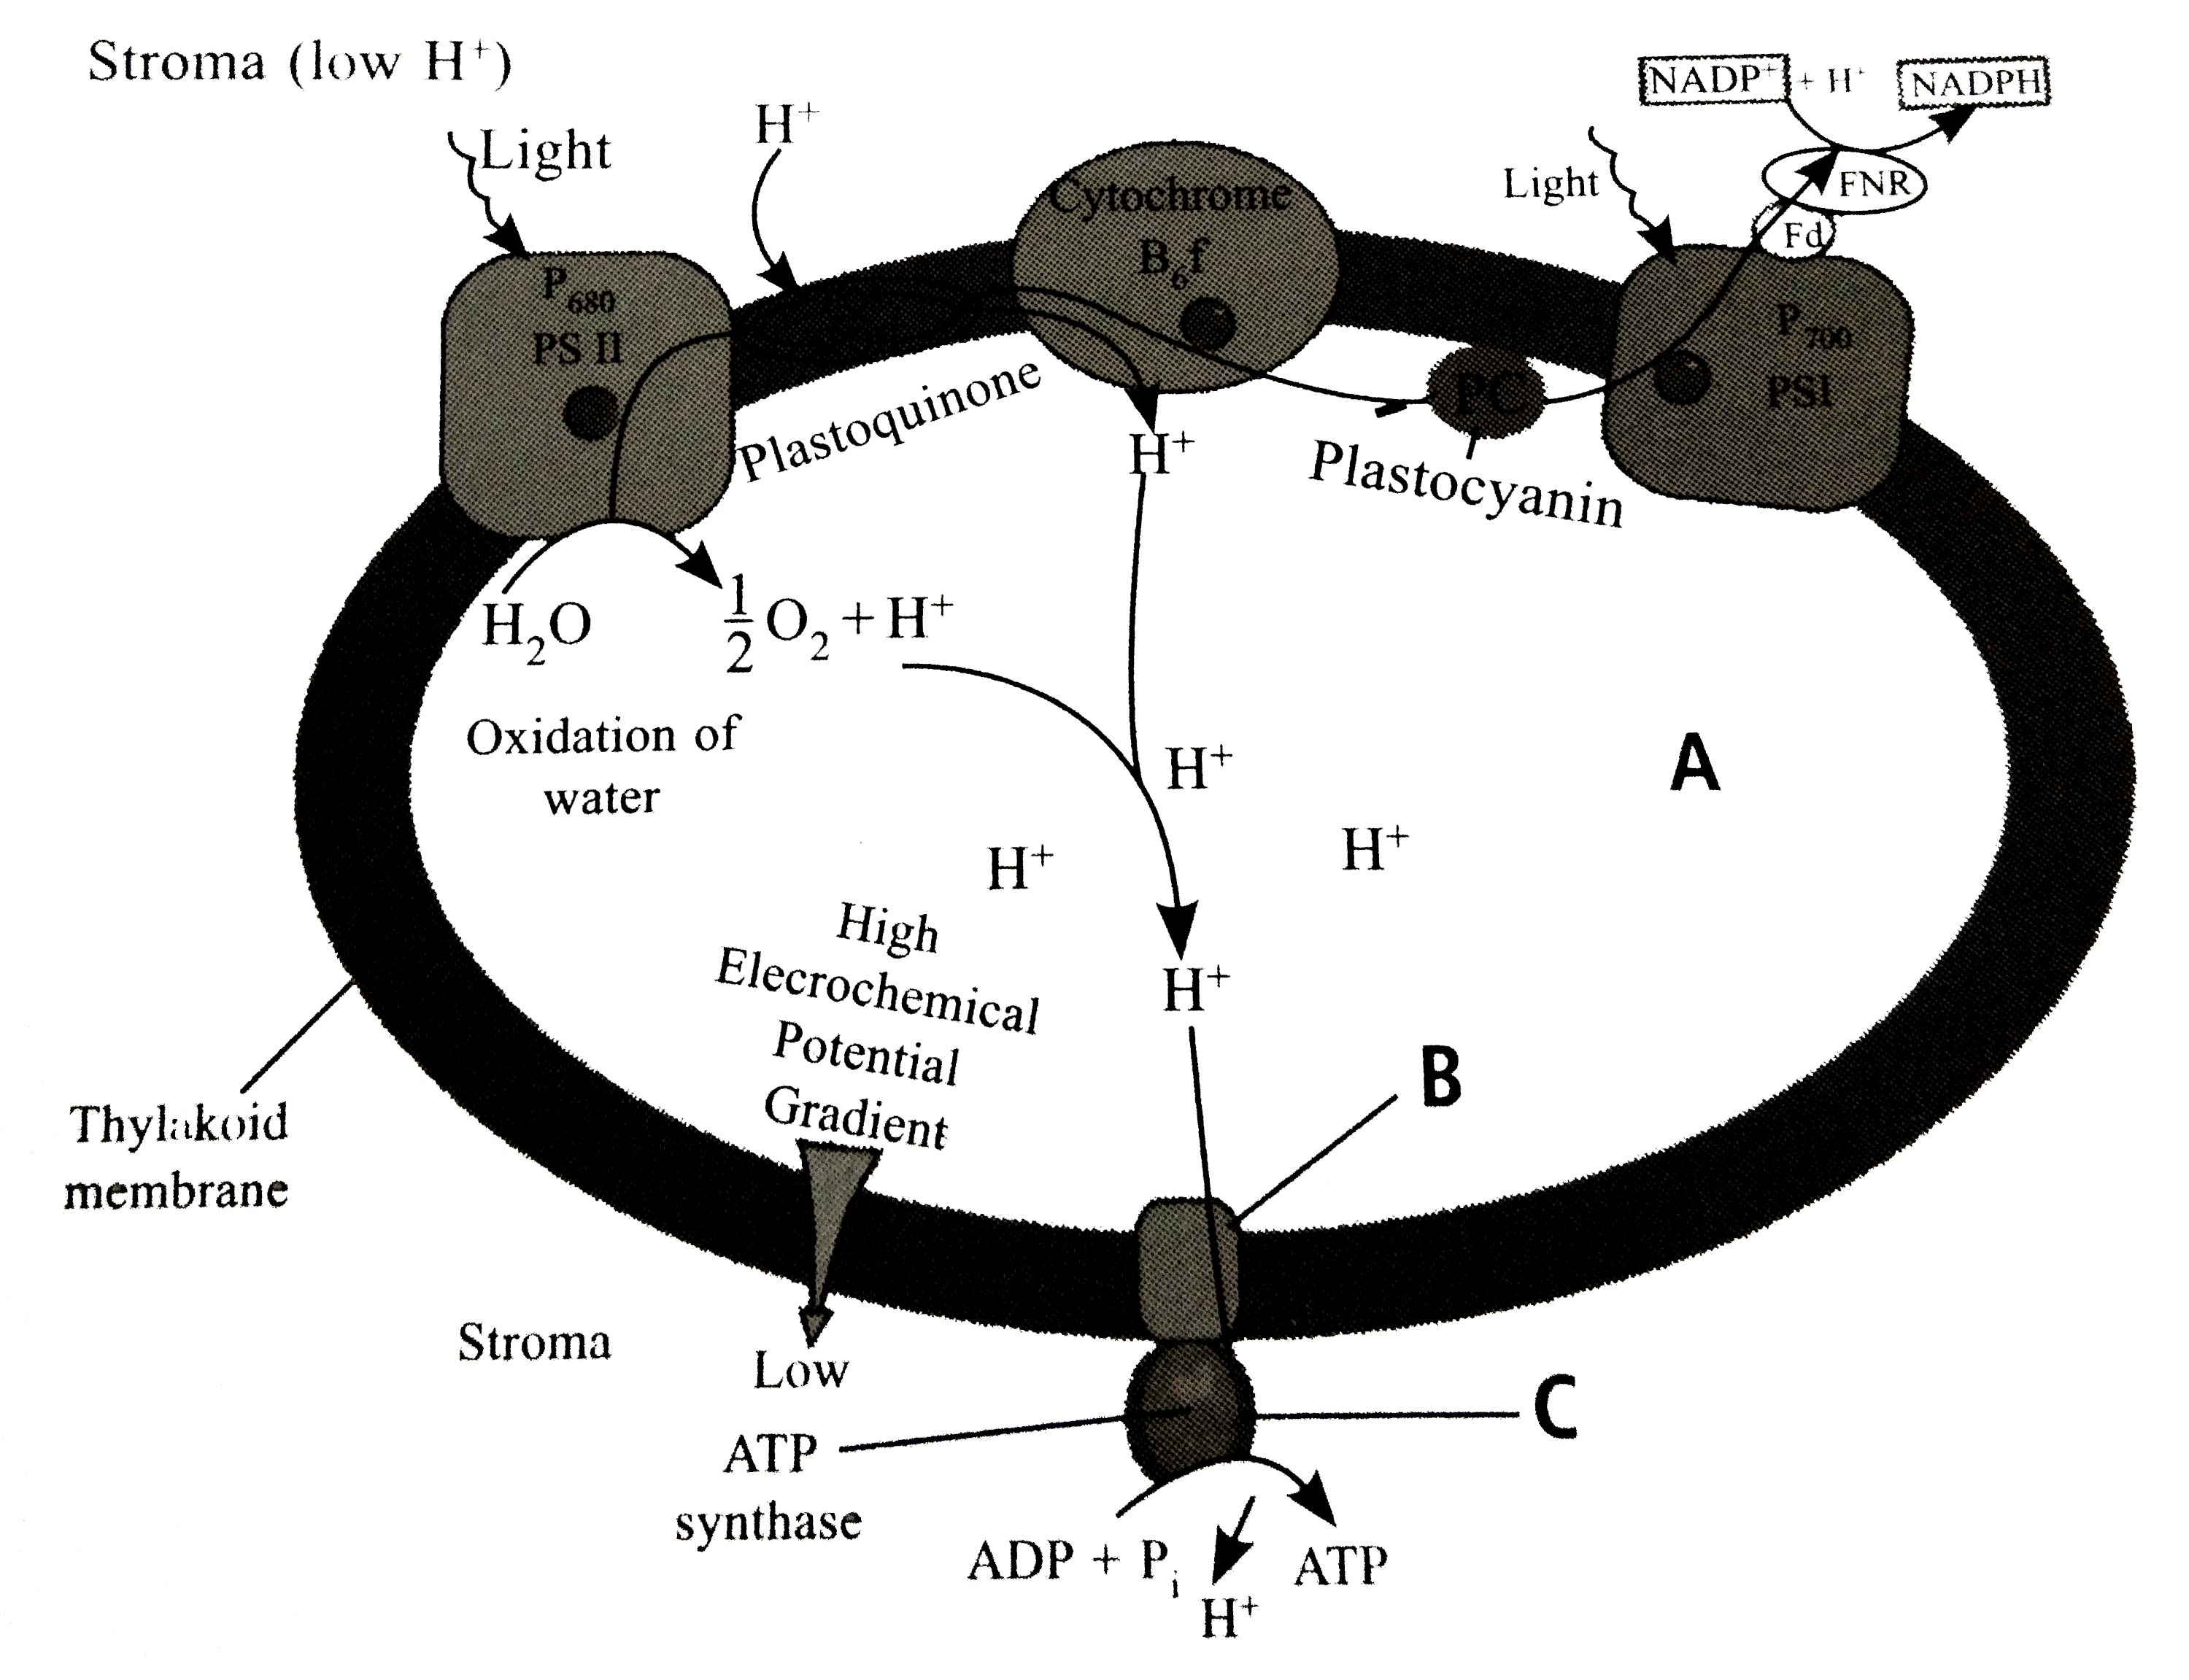 AABCThylakoid lumenCF0CF1BABCThylakoid lumenCF1CF0CABCChloroplast lumenCF0CF1DABCChloroplast lumenCF1CF0
Refer the given figure showing some steps of citric acid cycle. What changes takes place during the conversion of A to B ?
 ACO2 is liberatedBNAD+ is converted to NADH+H+CGTP is formed from GDPDAll of these
In the given figure, show that AB∣∣EF.
View SolutionIdentify the parts marked as A, B and C in the given figure showing ATP synthesis through chemiosmosis
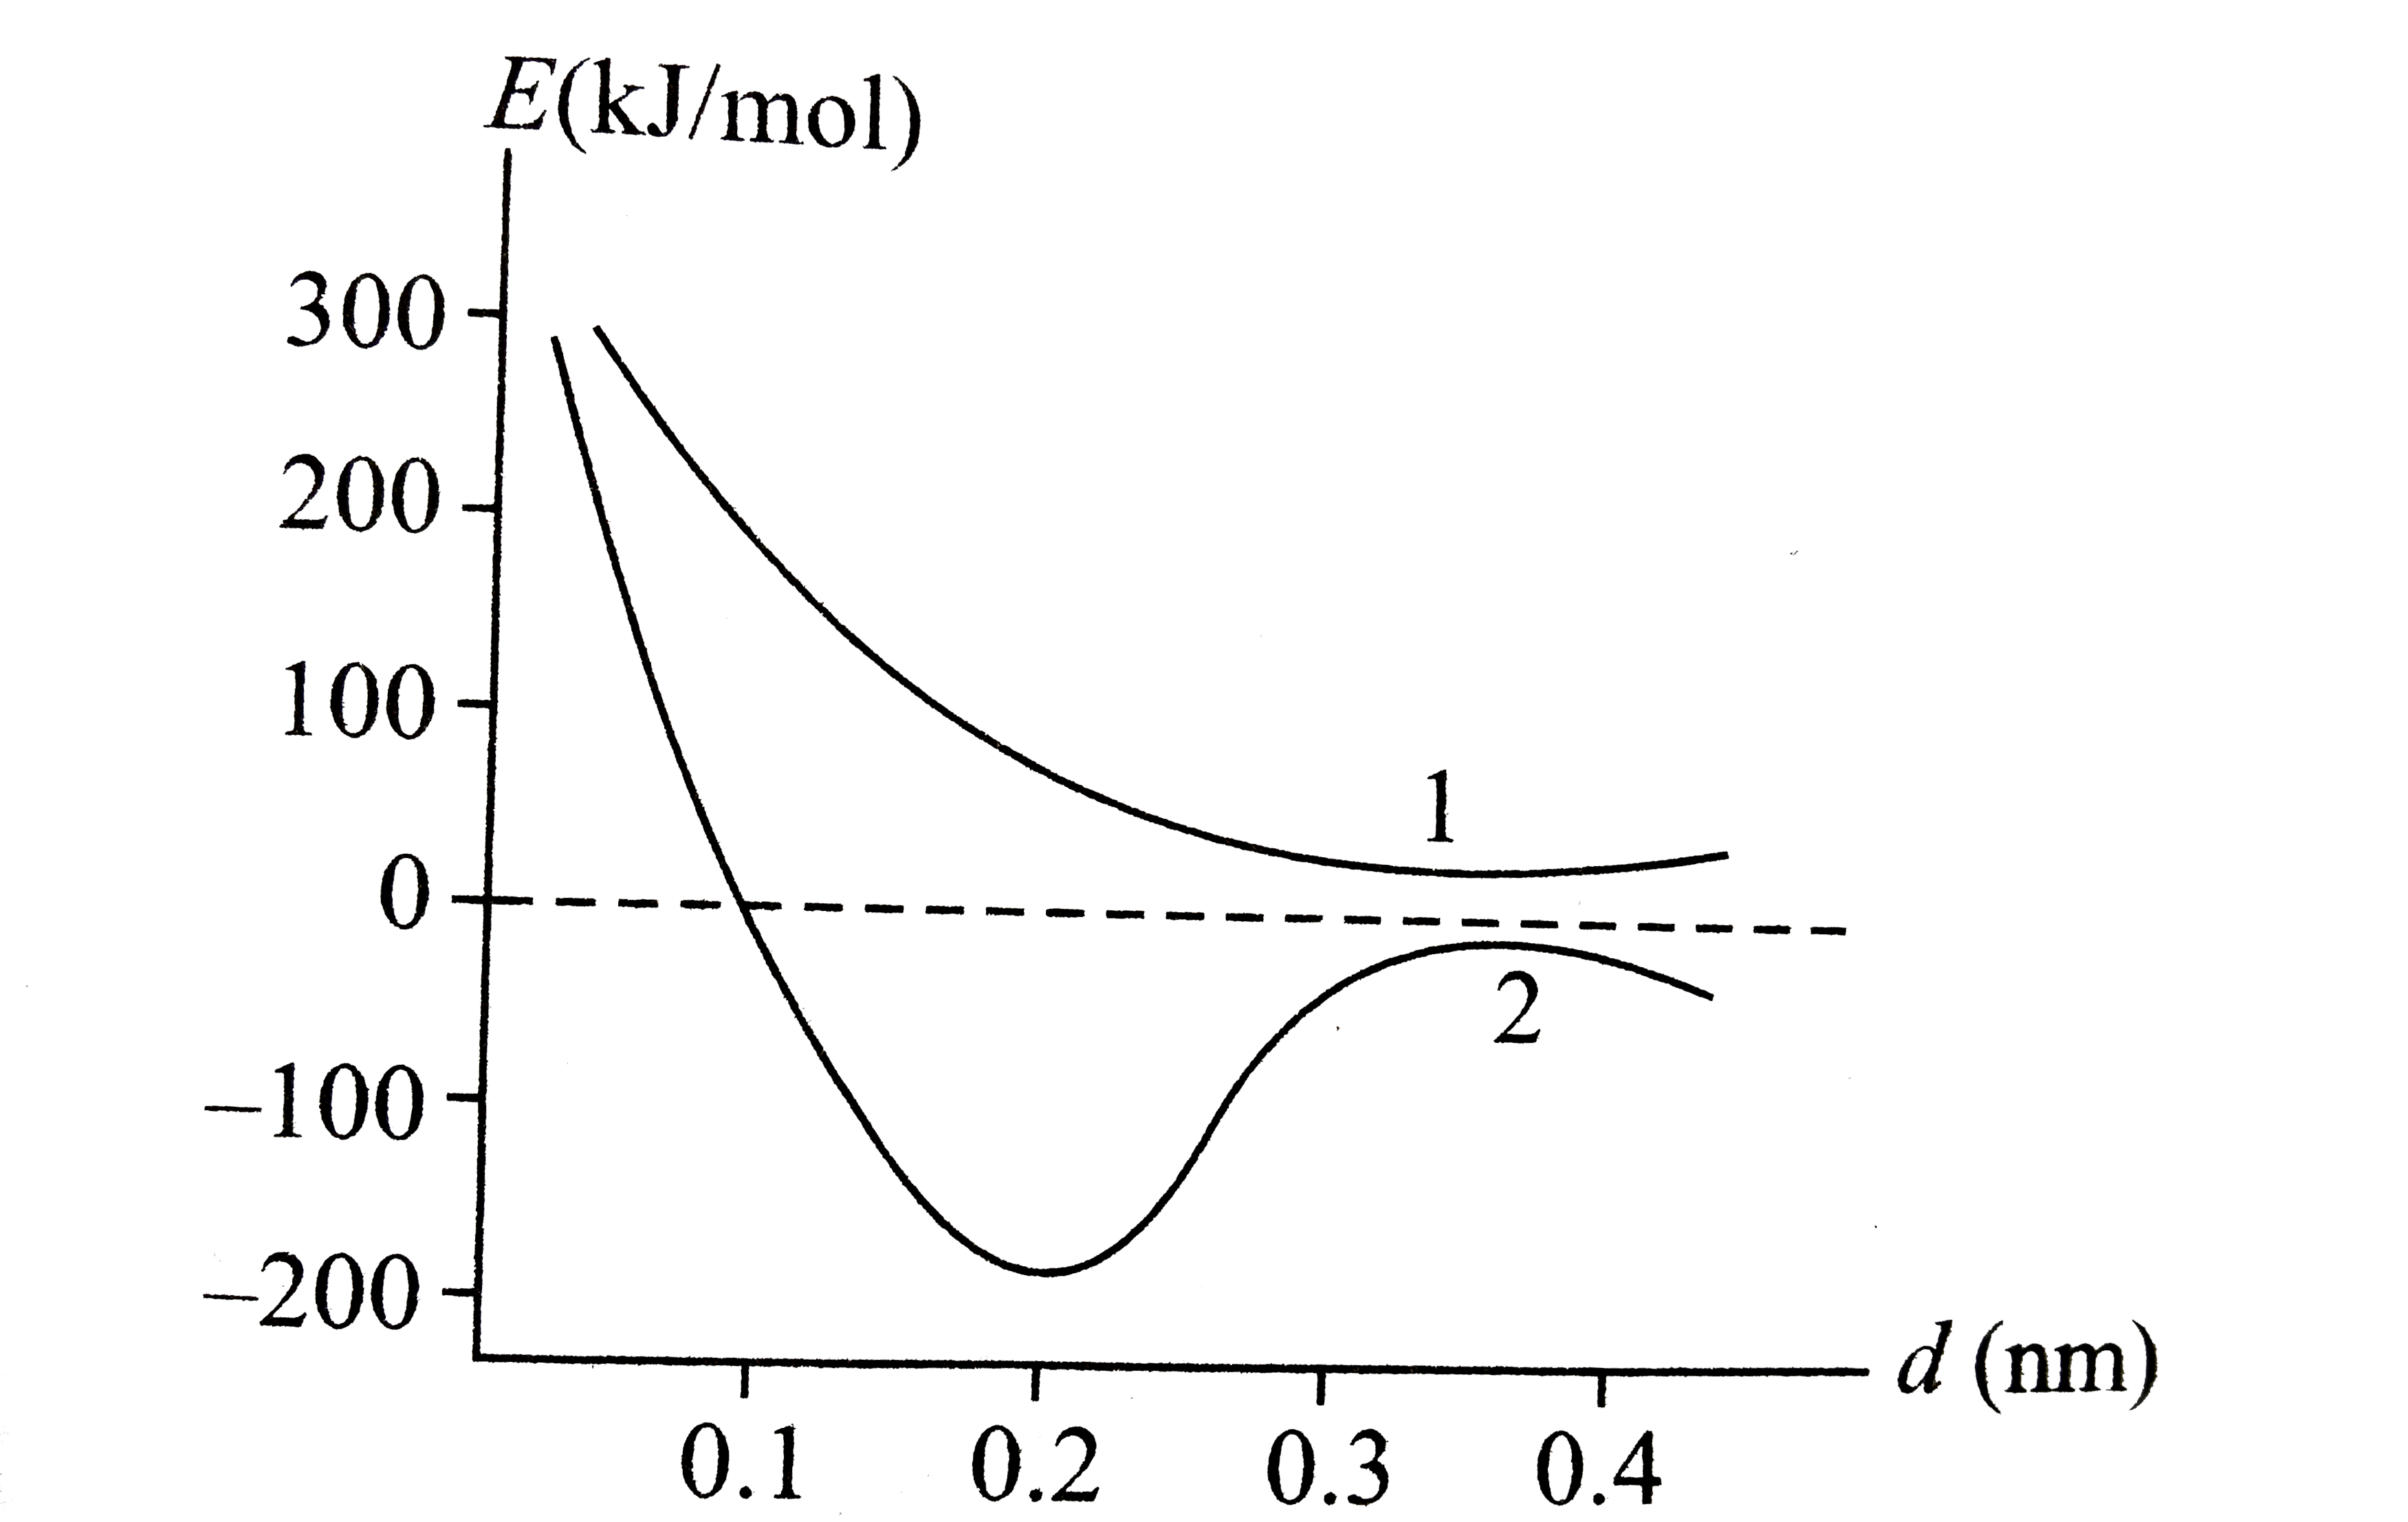
View SolutionConsider the given figure showing the formation of H+2 ion depending on intermuclear distance versus potential energy of the system.
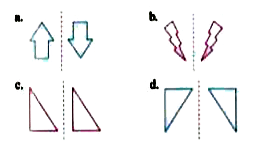
View SolutionWhich of the given figures show line/reflection symmetry?
 .
.
View SolutionRefer to the given figures showing two types of glands
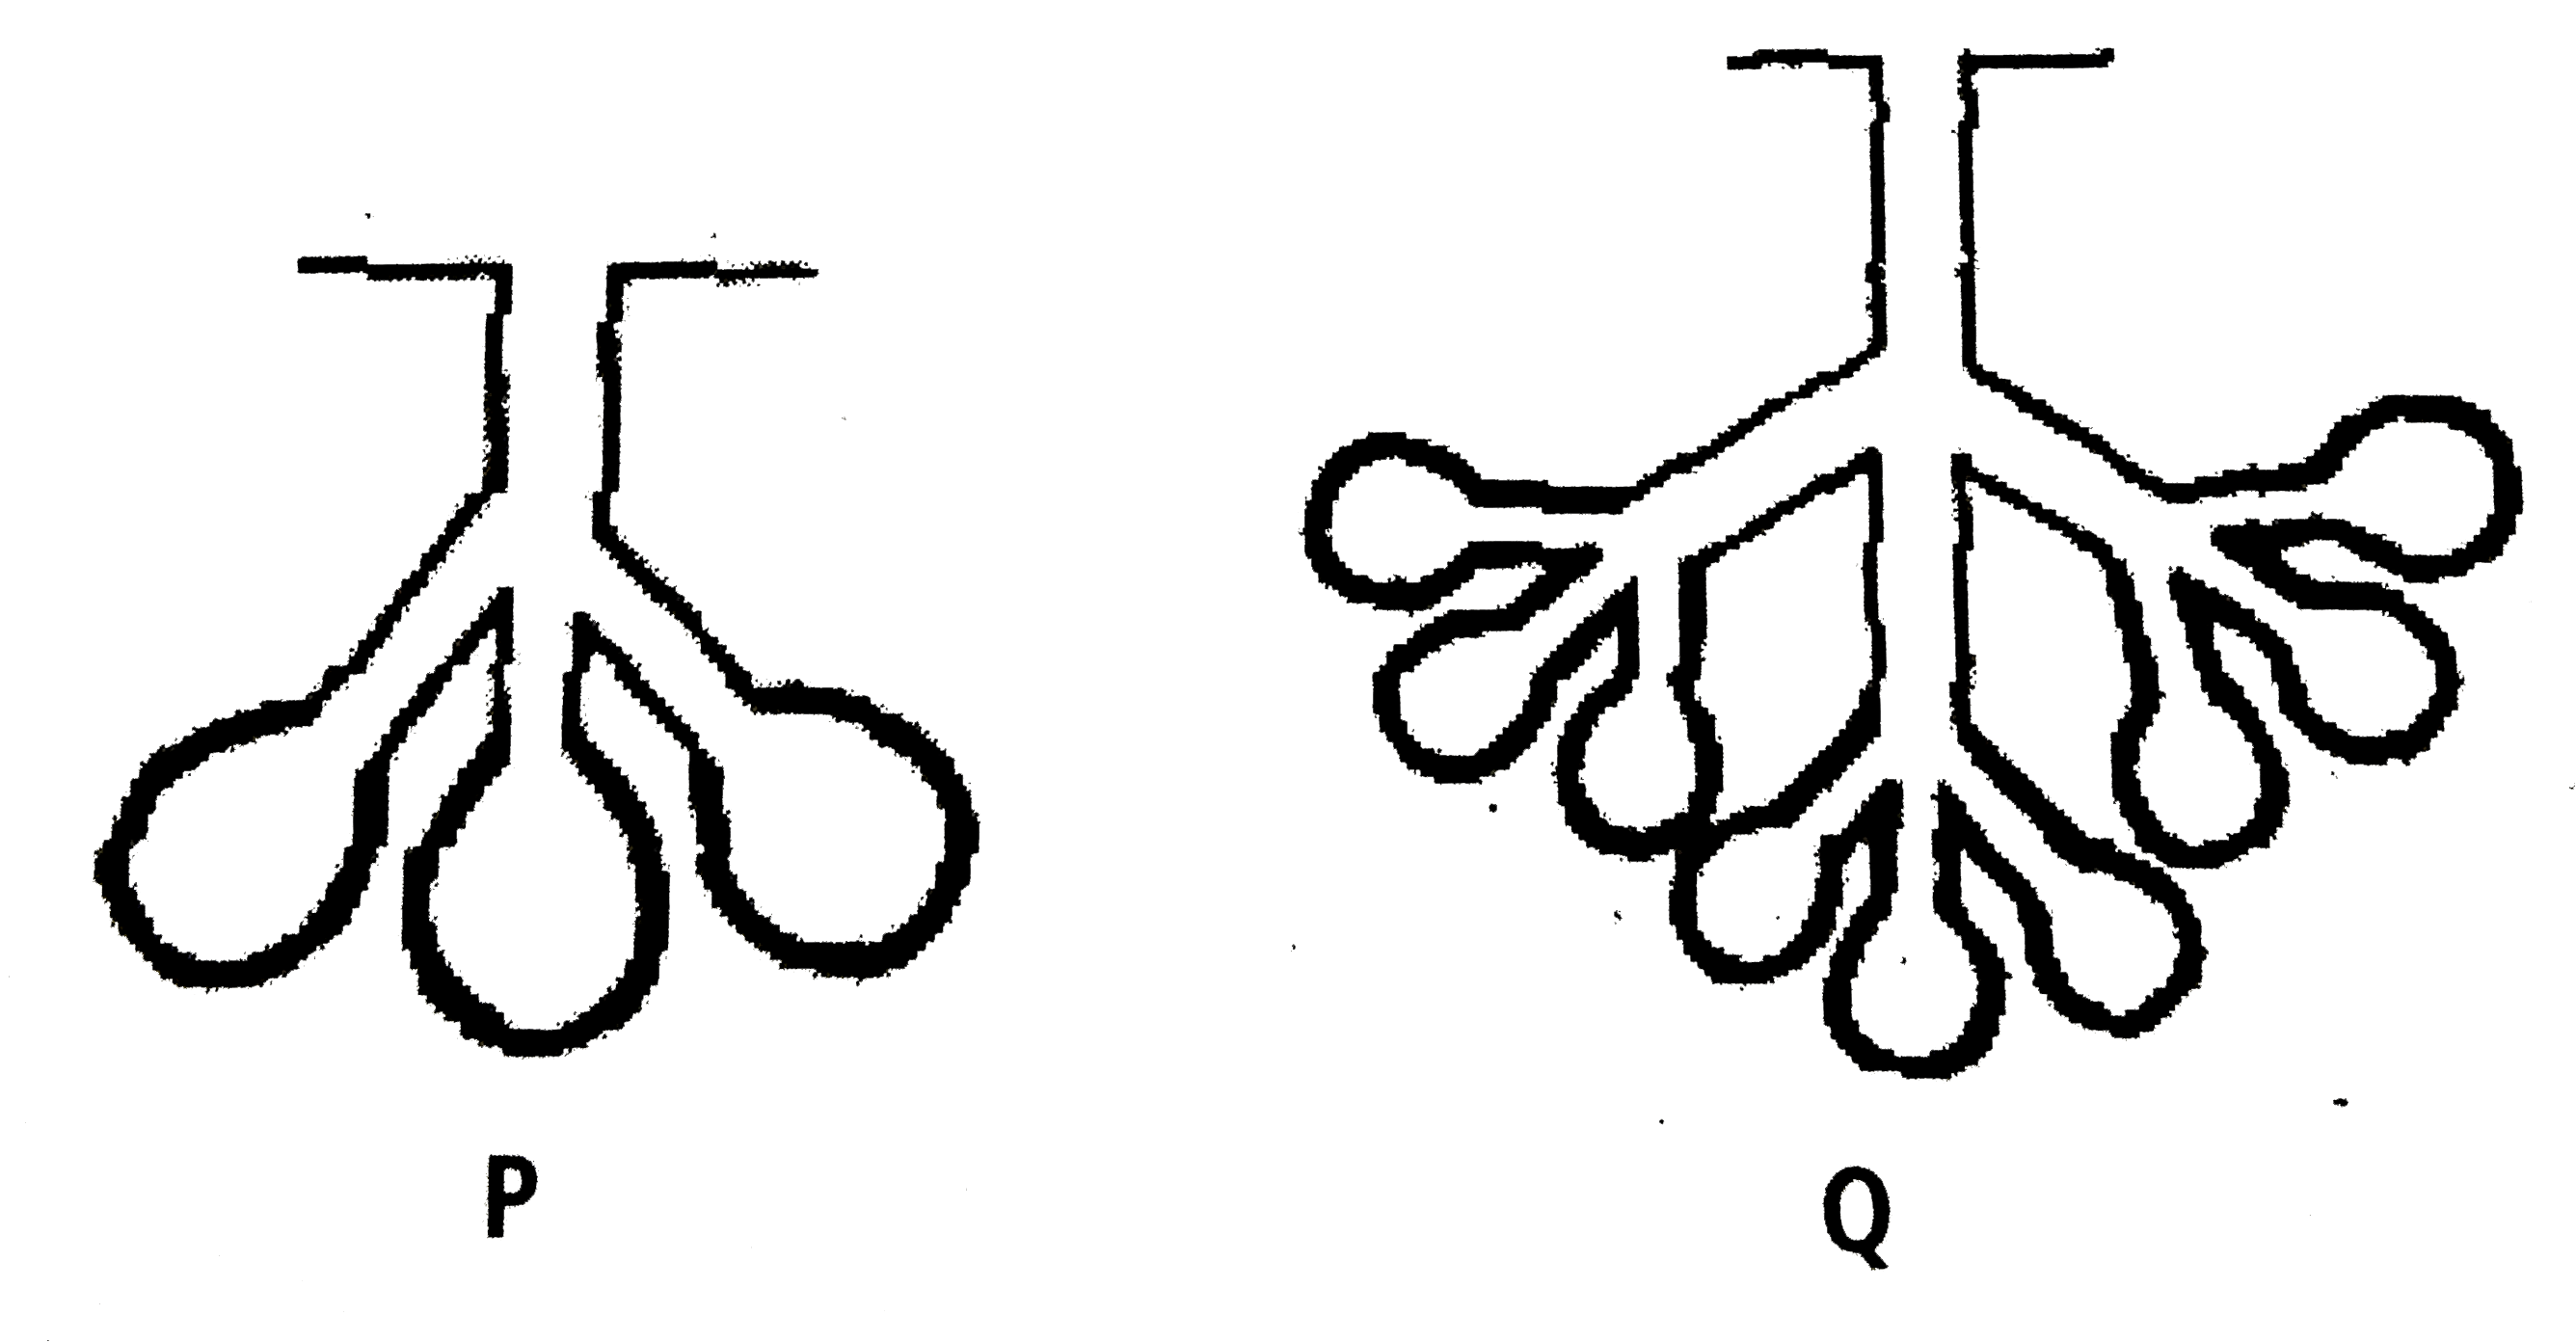
Which of the following statements regarding these glands is not correct ?
View Solution
