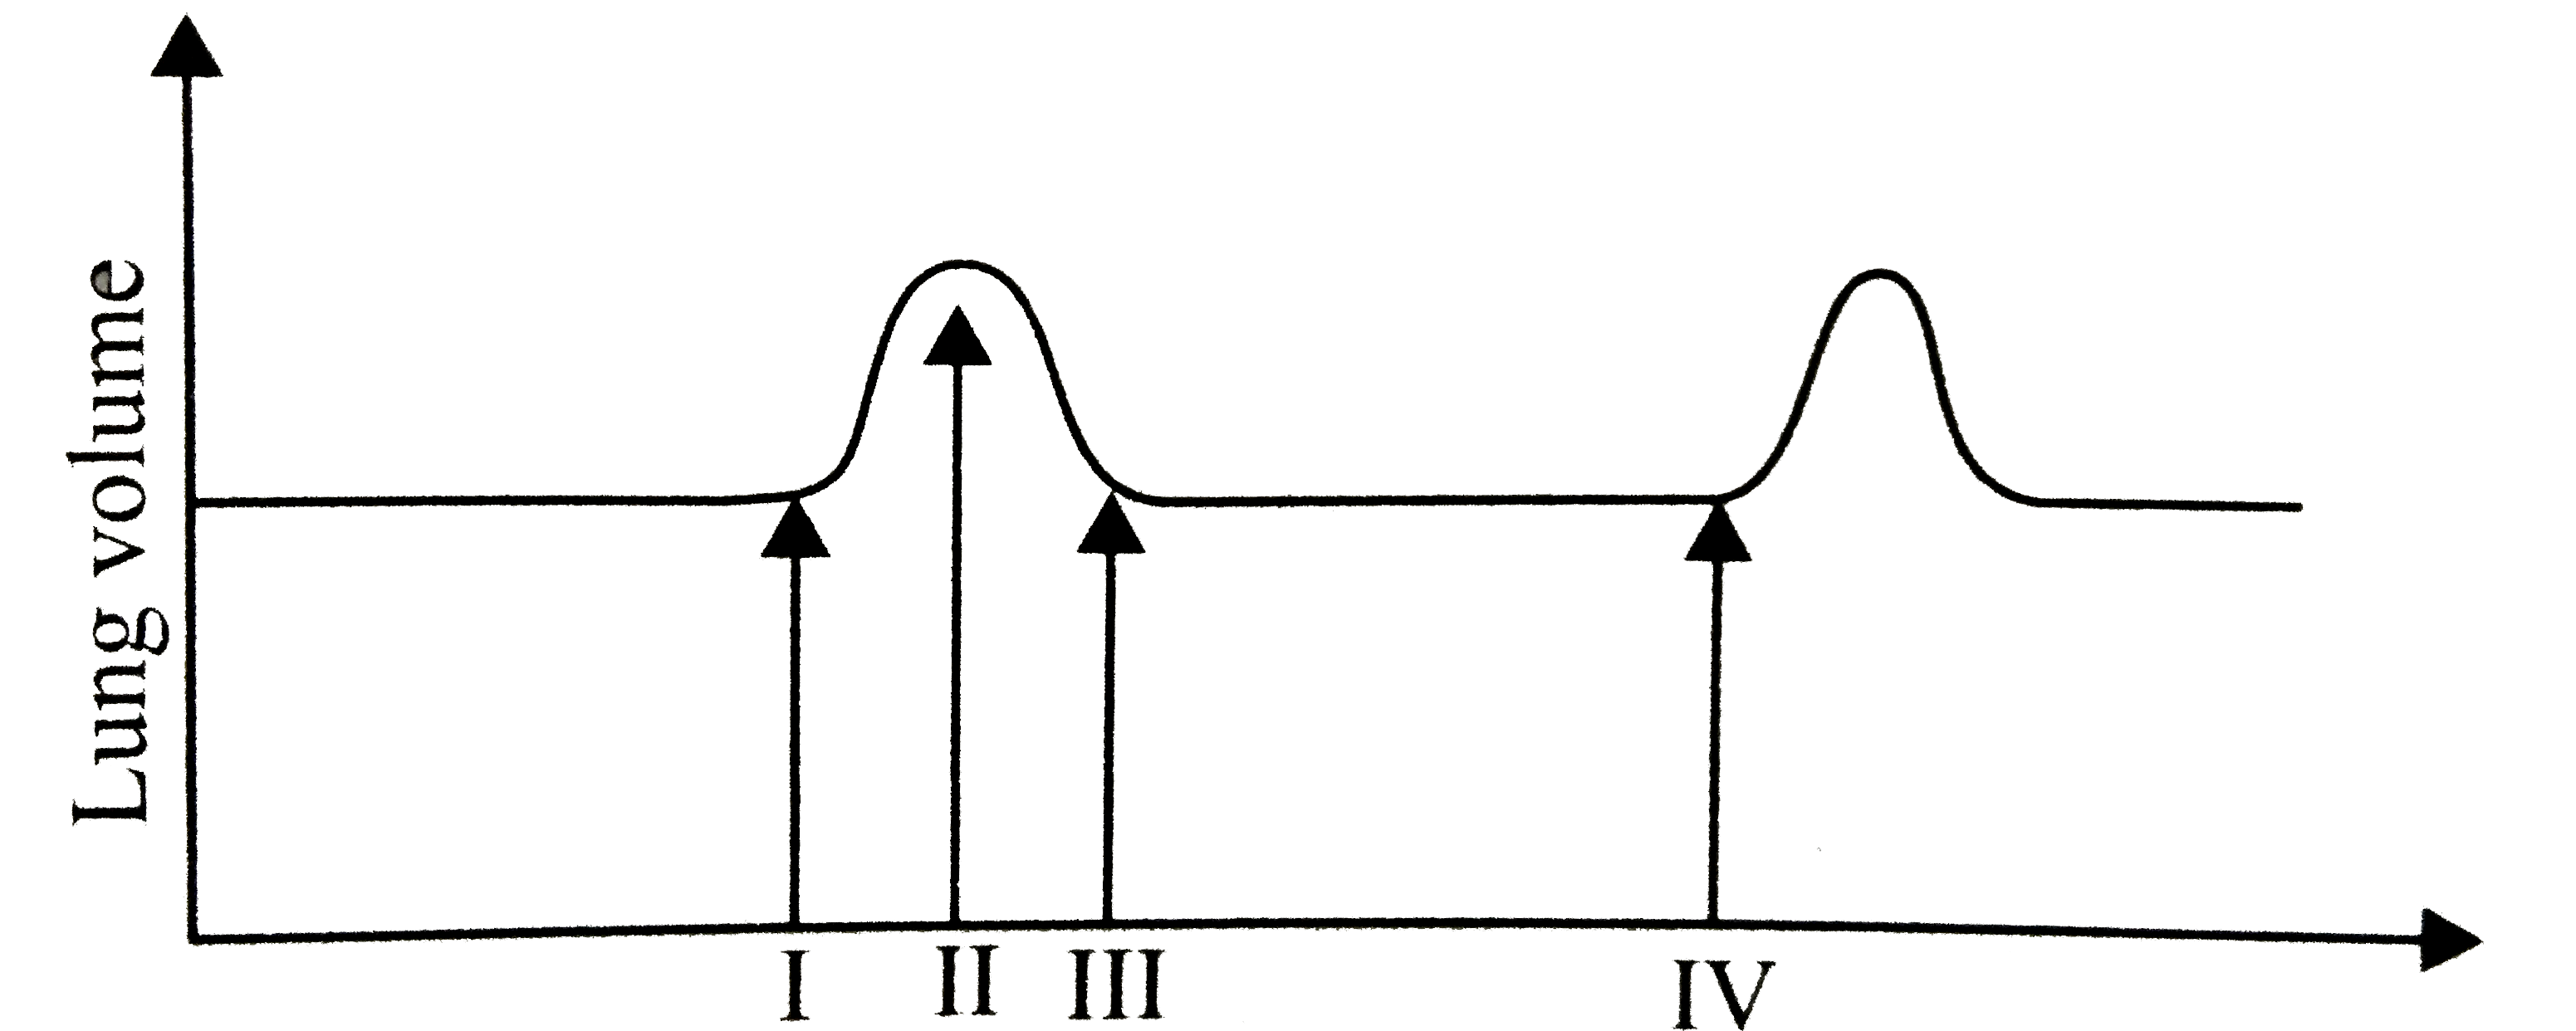
The given figure illustrates the changes in lung volume during the process of breathing.

The changes from II to III indicates the
movement of diaphragm away from the lungs
expansion of the thoracic cavity
movement of air out of the lungs
expansion of ribs.
The correct Answer is:C
The change from II to III indicates decrease in the volume of lungs and thus, increase in the pressure of air inside the lungs. This results in movement of air out of the lungs.
Topper's Solved these Questions
- BREATHING AND EXCHANGE OF GASESBook:NCERT FINGERTPS ENGLISHChapter:BREATHING AND EXCHANGE OF GASESExercise:Higher Order Thinking
Explore 12 Videos
- BREATHING AND EXCHANGE OF GASESBook:NCERT FINGERTPS ENGLISHChapter:BREATHING AND EXCHANGE OF GASESExercise:Exemplar Problems
Explore 13 Videos
- BODY FLUIDS AND CIRCULATIONBook:NCERT FINGERTPS ENGLISHChapter:BODY FLUIDS AND CIRCULATIONExercise:Body Fluids And Circulation
Explore 151 Videos
- CELL - THE UNIT OF LIFEBook:NCERT FINGERTPS ENGLISHChapter:CELL - THE UNIT OF LIFEExercise:Cell - The Unit Of Life
Explore 159 Videos
Similar Questions
Knowledge Check
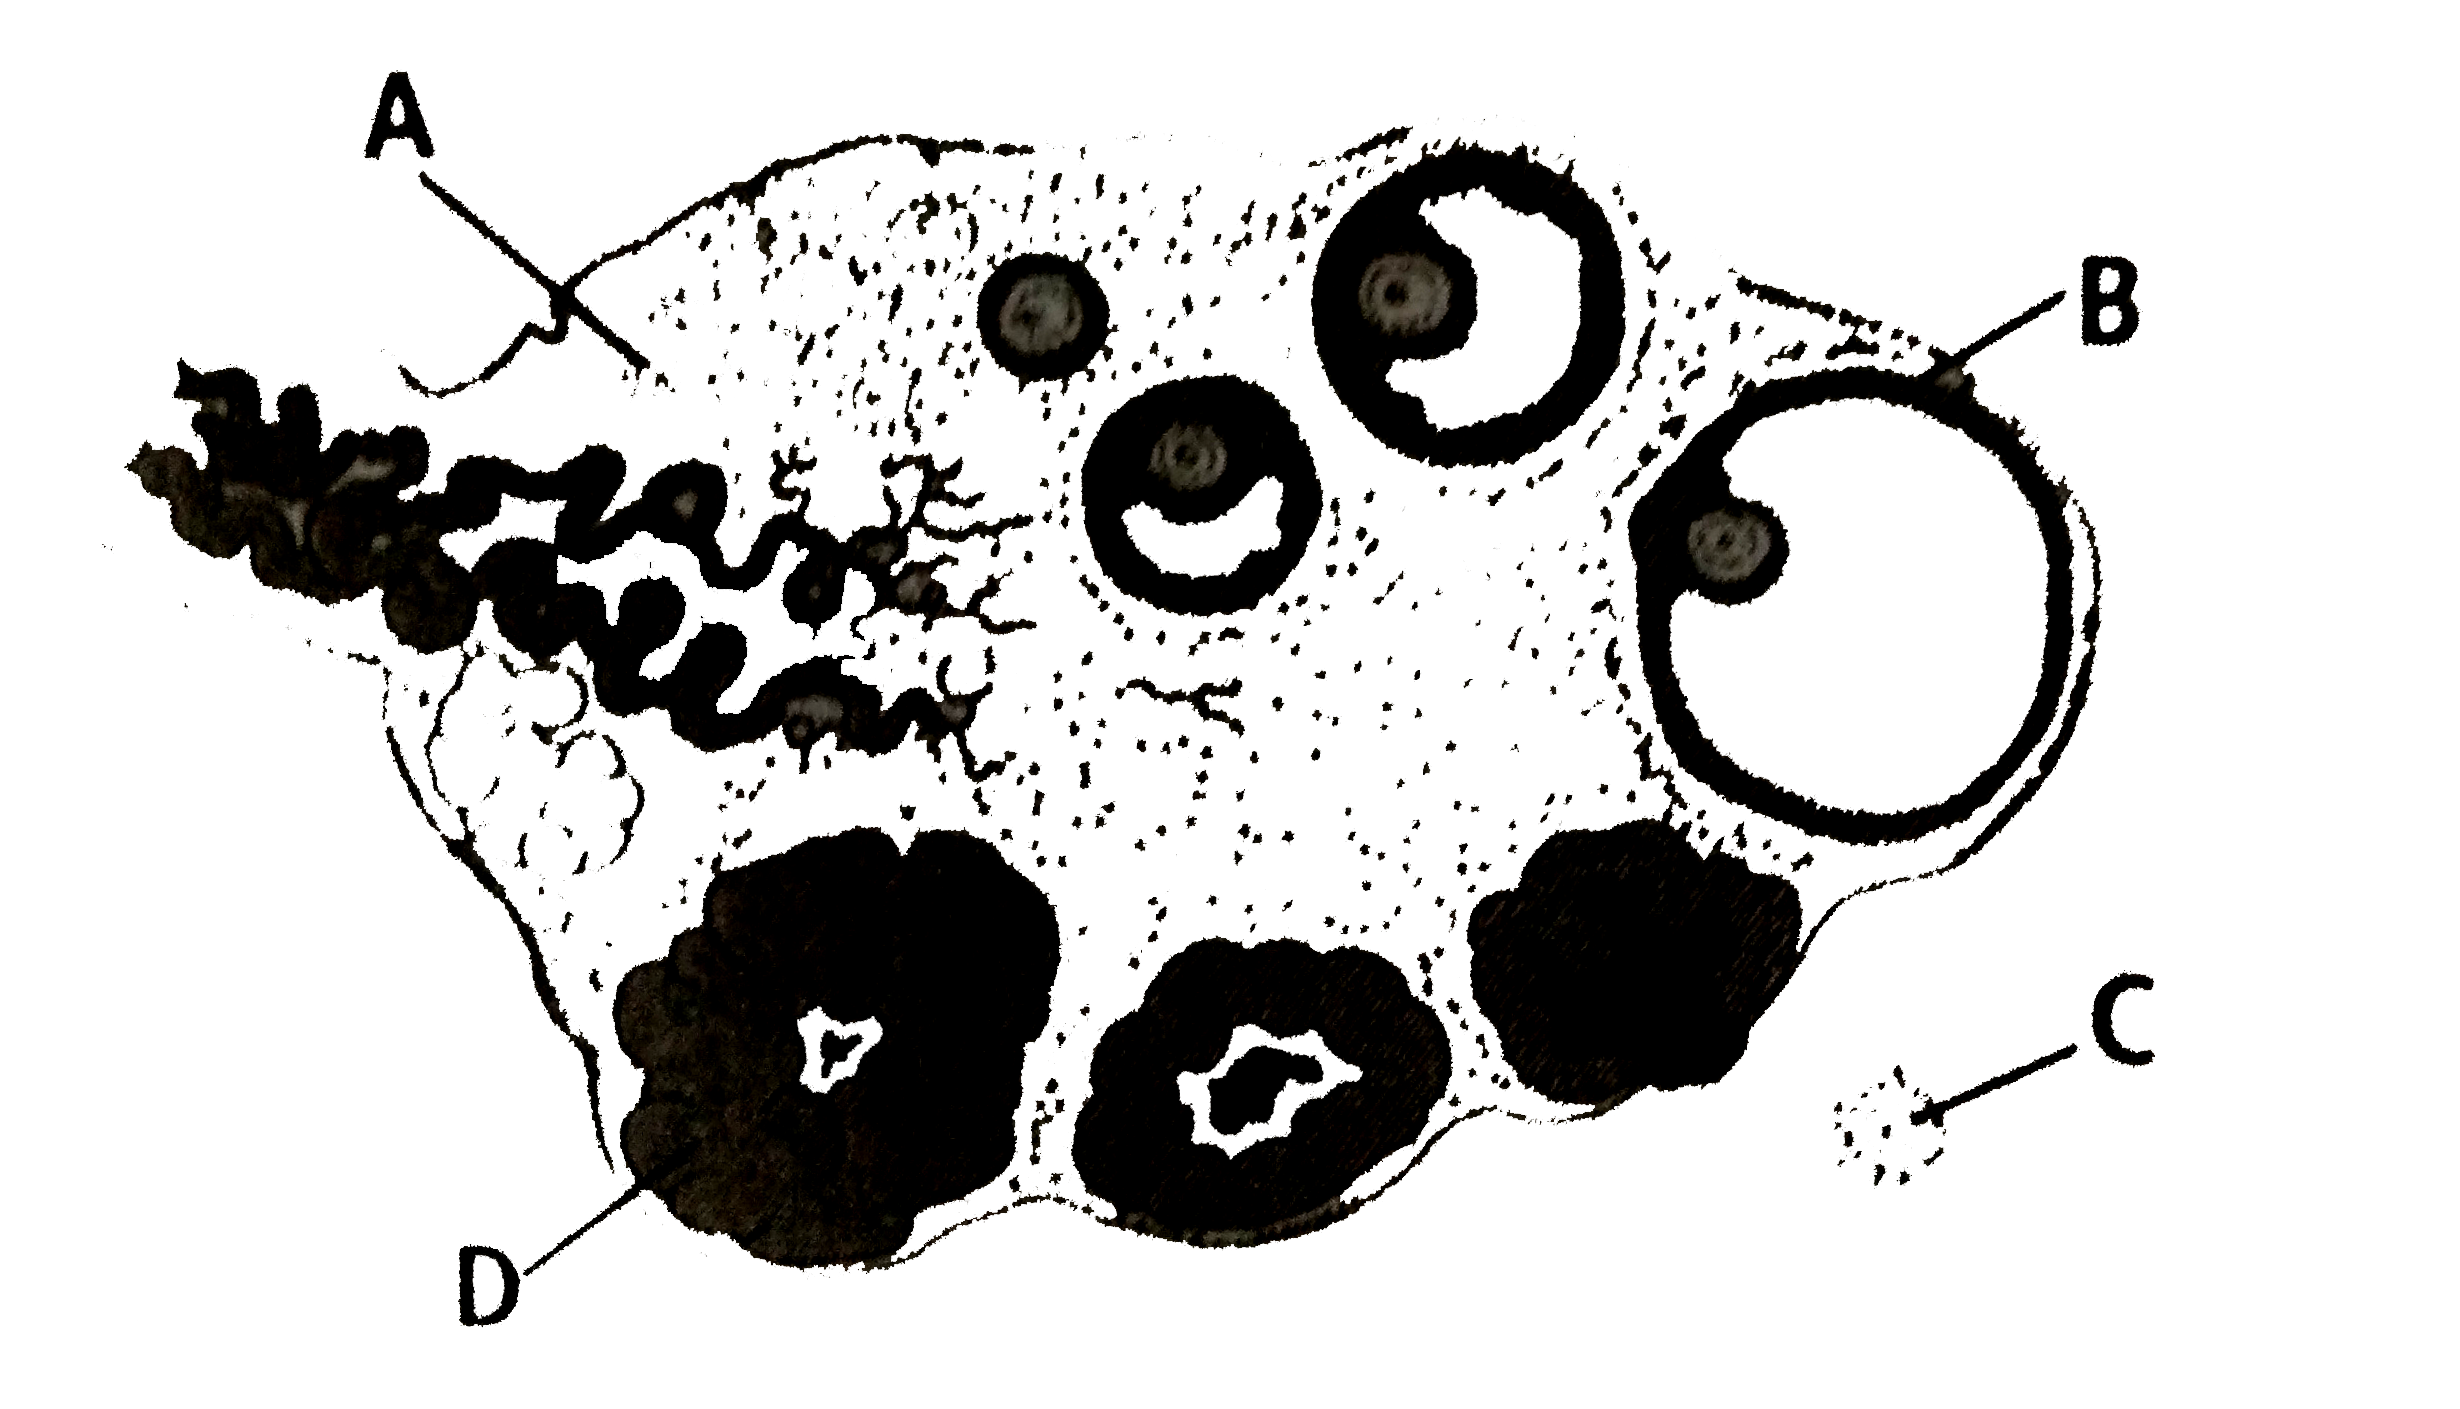
The given figure illustrates montly changes in the human ovary during the reproduction cycle.

Which of the following statements most accurately describes each structure?ABefore puberty, the oocyte (A) does not start the process of meiosis.BThe hormone produced by by structure (B) causes thinning of the uterine cervical mucus to allow passage of sperms.CDuring ovulation, structure (C) stays at the interphase between meiosis I and meiosis II.DThe hormone produced by structure (D) stimulates the pituitary gland to secrete luteinising hormone.During the course of the story, the man changes from _________ .
Abeing haughty to being helpless.Bbeing rational to being spiritual.Cbeing heartless to being caring.Dbeing courageous to being fearfulDuring the process of ecological succession, the changes that take place in communities are
Aorderly and sequentialBrandomCvery quickDnot influenced by the physical enviroment.
During the process of ecological succession the changes that take place in communities are
View SolutionDuring the process of ecological succession the changes that take place in communities are
View SolutionDuring the process of ecological succession, the changes that take place in communities are
View SolutionBreathing, an important step of the respiratory system, is a two-part process involving-inhalation and exhalation. During the process of breathing, the thorax region shows some changes. Identify the statement/s from below that is/are related to the exhalation process.
I. External intercostal muscles contract
II. Pressure in the lungs increases
III. Diaphragm contracts
IV. The volume of thorax decreases
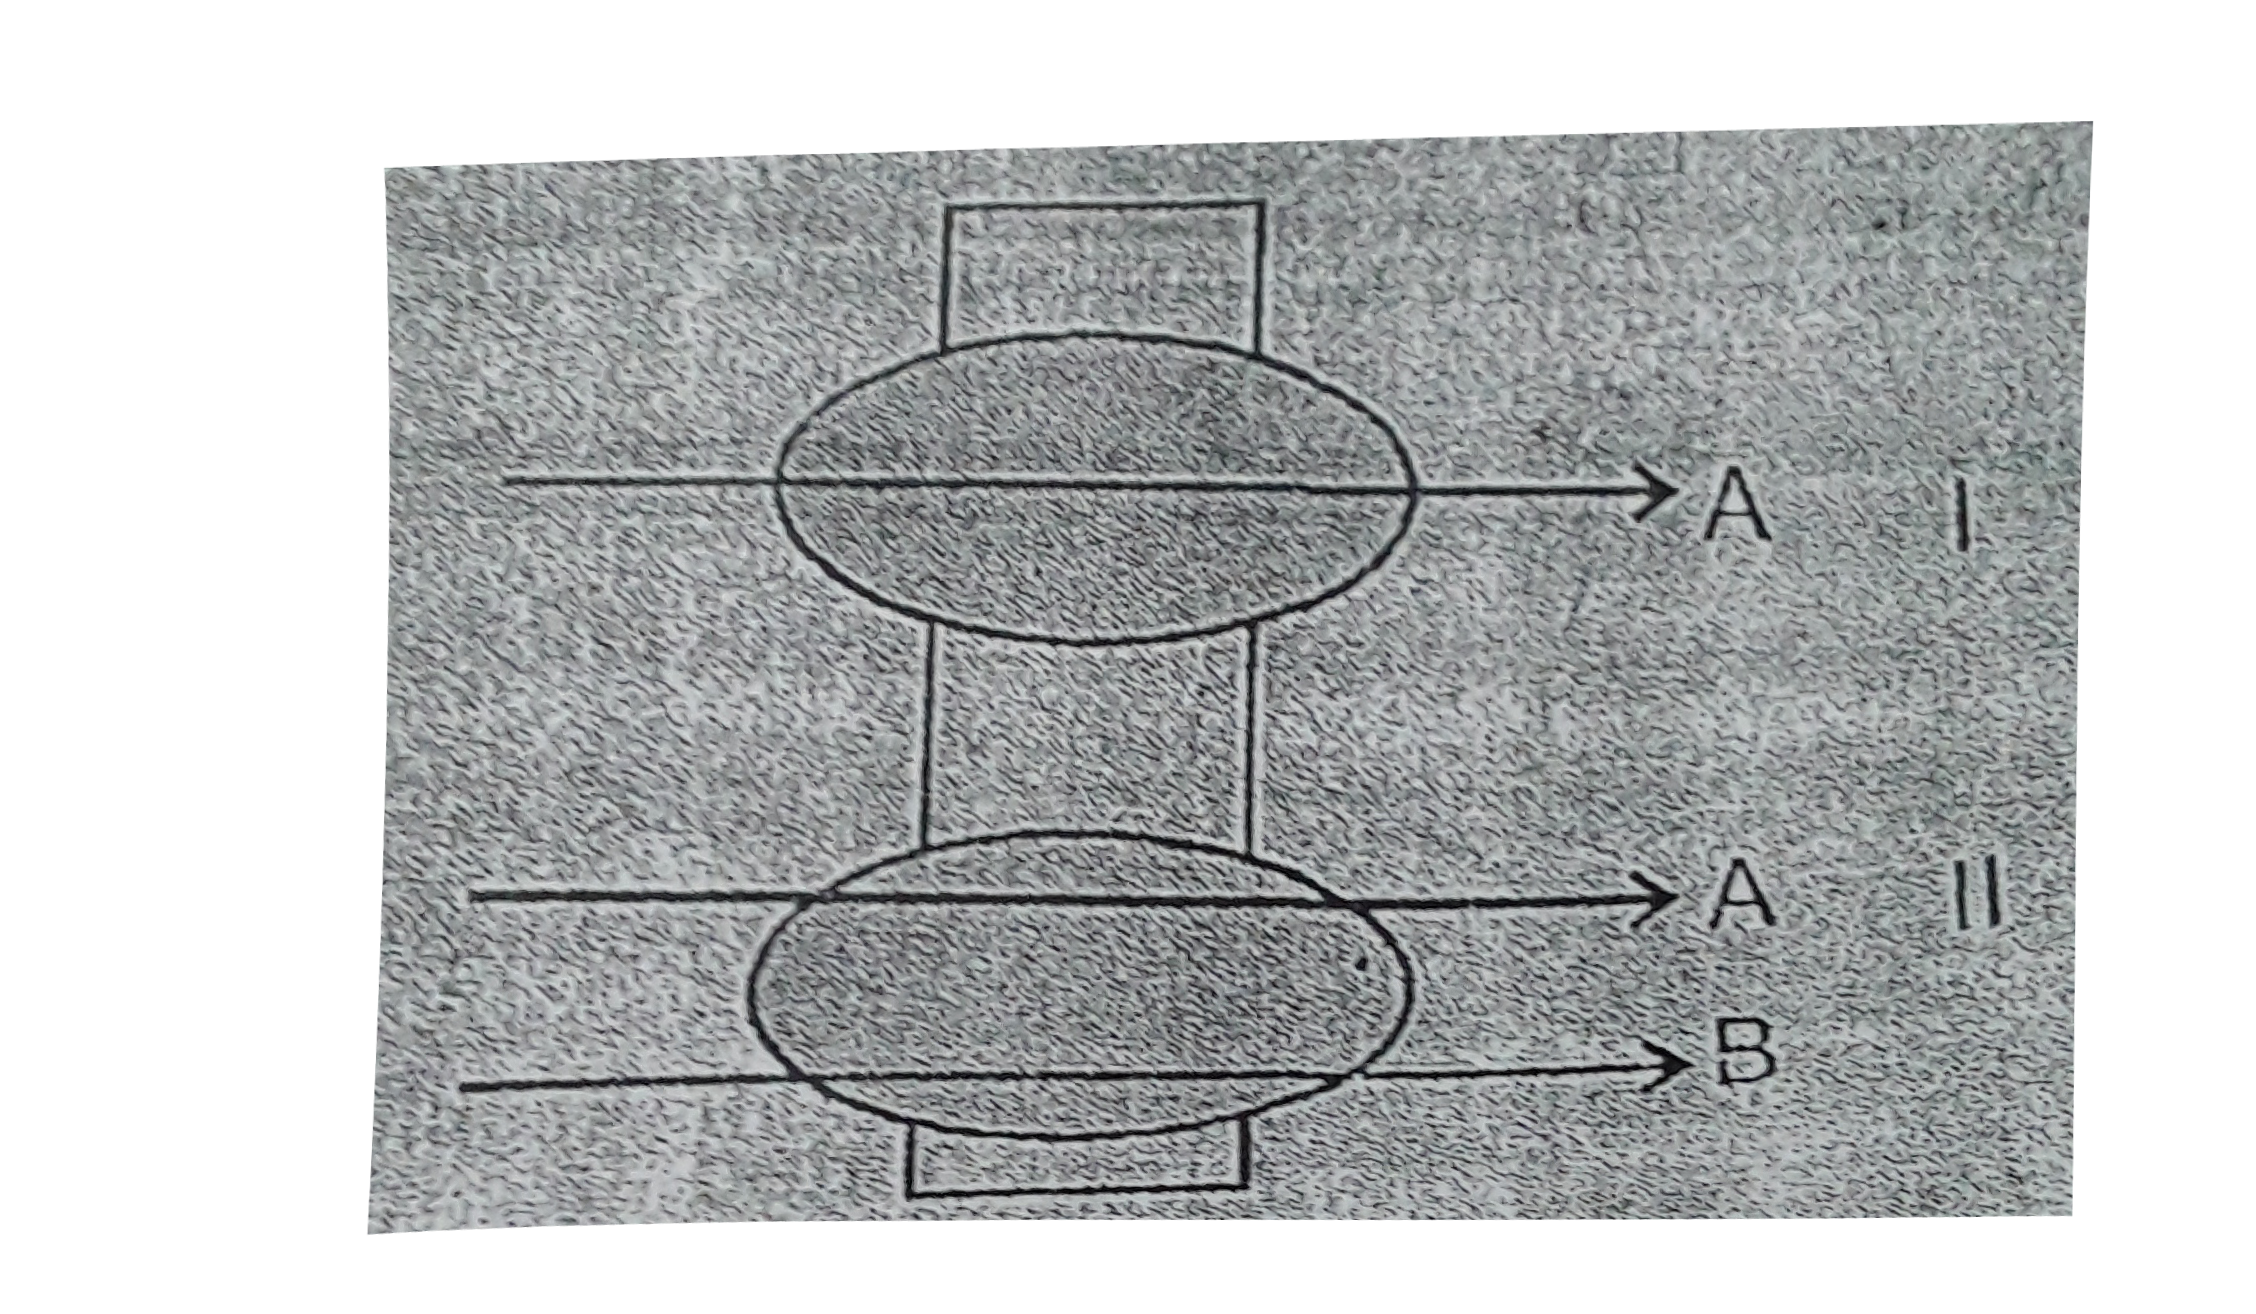
View SolutionObserve the given figure and identify the process (I) and (II)

View Solution

