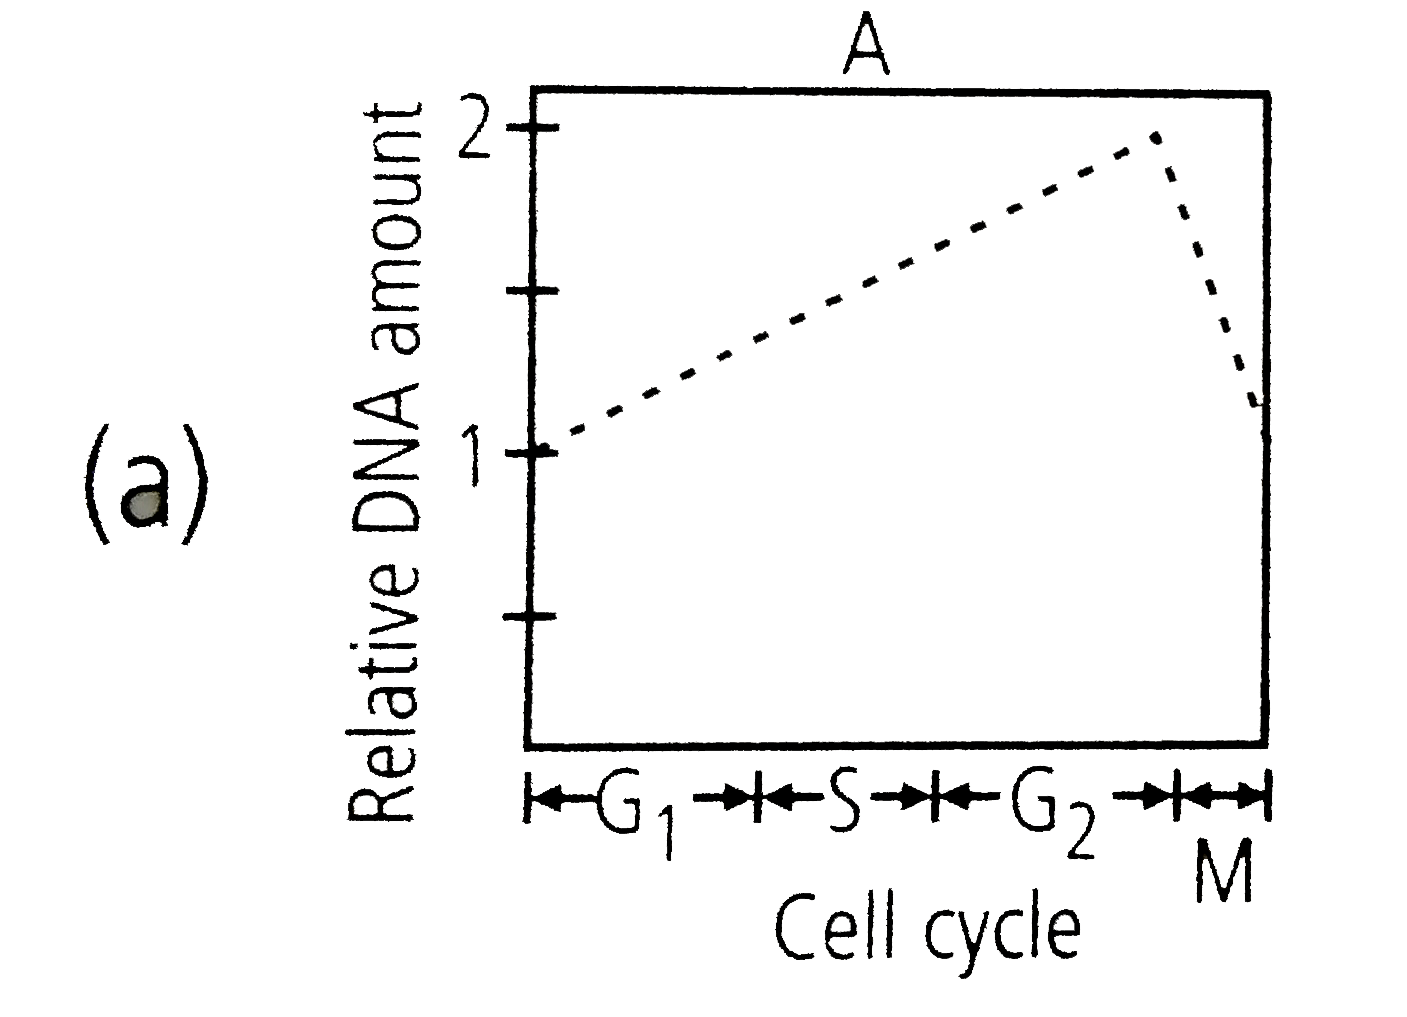
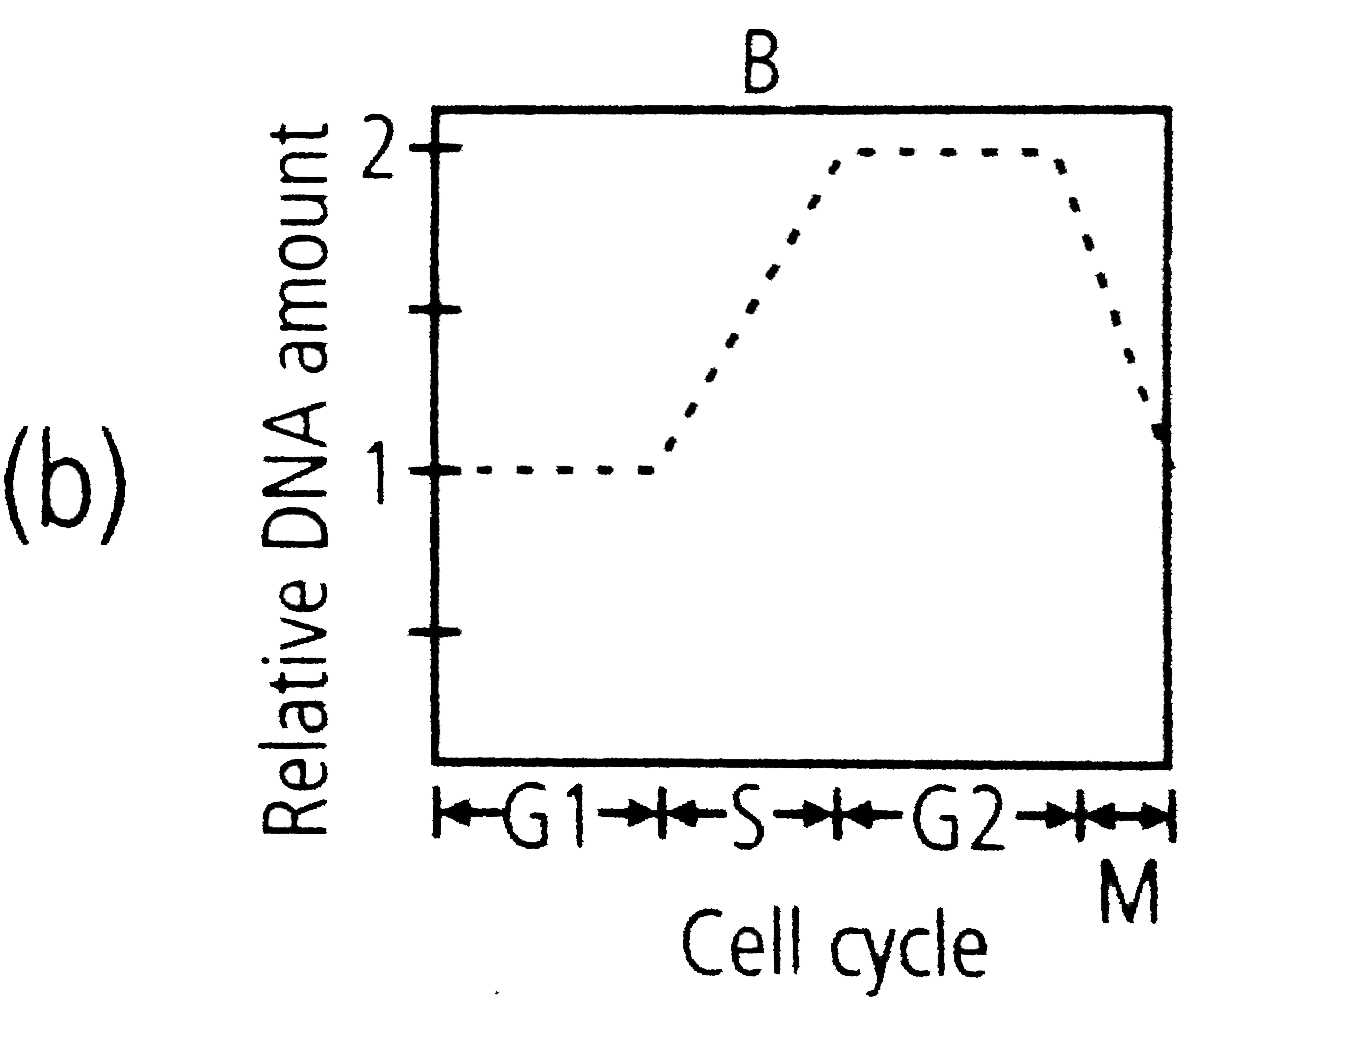
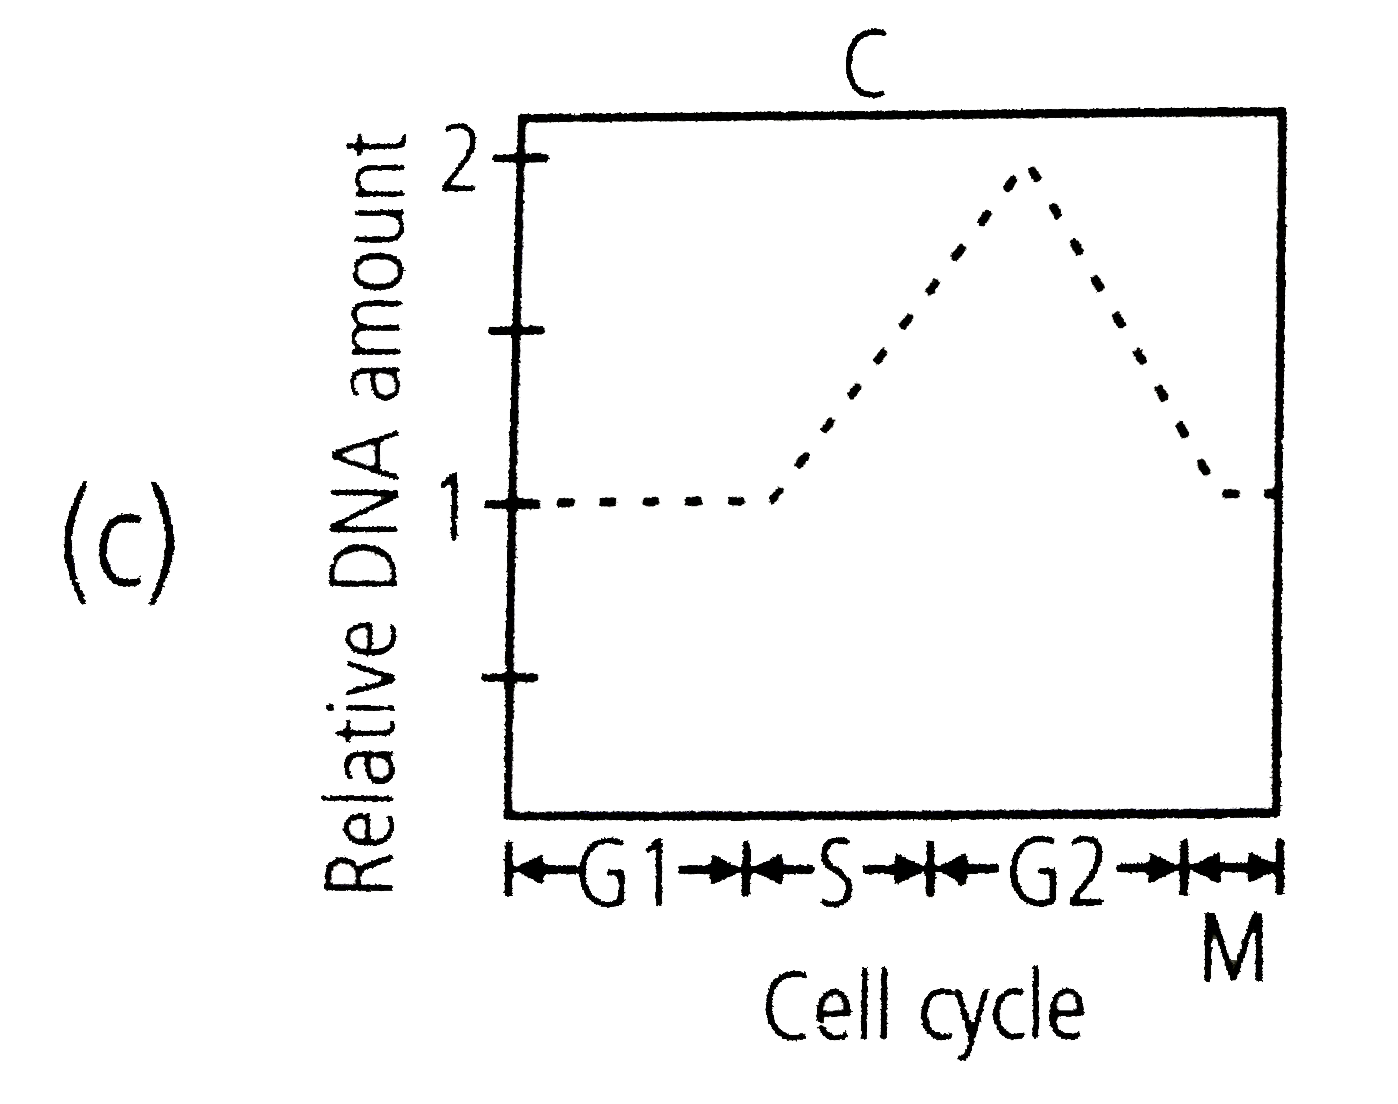
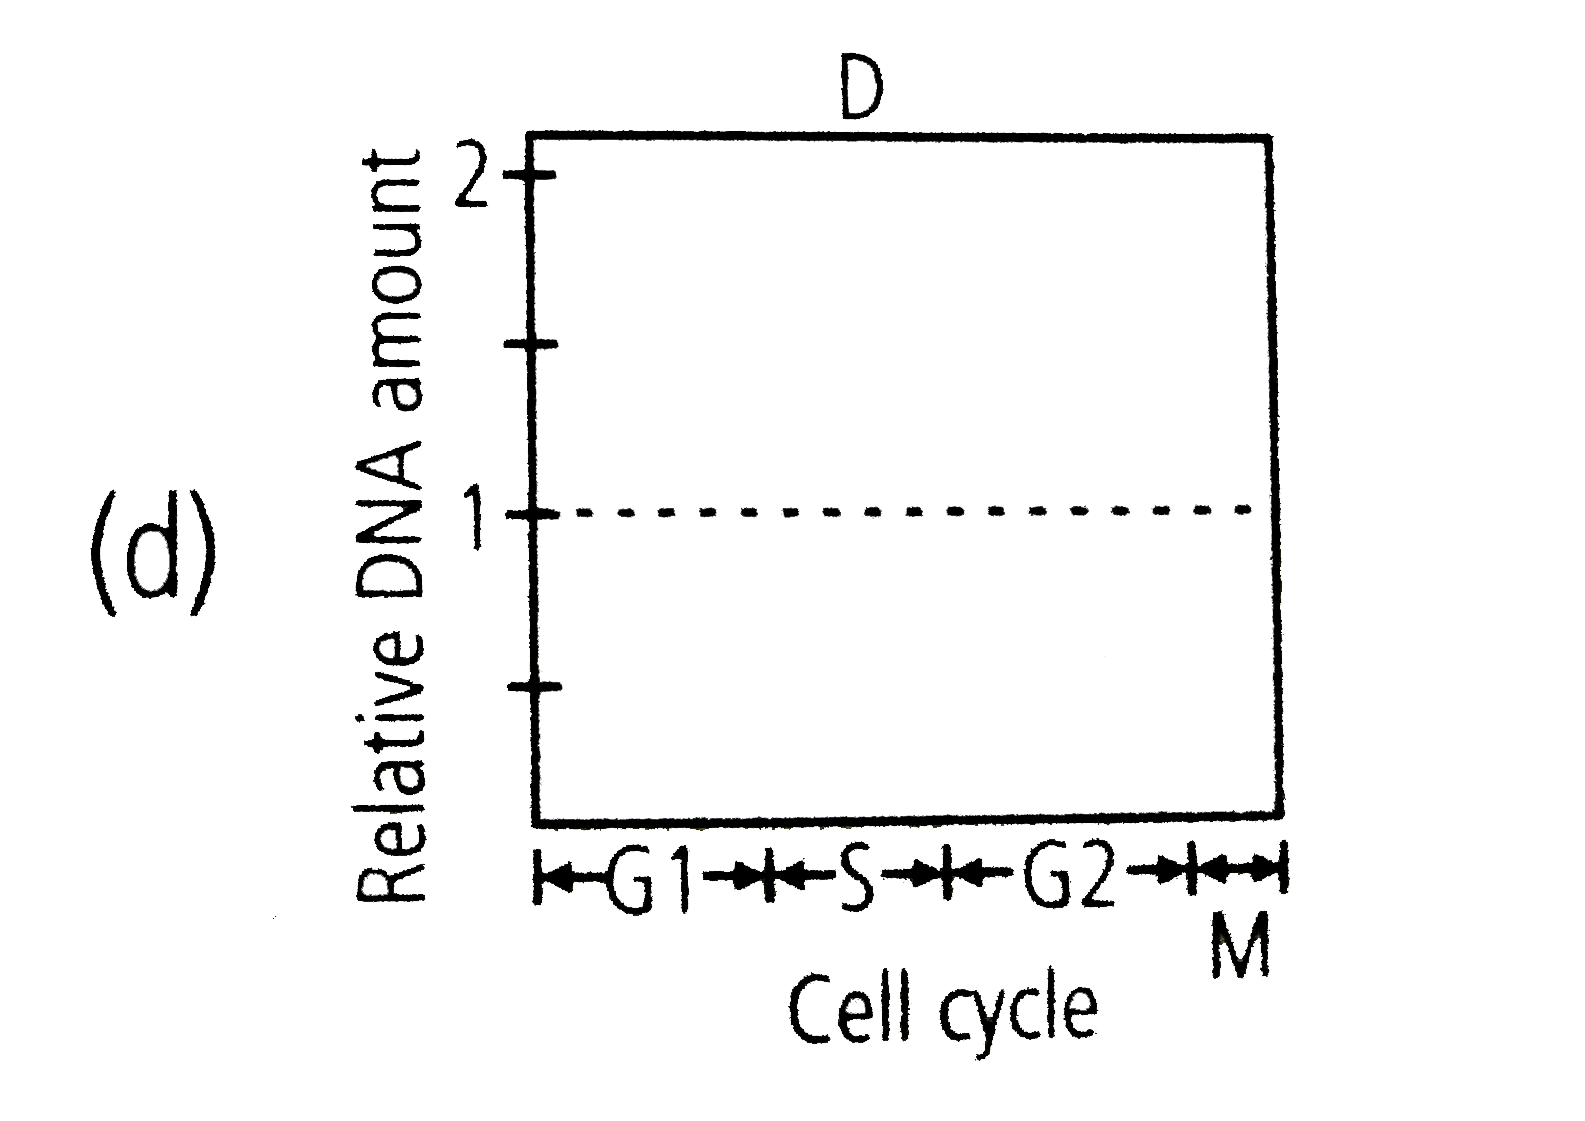
Which of the following graphs shows the relative change in the amount of mitochondrial DNA of a cell undergoing mitosis?


The correct Answer is:A
To determine which graph shows the relative change in the amount of mitochondrial DNA of a cell undergoing mitosis, we can follow these steps:
1. Understand Mitochondrial DNA: Mitochondrial DNA (mtDNA) is a small circular chromosome found within mitochondria, the organelles responsible for energy production in cells. It is inherited maternally.
2. Mitochondrial Replication: Mitochondria have their own replication cycle, which is independent of the cell cycle. This means that the amount of mitochondrial DNA can change independently of the cell's mitotic process.
3. Cell Cycle Phases: During the cell cycle, particularly in mitosis, the cell divides into two daughter cells. However, the replication of mitochondrial DNA occurs during the interphase, specifically during the S phase, when DNA replication occurs.
4. Graph Analysis: When analyzing the graphs provided, we need to look for a graph that indicates an increase in mitochondrial DNA during the S phase and a relatively stable amount during mitosis.
5. Identify the Correct Graph: The correct graph will show an increase in mitochondrial DNA during the interphase (before mitosis) and a plateau or slight decrease during the actual mitotic phase, as the cell is dividing and the mitochondria are being distributed to the daughter cells.
6. Conclusion: Based on the analysis, the graph that shows an increase in mitochondrial DNA during interphase and a stable or slightly decreased amount during mitosis is the correct answer. In this case, the correct option is graph A.
Topper's Solved these Questions
- CELL CYCLE AND CELL DIVISIONBook:NCERT FINGERTPS ENGLISHChapter:CELL CYCLE AND CELL DIVISIONExercise:NCERT
Explore 10 Videos
- CELL CYCLE AND CELL DIVISIONBook:NCERT FINGERTPS ENGLISHChapter:CELL CYCLE AND CELL DIVISIONExercise:CORNER
Explore 15 Videos
- CELL CYCLE AND CELL DIVISIONBook:NCERT FINGERTPS ENGLISHChapter:CELL CYCLE AND CELL DIVISIONExercise:MITOSIS
Explore 37 Videos
- CELL - THE UNIT OF LIFEBook:NCERT FINGERTPS ENGLISHChapter:CELL - THE UNIT OF LIFEExercise:Cell - The Unit Of Life
Explore 159 Videos
- CHEMICAL COORDINATION AND INTEGRATIONBook:NCERT FINGERTPS ENGLISHChapter:CHEMICAL COORDINATION AND INTEGRATIONExercise:All Questions
Explore 126 Videos
Similar Questions
Knowledge Check
Which of the following is not a stage of mitosis?
AAnaphaseBMetaphaseCInterphaseDProphase
Which is absent in Mitochondrial DNA ?
View SolutionWhich of the following sets of cell organelles contain DNA :-
View SolutionWhich of the following undergoes change in mutation :-
View SolutionWhich of the following graphs shows the type of natural selection which favours polymorphisms ?
View SolutionWhich of the following systems undergoes maximum changes in frog during metamorphosis?
View SolutionWhich of the following is not a significance of mitosis?
View SolutionName a few conditions when cells undergo mitosis.
View Solution

