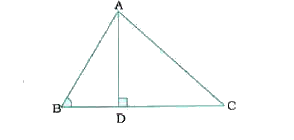
In the given figure, ABC is a Deltain which ∠ABC<90∘ and AD⊥BC. Prove that AC2=AB2+BC2−2BC⋅BD
 Solution in Gujrati
The correct Answer is:AC2=AB2+BC2−2BC⋅BD
Step by step video, text & image solution for In the given figure, ABC is a Deltain which /_ABC lt 90^(@)" and "AD bot BC. Prove that AC^(2)= AB^(2)+BC^(2)-2BC*BD by Maths experts to help you in doubts & scoring excellent marks in Class 10 exams.
Topper's Solved these Questions
- BOOK - KUMAR PRAKASHANCHAPTER - TRIANGLESEXERCISE - TEST YOUR SKILLS29videos
TRIANGLES
- BOOK - KUMAR PRAKASHANCHAPTER - TRIANGLESEXERCISE - PRACTICE THOROUGHLY20videos
TRIANGLES
- BOOK - KUMAR PRAKASHANCHAPTER - TRIANGLESEXERCISE - EXERCISE 6.523videos
TRIANGLES
- BOOK - KUMAR PRAKASHANCHAPTER - SURFACE AREAS AND VOLUMESEXERCISE - TEST YOUR SKILLS5videos
SURFACE AREAS AND VOLUMES
Similar Questions
In the given figure, DE||BC and PE||DC. If AP= 4 cm and PB= 12 cm, find AD.
 02:11View Solution
In ΔABC, D and E are points on the sides AB and AC respectively such that DE∣∣BC. If AB=6.75cm,AC=8.50cm and EC=6.80cm. Then find BD.
01:31View SolutionSides of triangles are given below, Determine which of them are right triangles. In case of a right triangle, write the length of its hypotenuse :
7 cm, 24 cm, 25 cm02:46View SolutionThe slant height of a frustum of a cone is 4 m and the perimeter of circular ends are 18 m and 16 m. Find the cost of painting its curved surface at 10 per sq. m.
02:45View SolutionDetermine the point of symmetry of a regular hexagon.
02:17View SolutionDtermine the images of the following figure about the given line :
05:41View SolutionIn the figure above (not to scale), ¯¯¯¯¯¯AB⊥¯¯¯¯¯¯CDandAD is the bisector of ∠BAE.AB=3cm and AC=5cm. Find CD.
02:21View SolutionMatch the following Column A to Column B
 02:03View Solution
Match the following Column A to Column B
 02:10View Solution
Match the following Column A to Column B
 02:17View Solution
Find the area of the figure given below.
 02:10View Solution
The area of the shaded part in the figure given below is ______.
 04:23View Solution
The inequation represented by the graph given below is :
01:13View SolutionThe inequation that best describes the graph given below is _________
01:19View SolutionThe inequation that best describes the following graph is _________
03:10View SolutionWhich inequations represent the shaded region in the given figure
01:38View Solution
