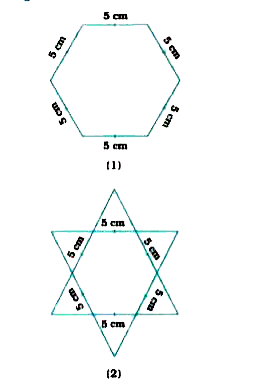
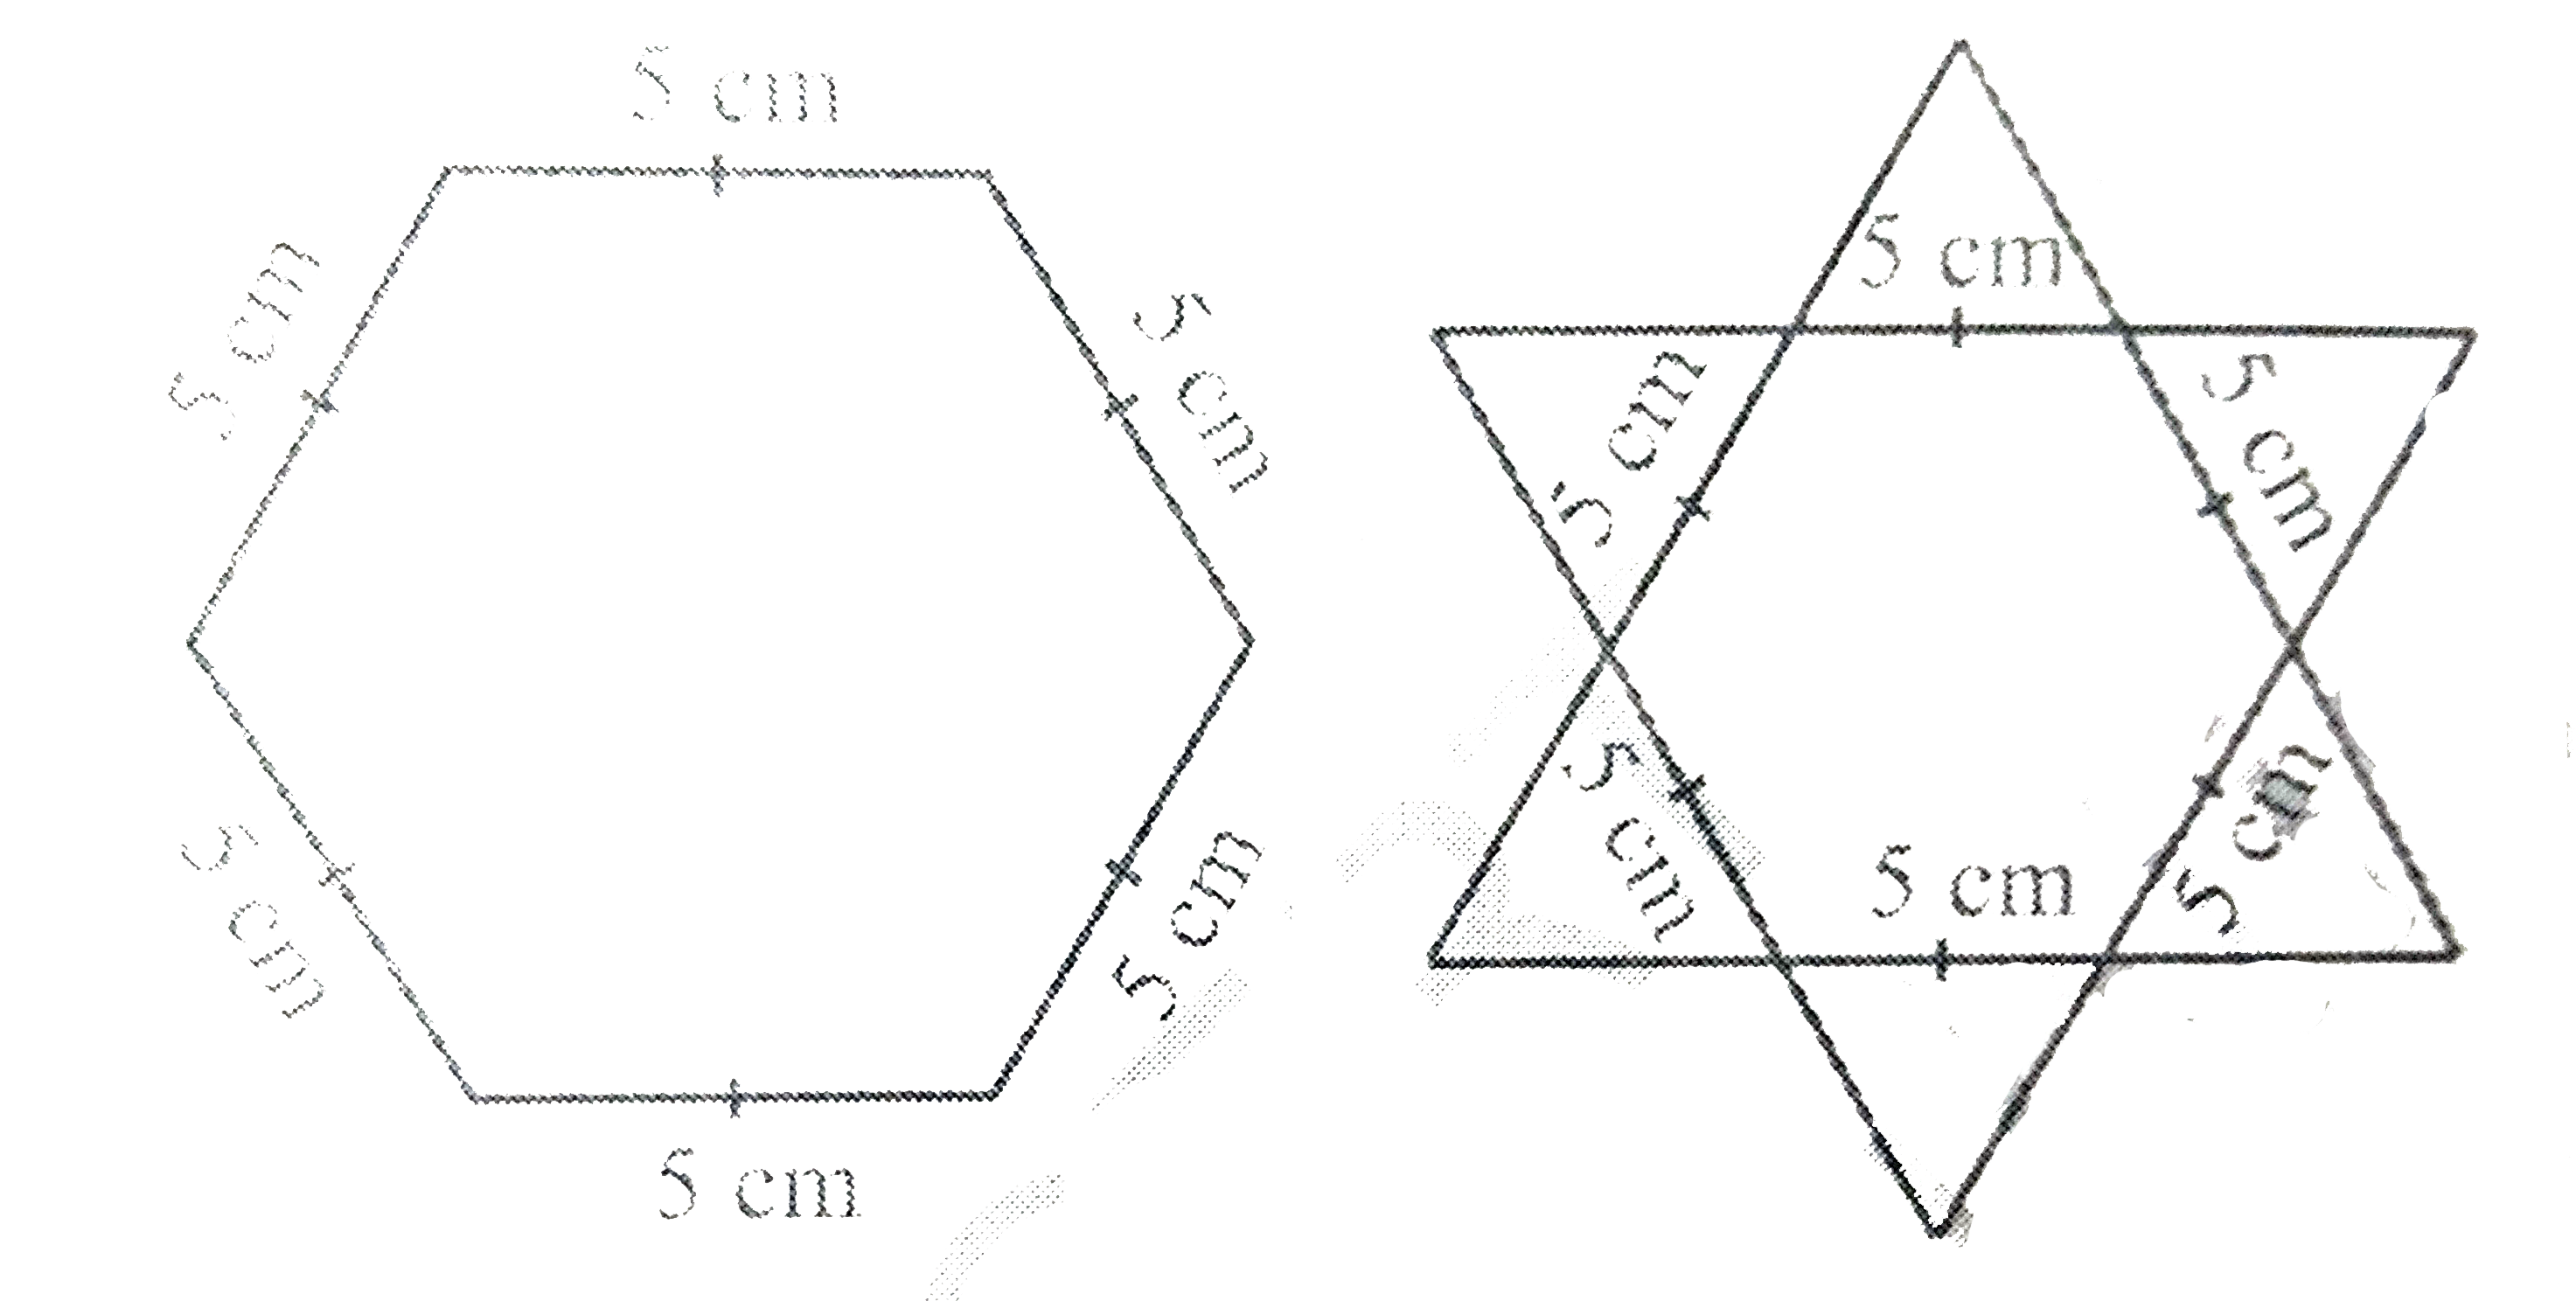
Complete the hexagonal and star shaped Rangolies [see figure (1) and (2) by filling them with as many equilateral triangles of side 1 cm as you can. Count the number of triangles in each case. Which has more triangles ?
 Solution in Gujrati
The correct Answer is:150 triangles
Step by step video, text & image solution for Complete the hexagonal and star shaped Rangolies [see figure (1) and (2) by filling them with as many equilateral triangles of side 1 cm as you can. Count the number of triangles in each case. Which has more triangles ? by Maths experts to help you in doubts & scoring excellent marks in Class 9 exams.
Updated on:21/07/2023Topper's Solved these Questions
- TRIANGLESBook:KUMAR PRAKASHANChapter:TRIANGLESExercise:SKILL TESTING EXERCISE
Explore 20 Videos
- TRIANGLESBook:KUMAR PRAKASHANChapter:TRIANGLESExercise:MULTIPLE CHOICE QUESTIONS
Explore 15 Videos
- TRIANGLESBook:KUMAR PRAKASHANChapter:TRIANGLESExercise:EXERCISE 7.4
Explore 6 Videos
- SURFACE AREAS AND VOLUMESBook:KUMAR PRAKASHANChapter:SURFACE AREAS AND VOLUMESExercise:MULTIPLE CHOICE QUESTIONS
Explore 18 Videos
Similar Questions
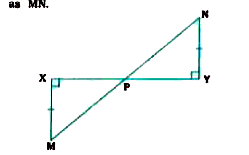
In the given figure, XM and YN are both < perpendicular to line segment XY and XM = YN. 4 Prove that P is the midpoint of XY as well as MN

View SolutionIn △ABC,∠A=∠C,AC=5 and BC = 4. Then, the perimeter of △ ABC is ..........
View SolutionShow that in a right angled triangle, the hypotenuse is the longest side.
View SolutionThe total surface area of a cuboid with length 20 cm, breadth 15 cm and height 10 cm is ……… cm2.
View SolutionComplete the hexagonal and star shaped Rangolies [see Fig. 7.53 (i) and (ii)] by filling them with as many equilateral triangles of side 1 cm as you can. Count the number of triangles in each case. Which has more triangles?

View SolutionHow many lines of symmetry does the above figure have ?
View SolutionDetermine the point of symmetry of a regular hexagon.
View SolutionDtermine the images of the following figure about the given line :
View SolutionMatch the following Column A to Column B

View SolutionMatch the following Column A to Column B

View SolutionMatch the following Column A to Column B

View SolutionThe inequation represented by the graph given below is :
View SolutionThe inequation that best describes the graph given below is _________
View SolutionThe inequation that best describes the following graph is _________
View SolutionWhich inequations represent the shaded region in the given figure
View Solution

