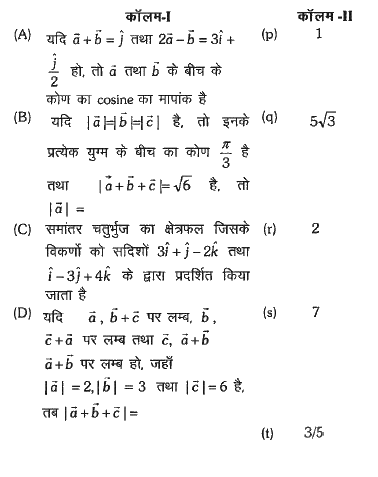
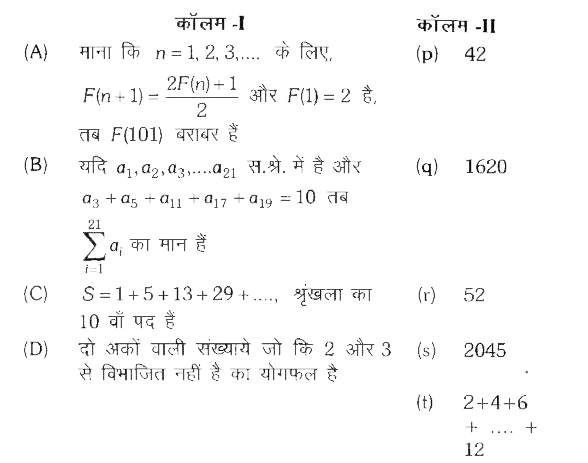
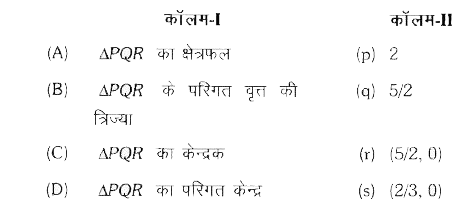
कॉलम 'I' को कॉलम 'II' के साथ मिलाकर सही जोड़े बनाइए

The correct Answer is:A→t;B⊤;C→q;D→s
Step by step video, text & image solution for कॉलम 'I' को कॉलम 'II' के साथ मिलाकर सही जोड़े बनाइए by Maths experts to help you in doubts & scoring excellent marks in Class 12 exams.
Updated on:21/07/2023Topper's Solved these Questions
- सदिश बीजगणित BOOK - ERRORLESS HINDICHAPTER - सदिश बीजगणित EXERCISE - JEE Advanced (Integer type questions)
16 Videos
- श्रेणियाँ BOOK - ERRORLESS HINDICHAPTER - श्रेणियाँ EXERCISE - JEE ADVANCED (MATRIX MATCH TYPE QUESTIONS)
1 Videos
- समकोणीय कार्तीय निर्देशांक BOOK - ERRORLESS HINDICHAPTER - समकोणीय कार्तीय निर्देशांक EXERCISE - JEE ADVANCED (MORE THAN ONE CORRECT ANSWERS) (MATRIX MATCH TYPE QUESTIONS)
1 Videos
Similar Questions
मानाकि O मूलबिन्दु है एवं त्रिभुज PQR की भुजाओं −−→QR,−−→RP,−−→PQ, की दिशाओं में तीन एकांक सदिश क्रमश: −−→OX,−−→OY,−−→OZ हैं |
∣∣∣−−→OX×−−→OY∣∣∣=
View Solutionनिम्नलिखित कॉलम I को कॉलम II से मिलाये

View Solutionपरवलय y2=4x पर स्थित बिन्दुओं P,Q तथा R से अभिलंब खींचे जाते है जो कि (3,0) पर प्रतिच्छेद करते है। तब, कॉलम I में दी गयी स्थितियों/व्यंजकों का कॉलम ॥ में दिए गए वक्तव्यों से सुमेल करें:

View SolutionHow many lines of symmetry does the above figure have ?
View SolutionWhich of the following are correct chain isomers of butane ? (i)
View SolutionDetermine the point of symmetry of a regular hexagon.
View SolutionDtermine the images of the following figure about the given line :
View SolutionMatch the following Column A to Column B

View SolutionMatch the following Column A to Column B

View SolutionMatch the following Column A to Column B

View SolutionFind the area of the figure given below.

View SolutionThe area of the shaded part in the figure given below is ______.

View SolutionThe inequation represented by the graph given below is :
View SolutionThe inequation that best describes the graph given below is _________
View SolutionThe inequation that best describes the following graph is _________
View SolutionWhich inequations represent the shaded region in the given figure
View Solution
