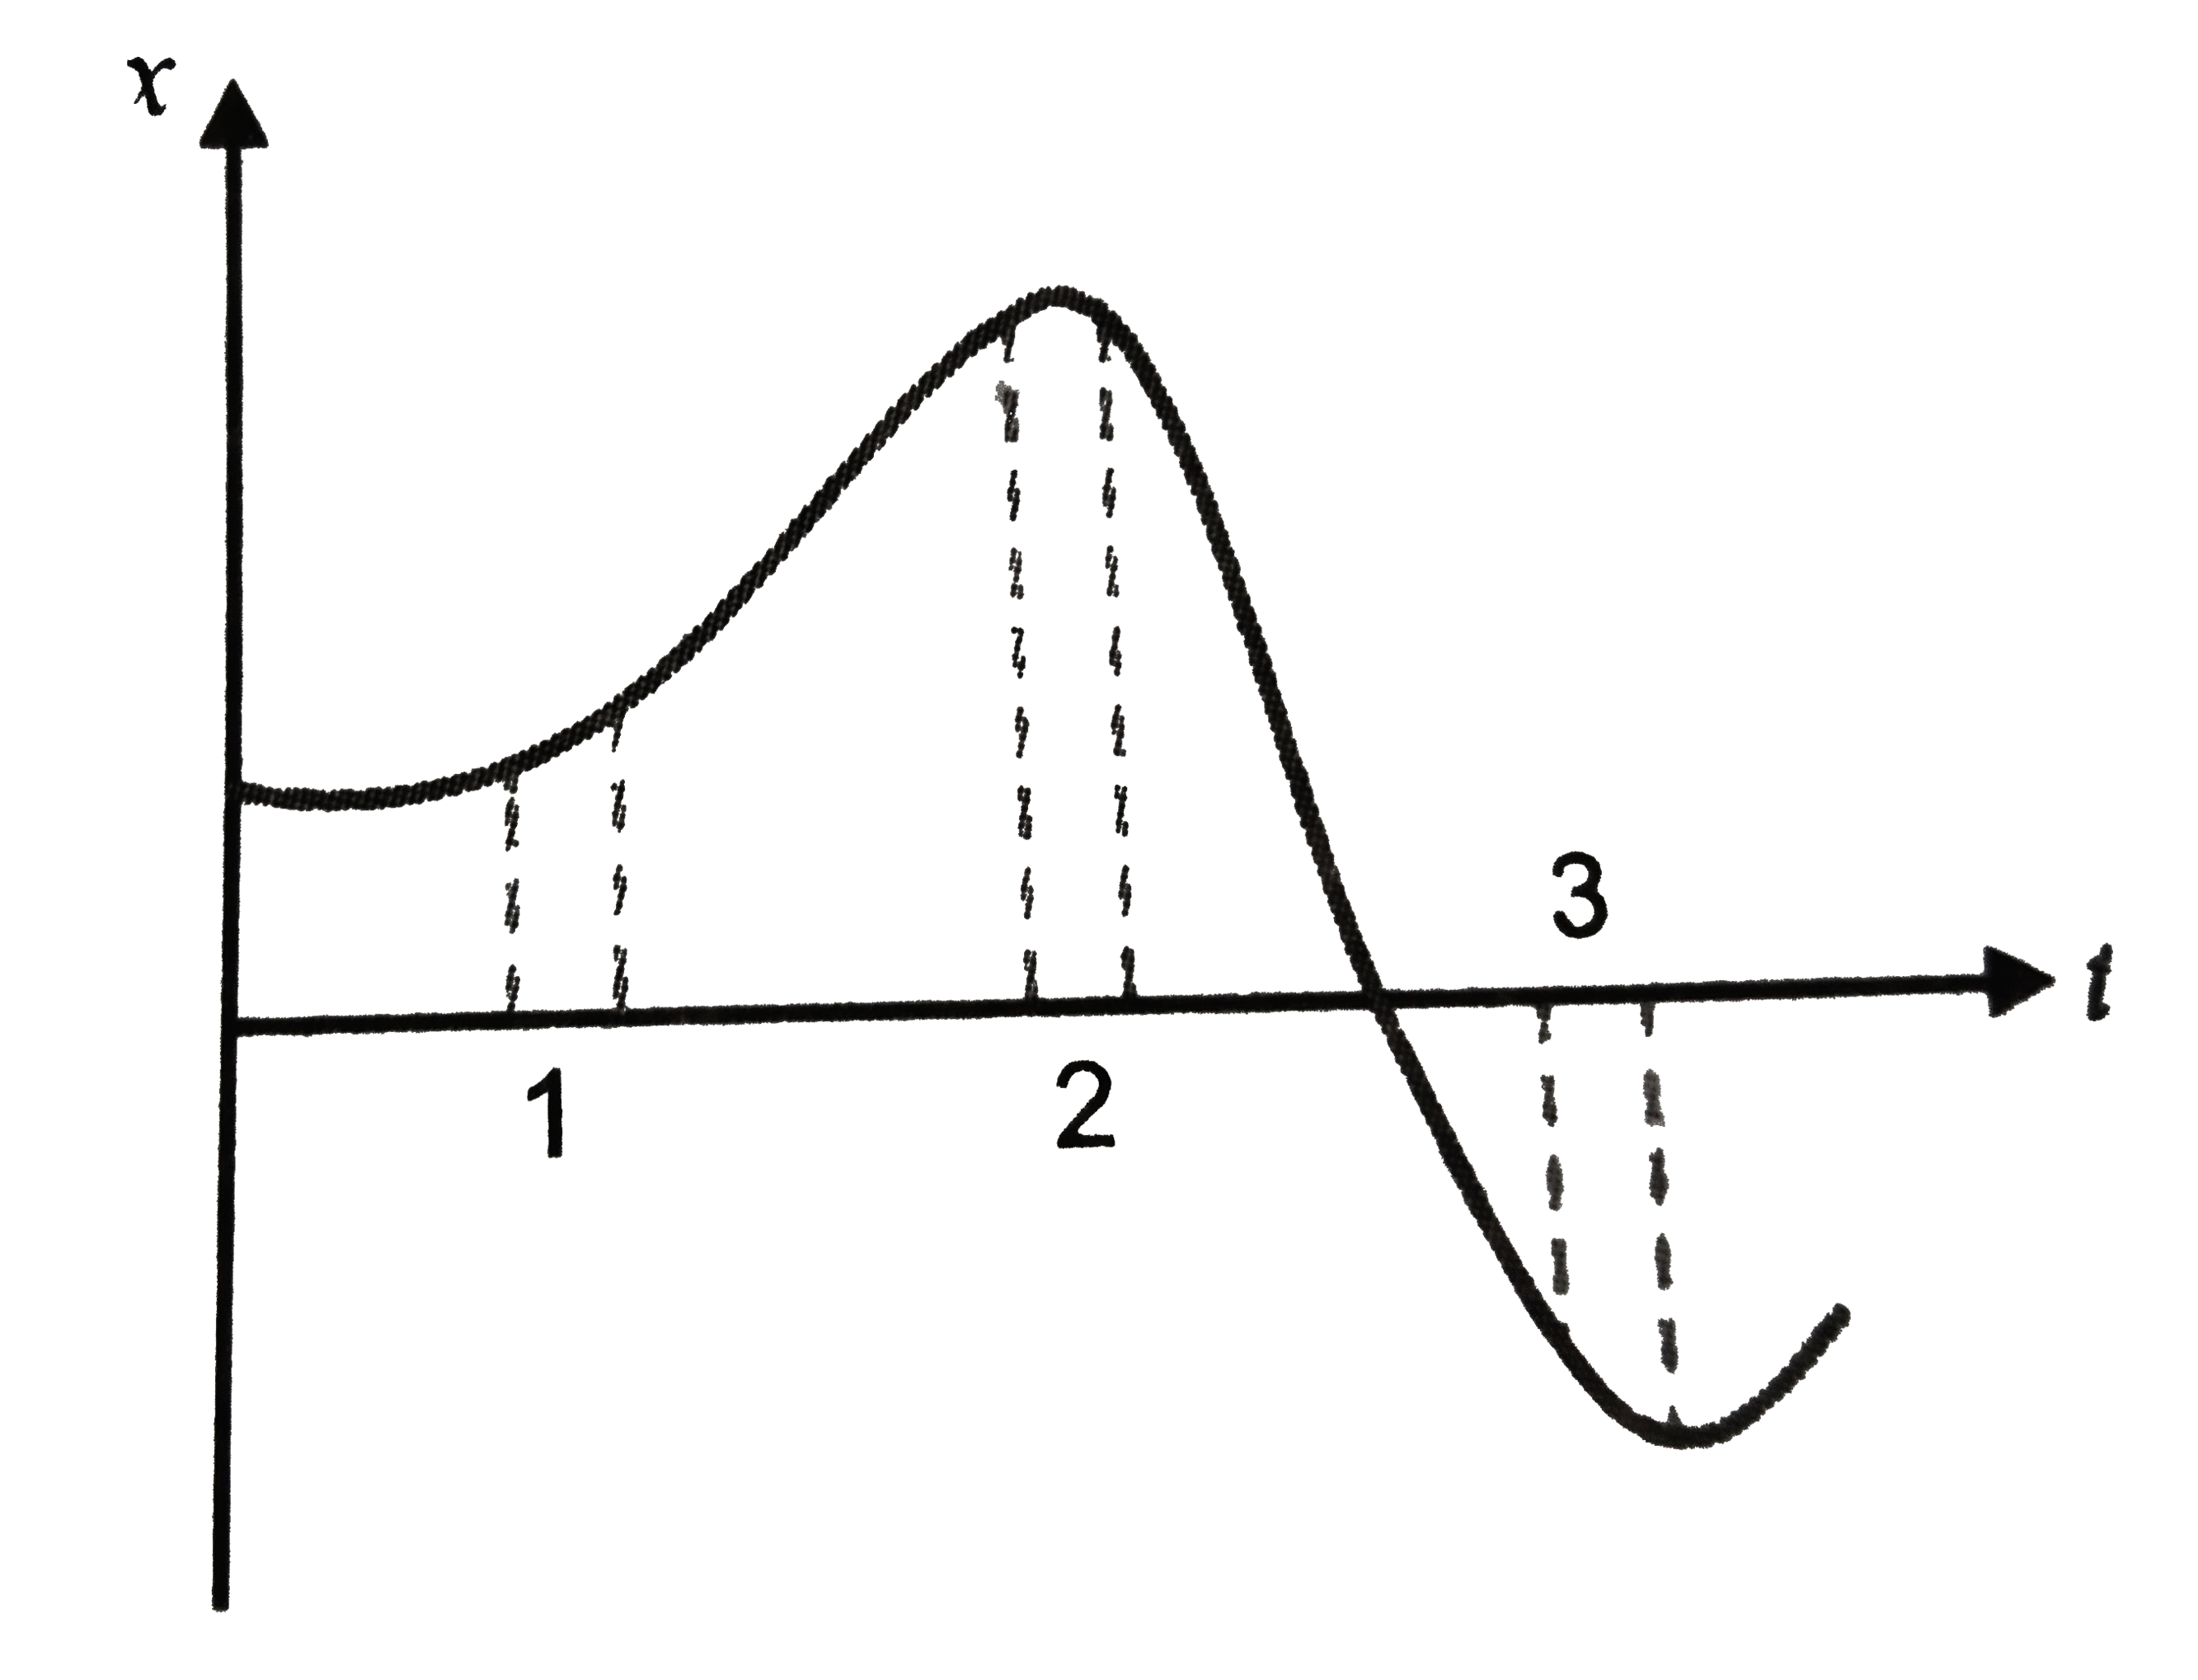
Fig. 2 (NCT).9 show the plot of a particle in one dimensional motion. Three different equal intervals of time are shown. In which interval the average speed is greatest and in which it is the least ? Give th sign of average speed for each interval.
 .
.
Step by step video solution for Fig. 2 (NCT).9 show the x-t plot of a particle in one dimensional motion. Three different equal intervals of time are shown. In which interval the average speed is greatest and in which it is the least ? Give th sign of average speed for each interval. . by Physics experts to help you in doubts & scoring excellent marks in Class 11 exams.
Updated on:21/07/2023Topper's Solved these Questions
Similar Questions
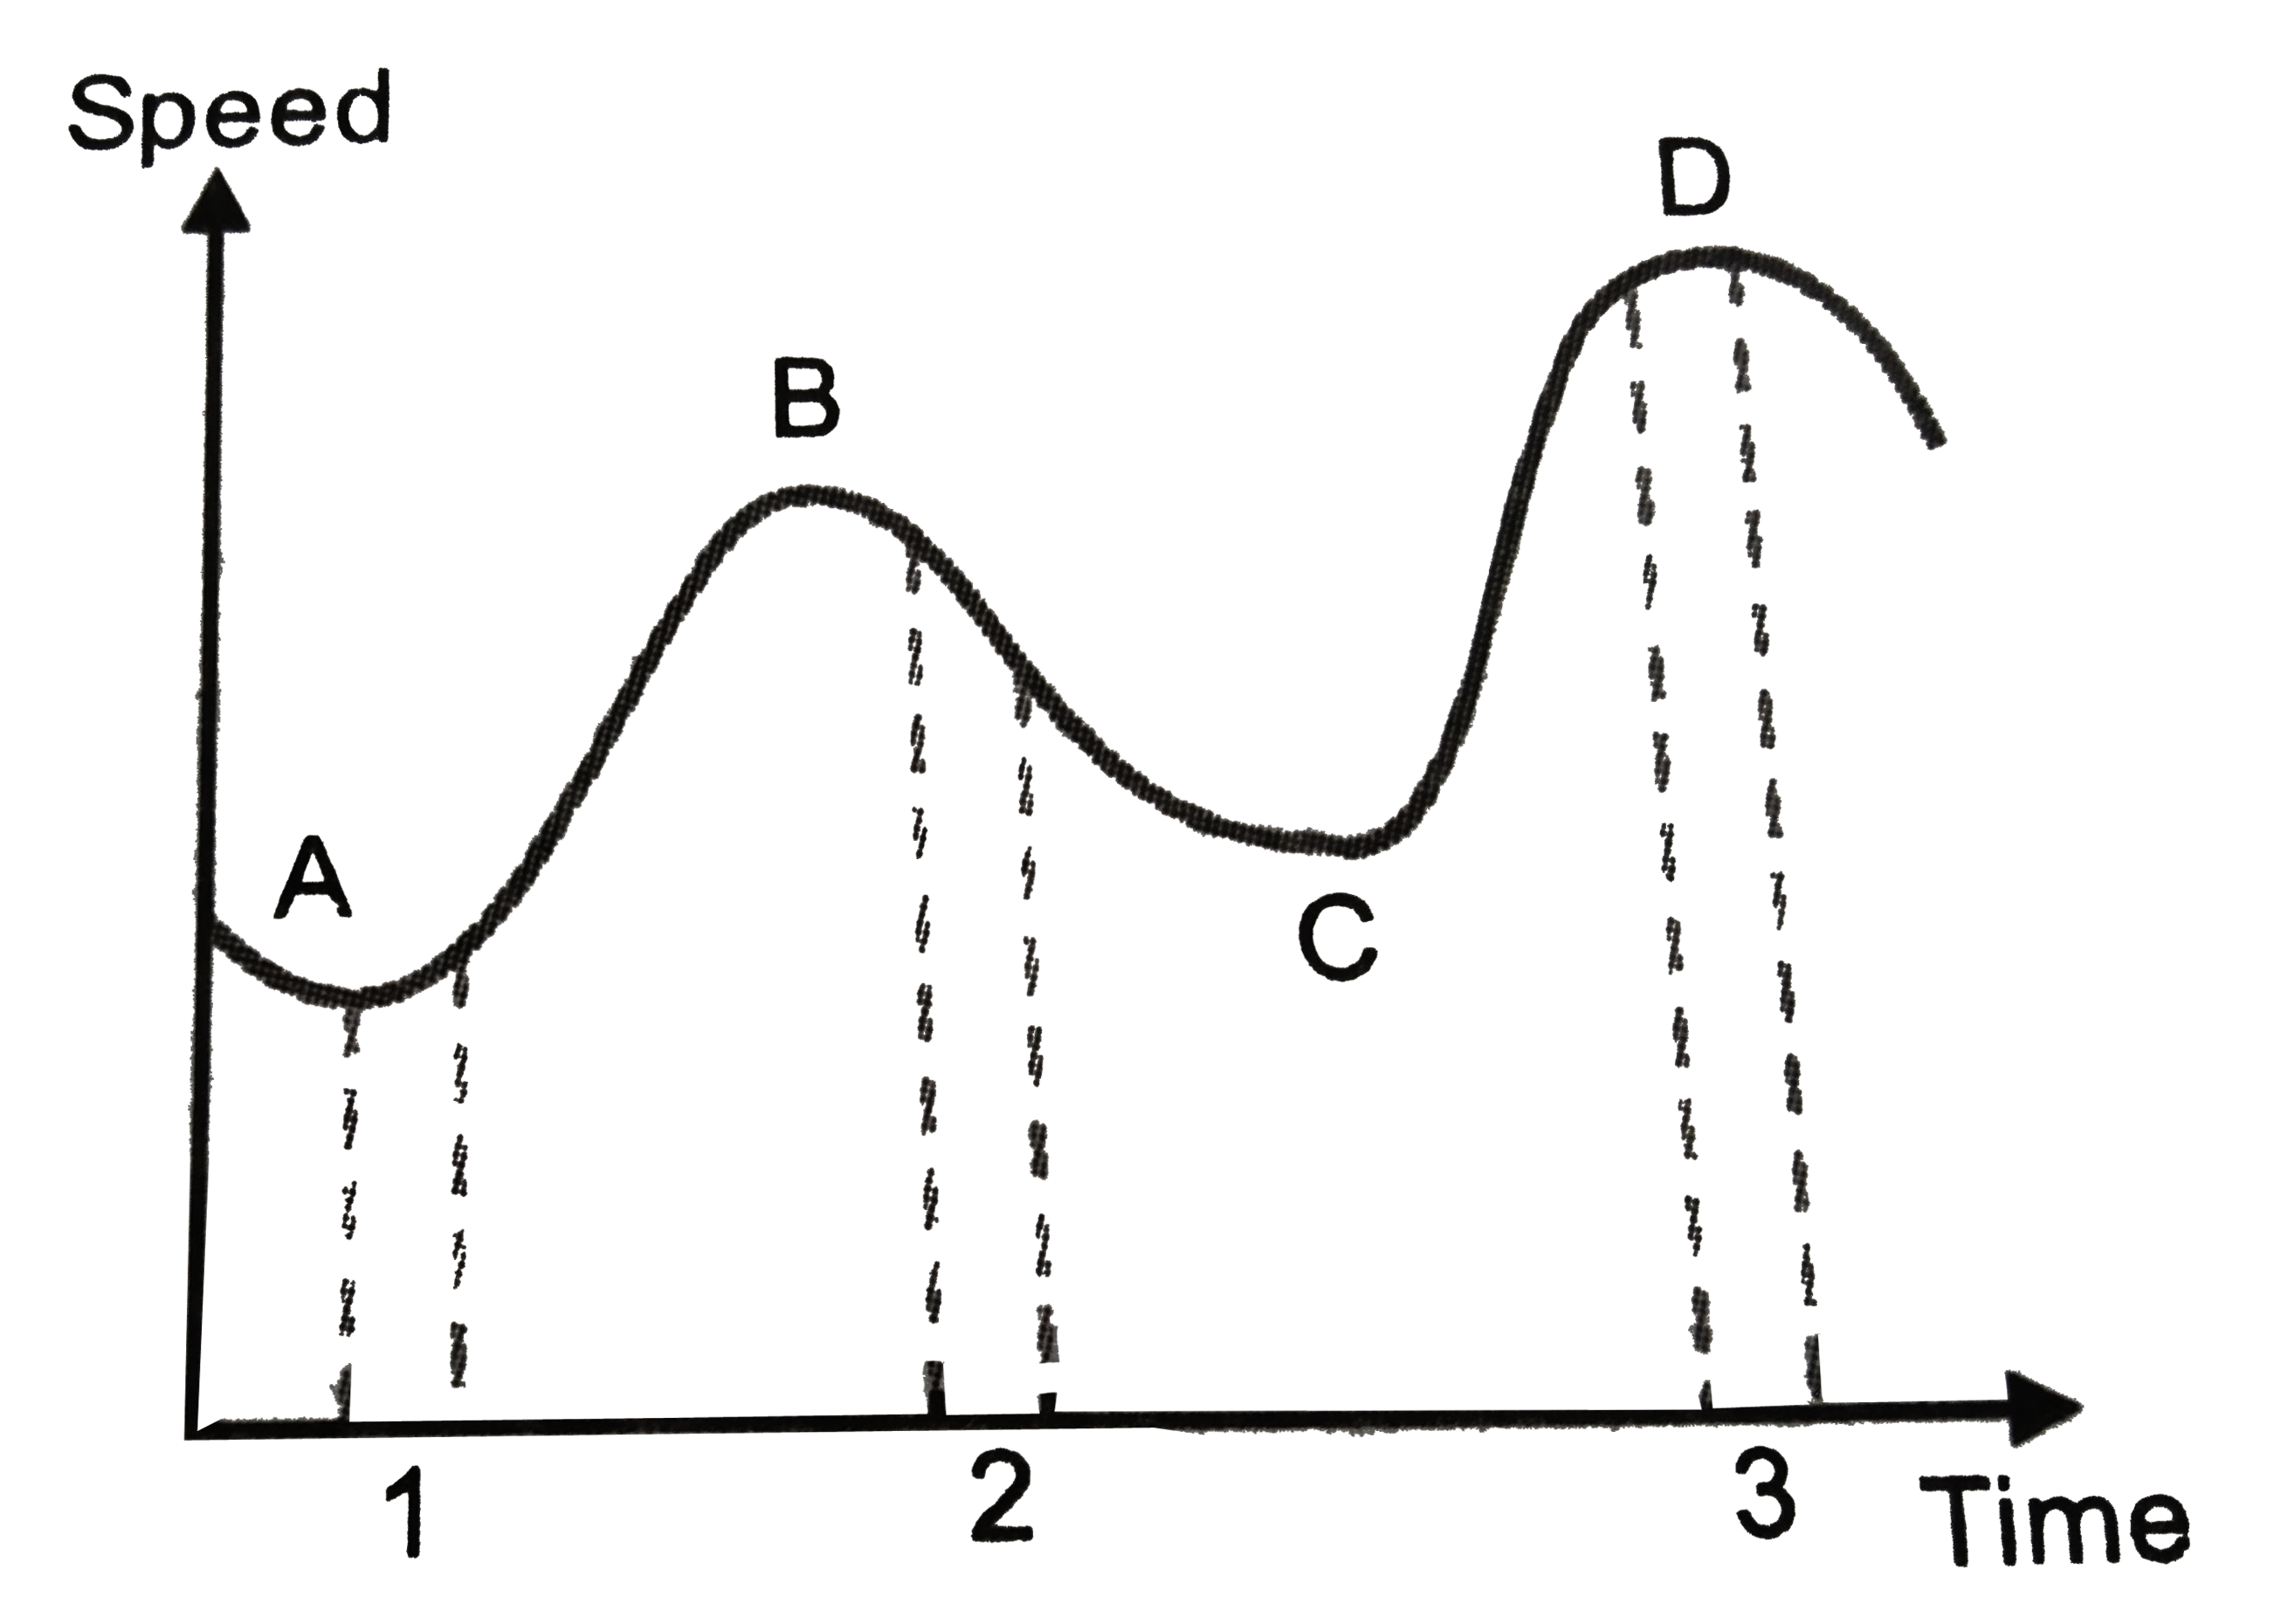
Fig. 2 (NCT). 10 . Give a speed-tiem graph of a particle in one dimenstional motion. Three different equal intervals of time are shwon. In which interval is the average acceleration graeatest in magnitude ? In which interval is the average speed greatest ? Choosing the positive direction as the constant direction of motion, give the signs of u and a in the three intervals. What are the acclerations at teh points A,B,C and D ?
 .
.
View SolutionFind average speed in time interval t= 2 to t=10s
View Solution
Knowledge Check
The velocity-time plot is shown in figure. Find the average speed in time interval t=0 to t=40s during the period.
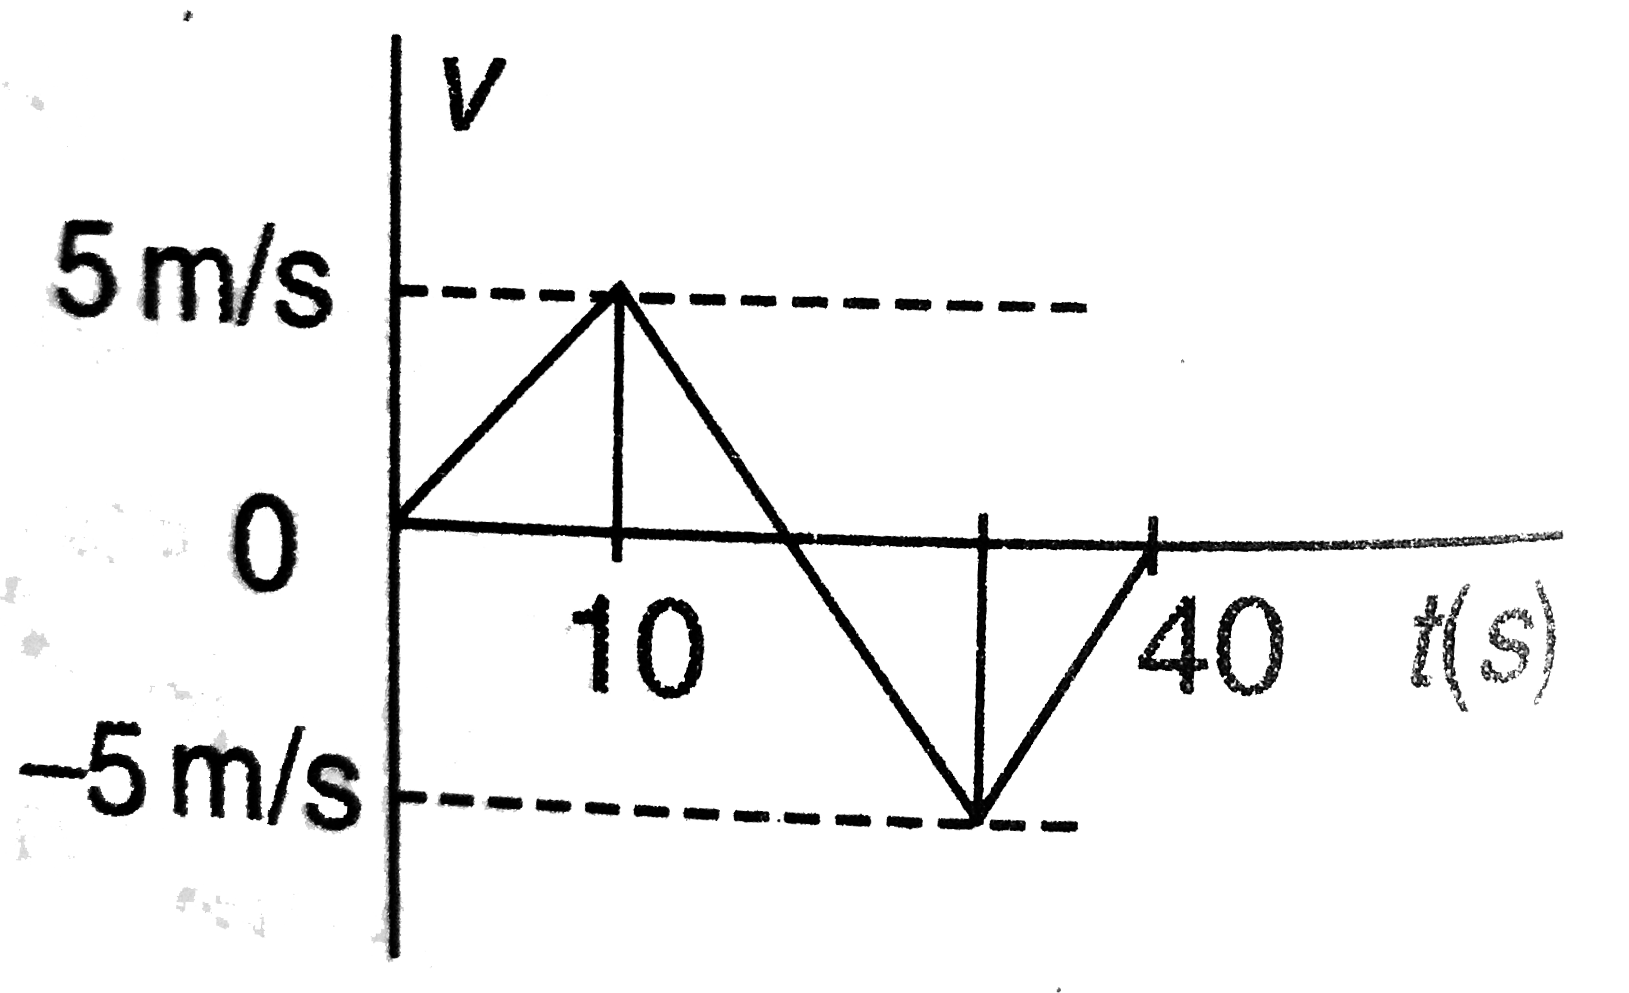 AzeroB2.5m/sC5m/sDnone
Assertion: The average velocity of a particle is zero in a time interval. It is possible that the instantaneous acceleration is never zero in the interval.
Reason: The magnitude of average velocity in an interval is equal to its average speed in that interval.AIf both assertion & Reason are True & the Reason is a corrrect explanation of the Asserion.BIf both Assertion & Reason are True but Reason is not correct explanation of the Assertion.CIf Assertion is Trie but the Reason is False.DIf both Assertion & Reason are false
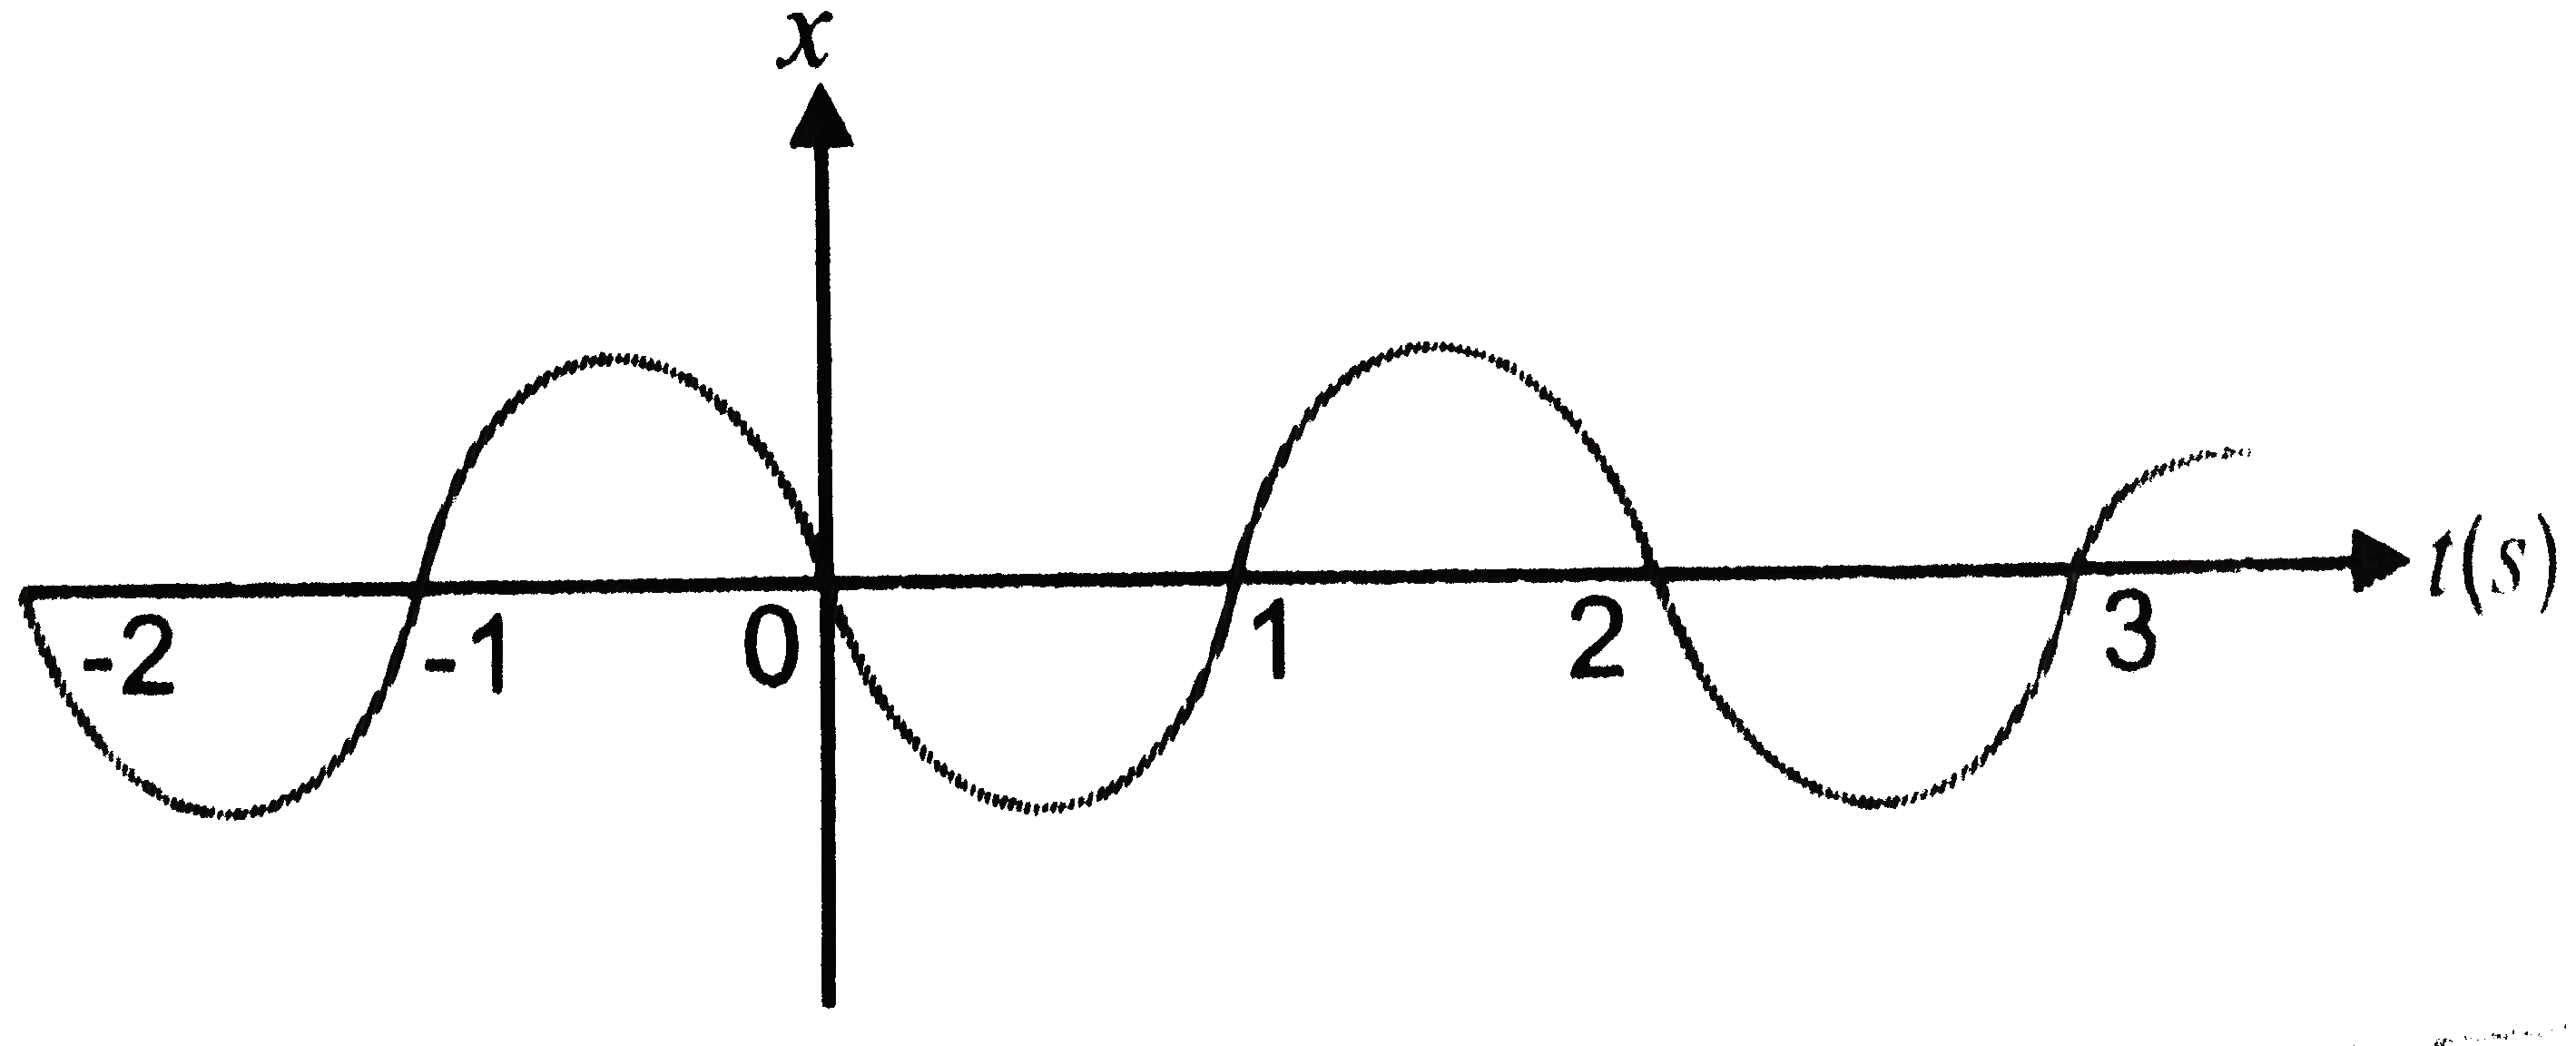
Figure gives the x-t plot of a particle is one dimensional motion. Give the signs of position, velocity and acceleration of the particle at t = 0.3s
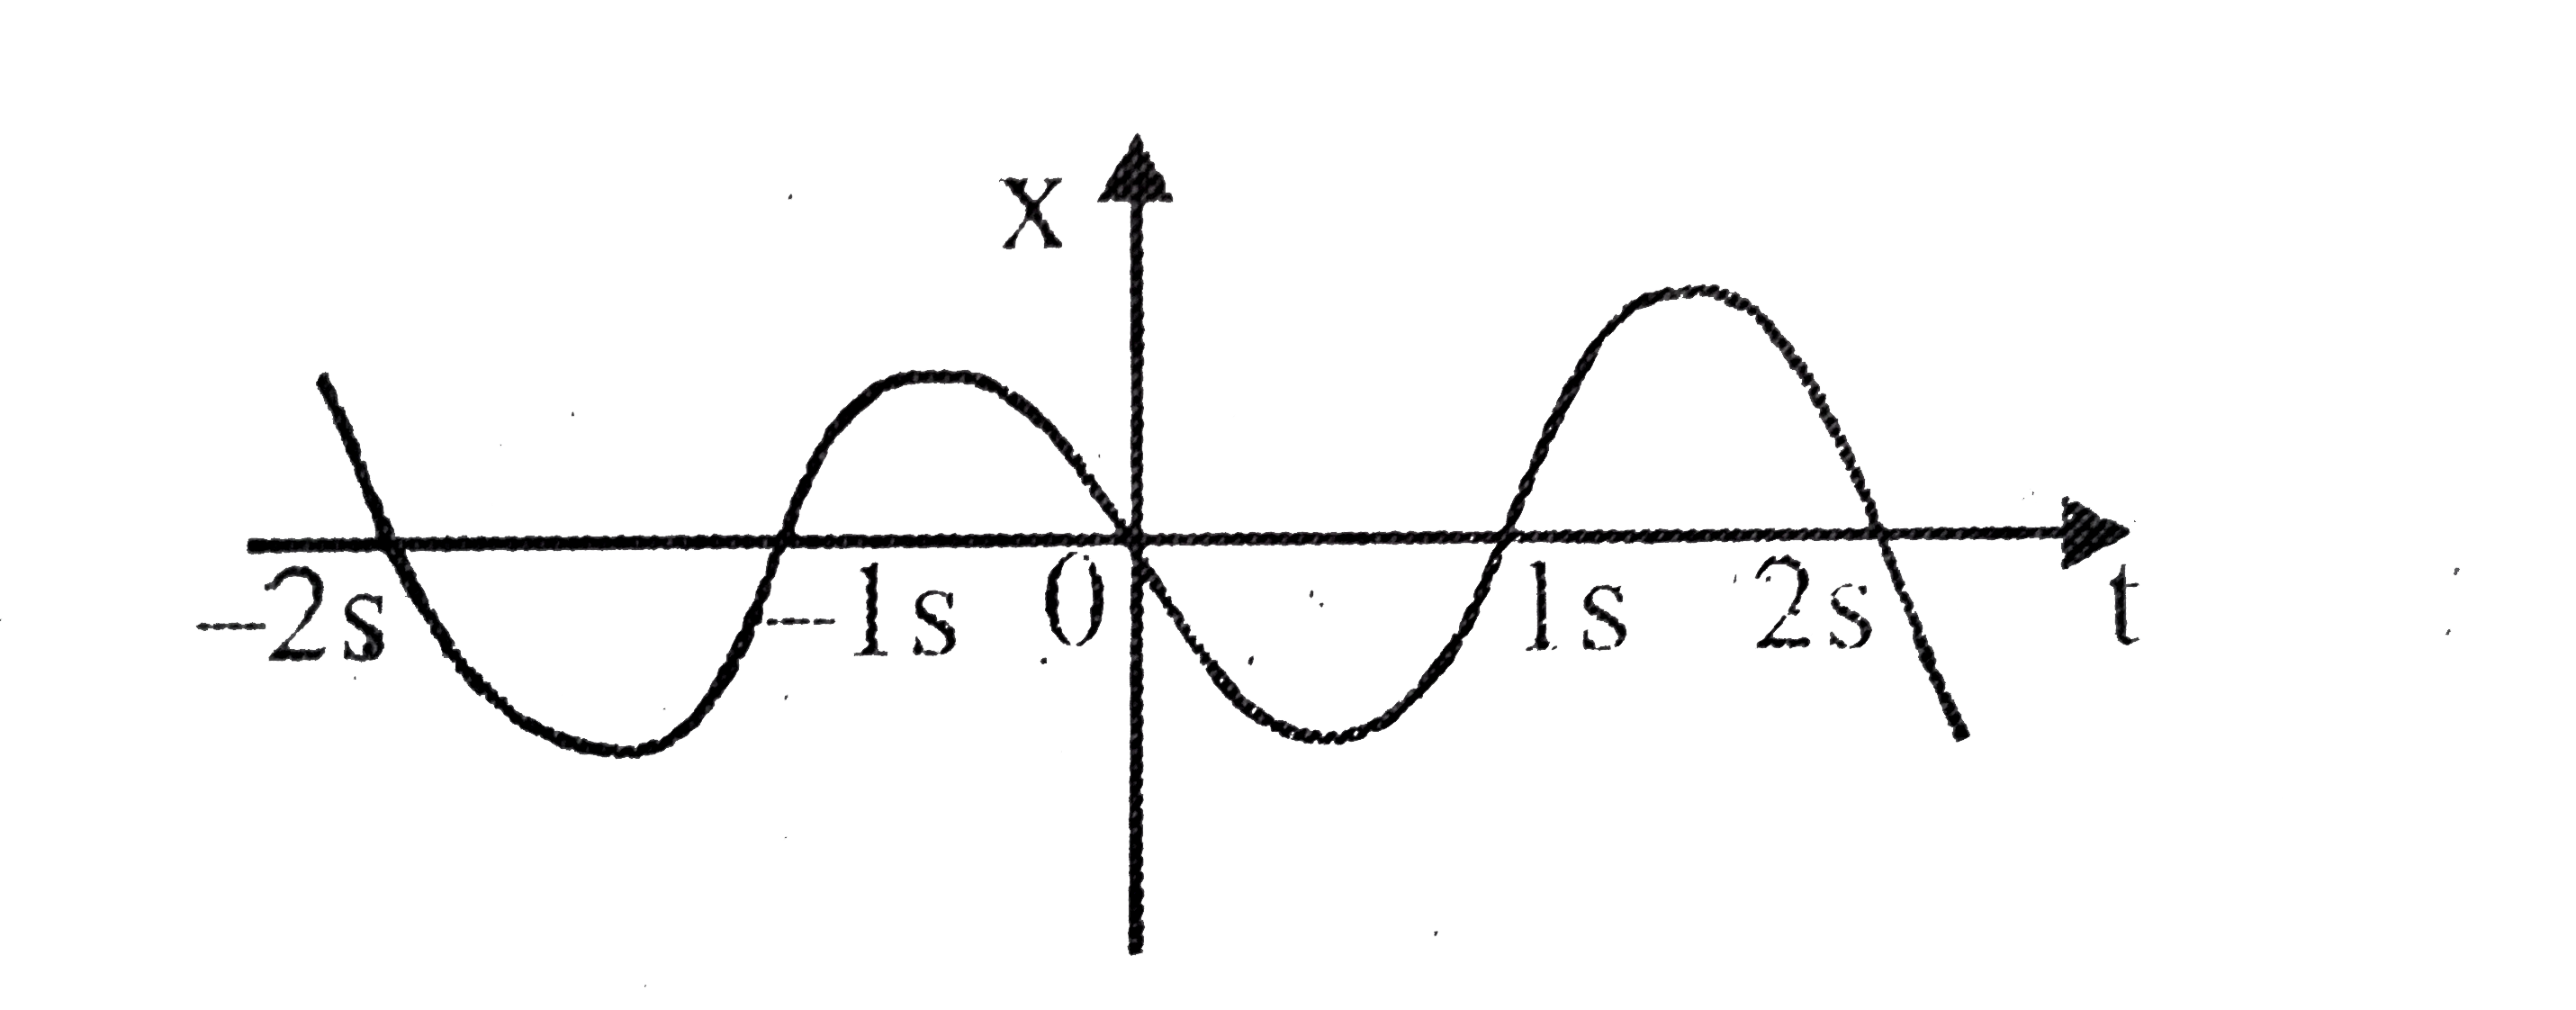
View SolutionFig 2 (NCT).8 gives the x−t plot of a particle executing one dimensional simle harmonic motion. Give the signs of position, velocity and acceleration variables of the particles at t=0.3s, 1.2s,−1.2s,
View SolutionFigure shows the x-t plot of a particle moving along a straight line. Let v1 and v2, be average speeds in time intervals 1 and 2 respectively. Then

View Solutions-t graph of a particle in motion is shown in Fig. Calculate
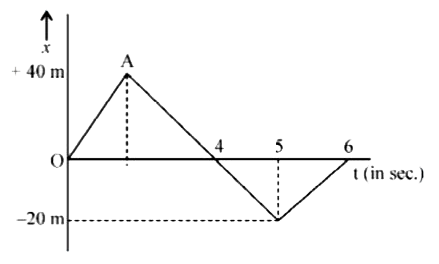
Average speed
View SolutionFigure shows the velocity of a particle moving on x-axis.
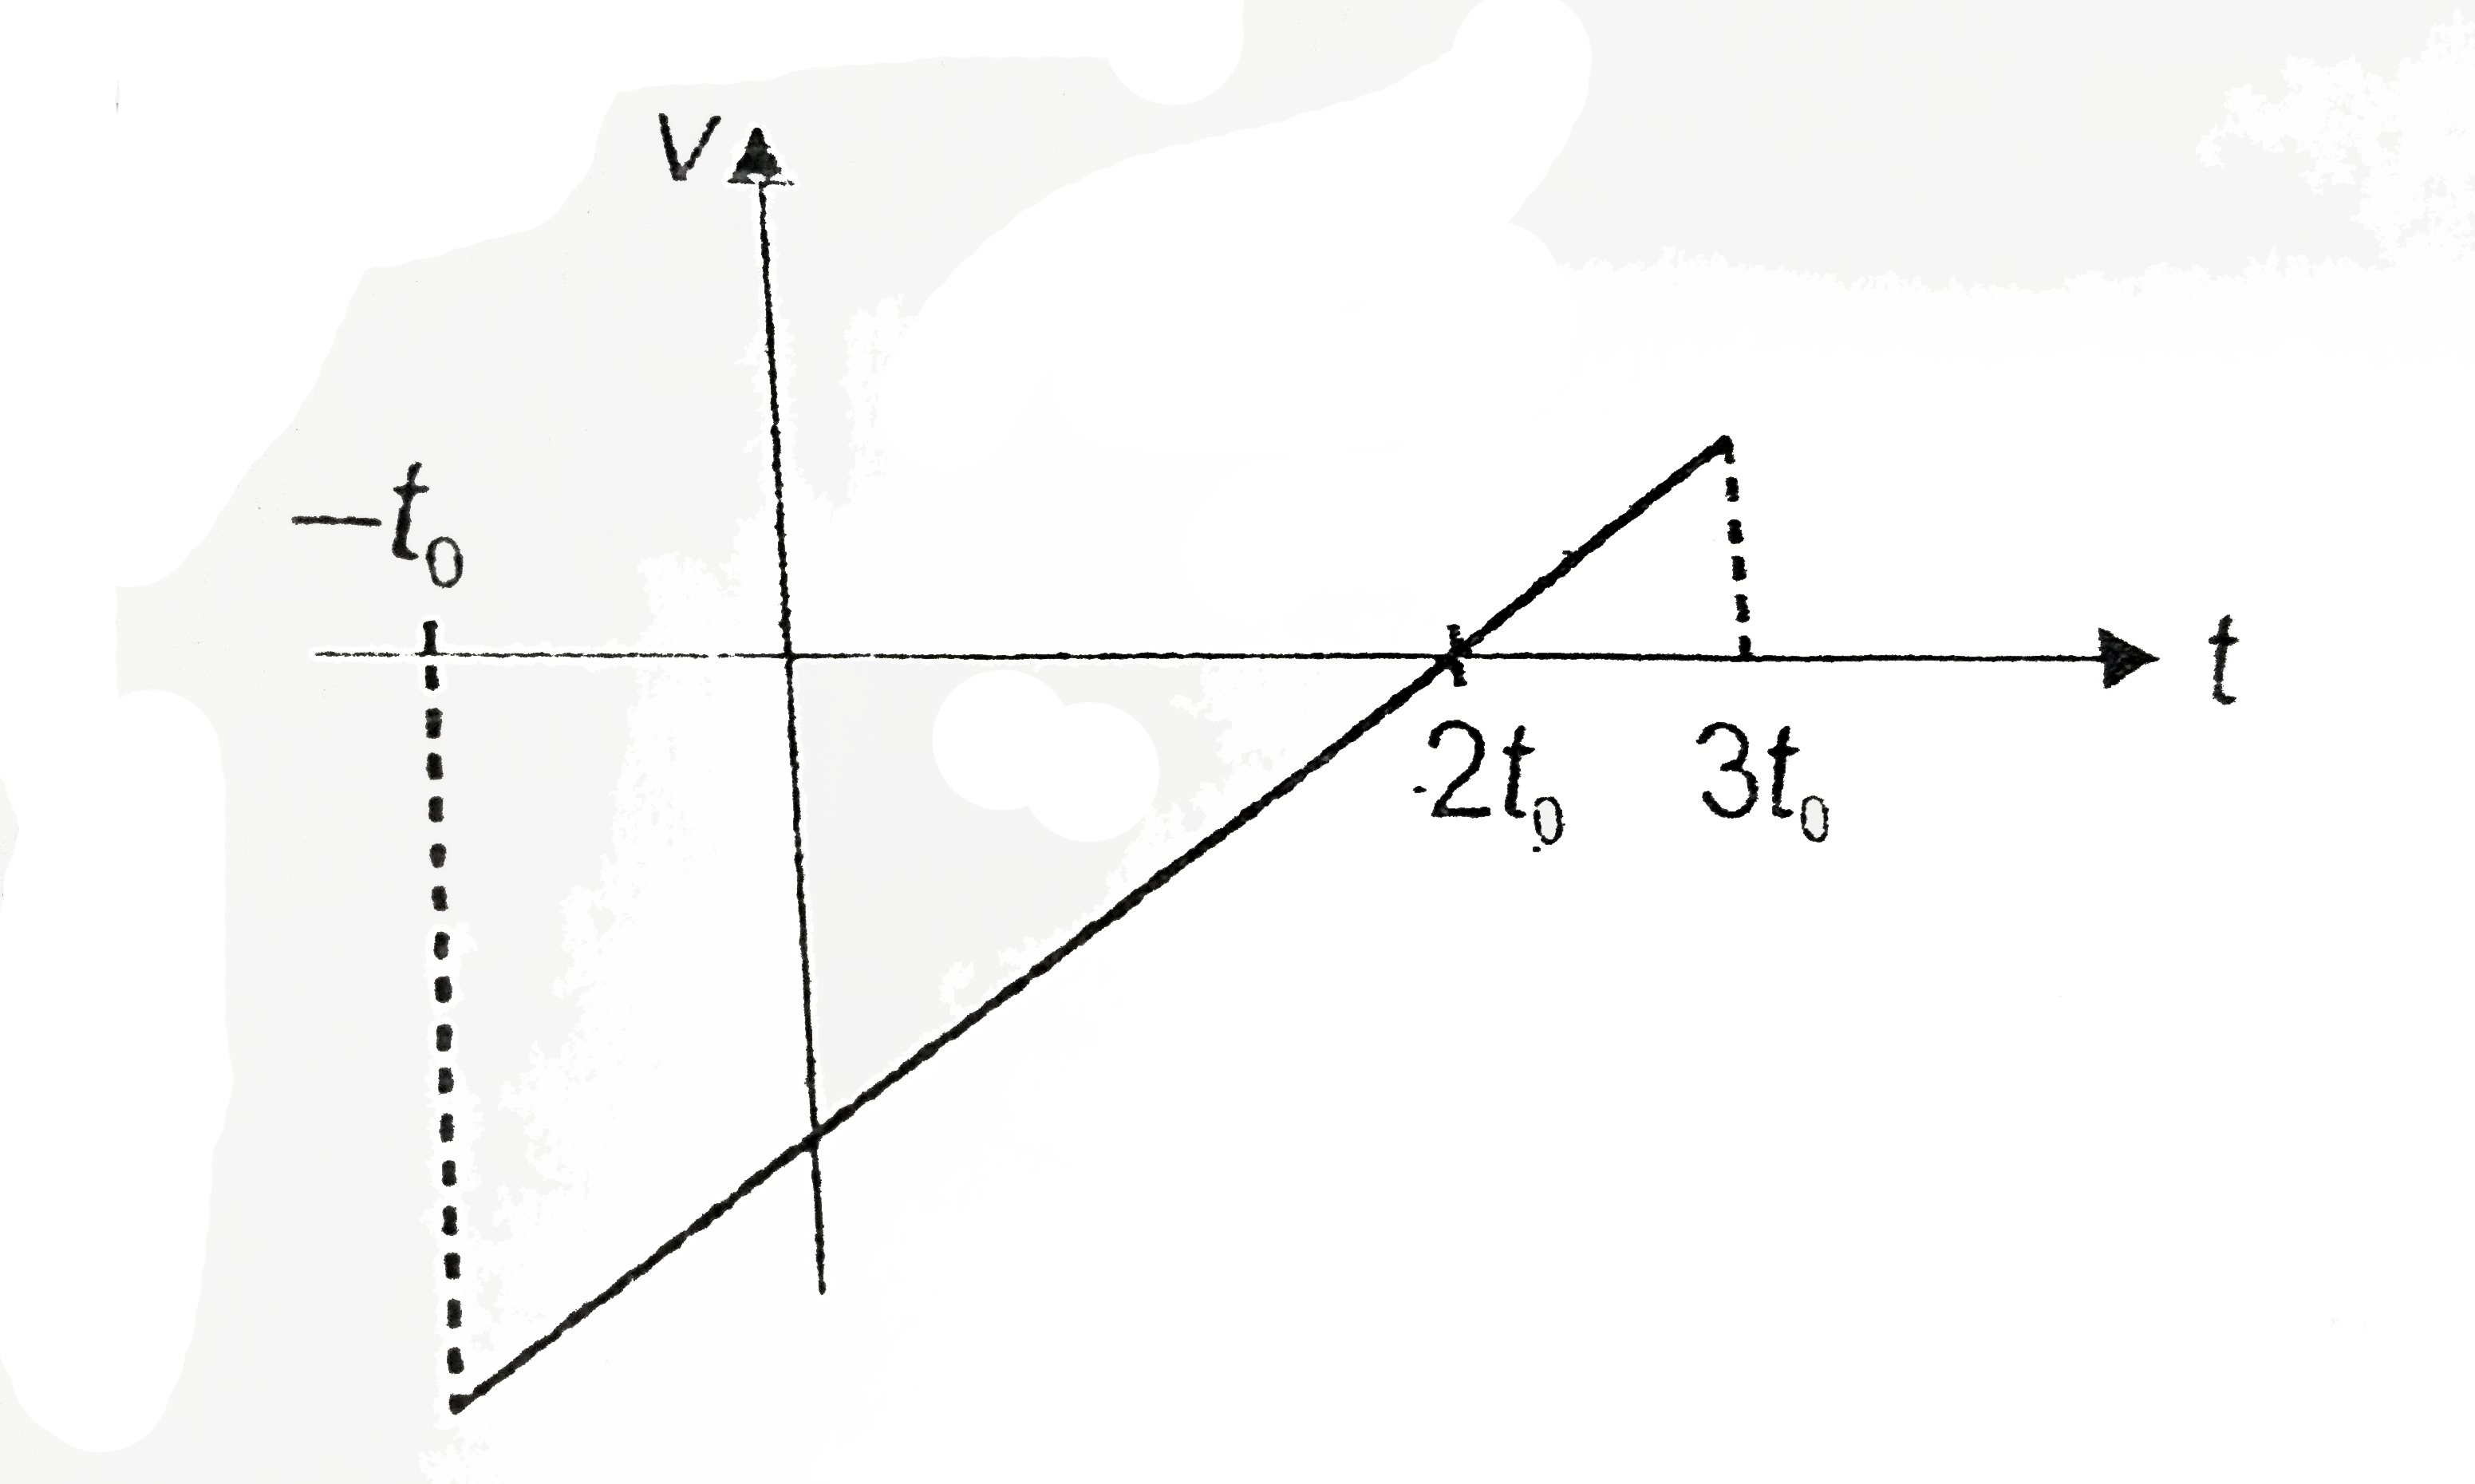
Which of the following statement is correct for the interval shown in graph?
View SolutionIf the object is moving with uniform velocity in a given interval of time, then the average speed and instantaneous velocity are equal, why?
View Solution
