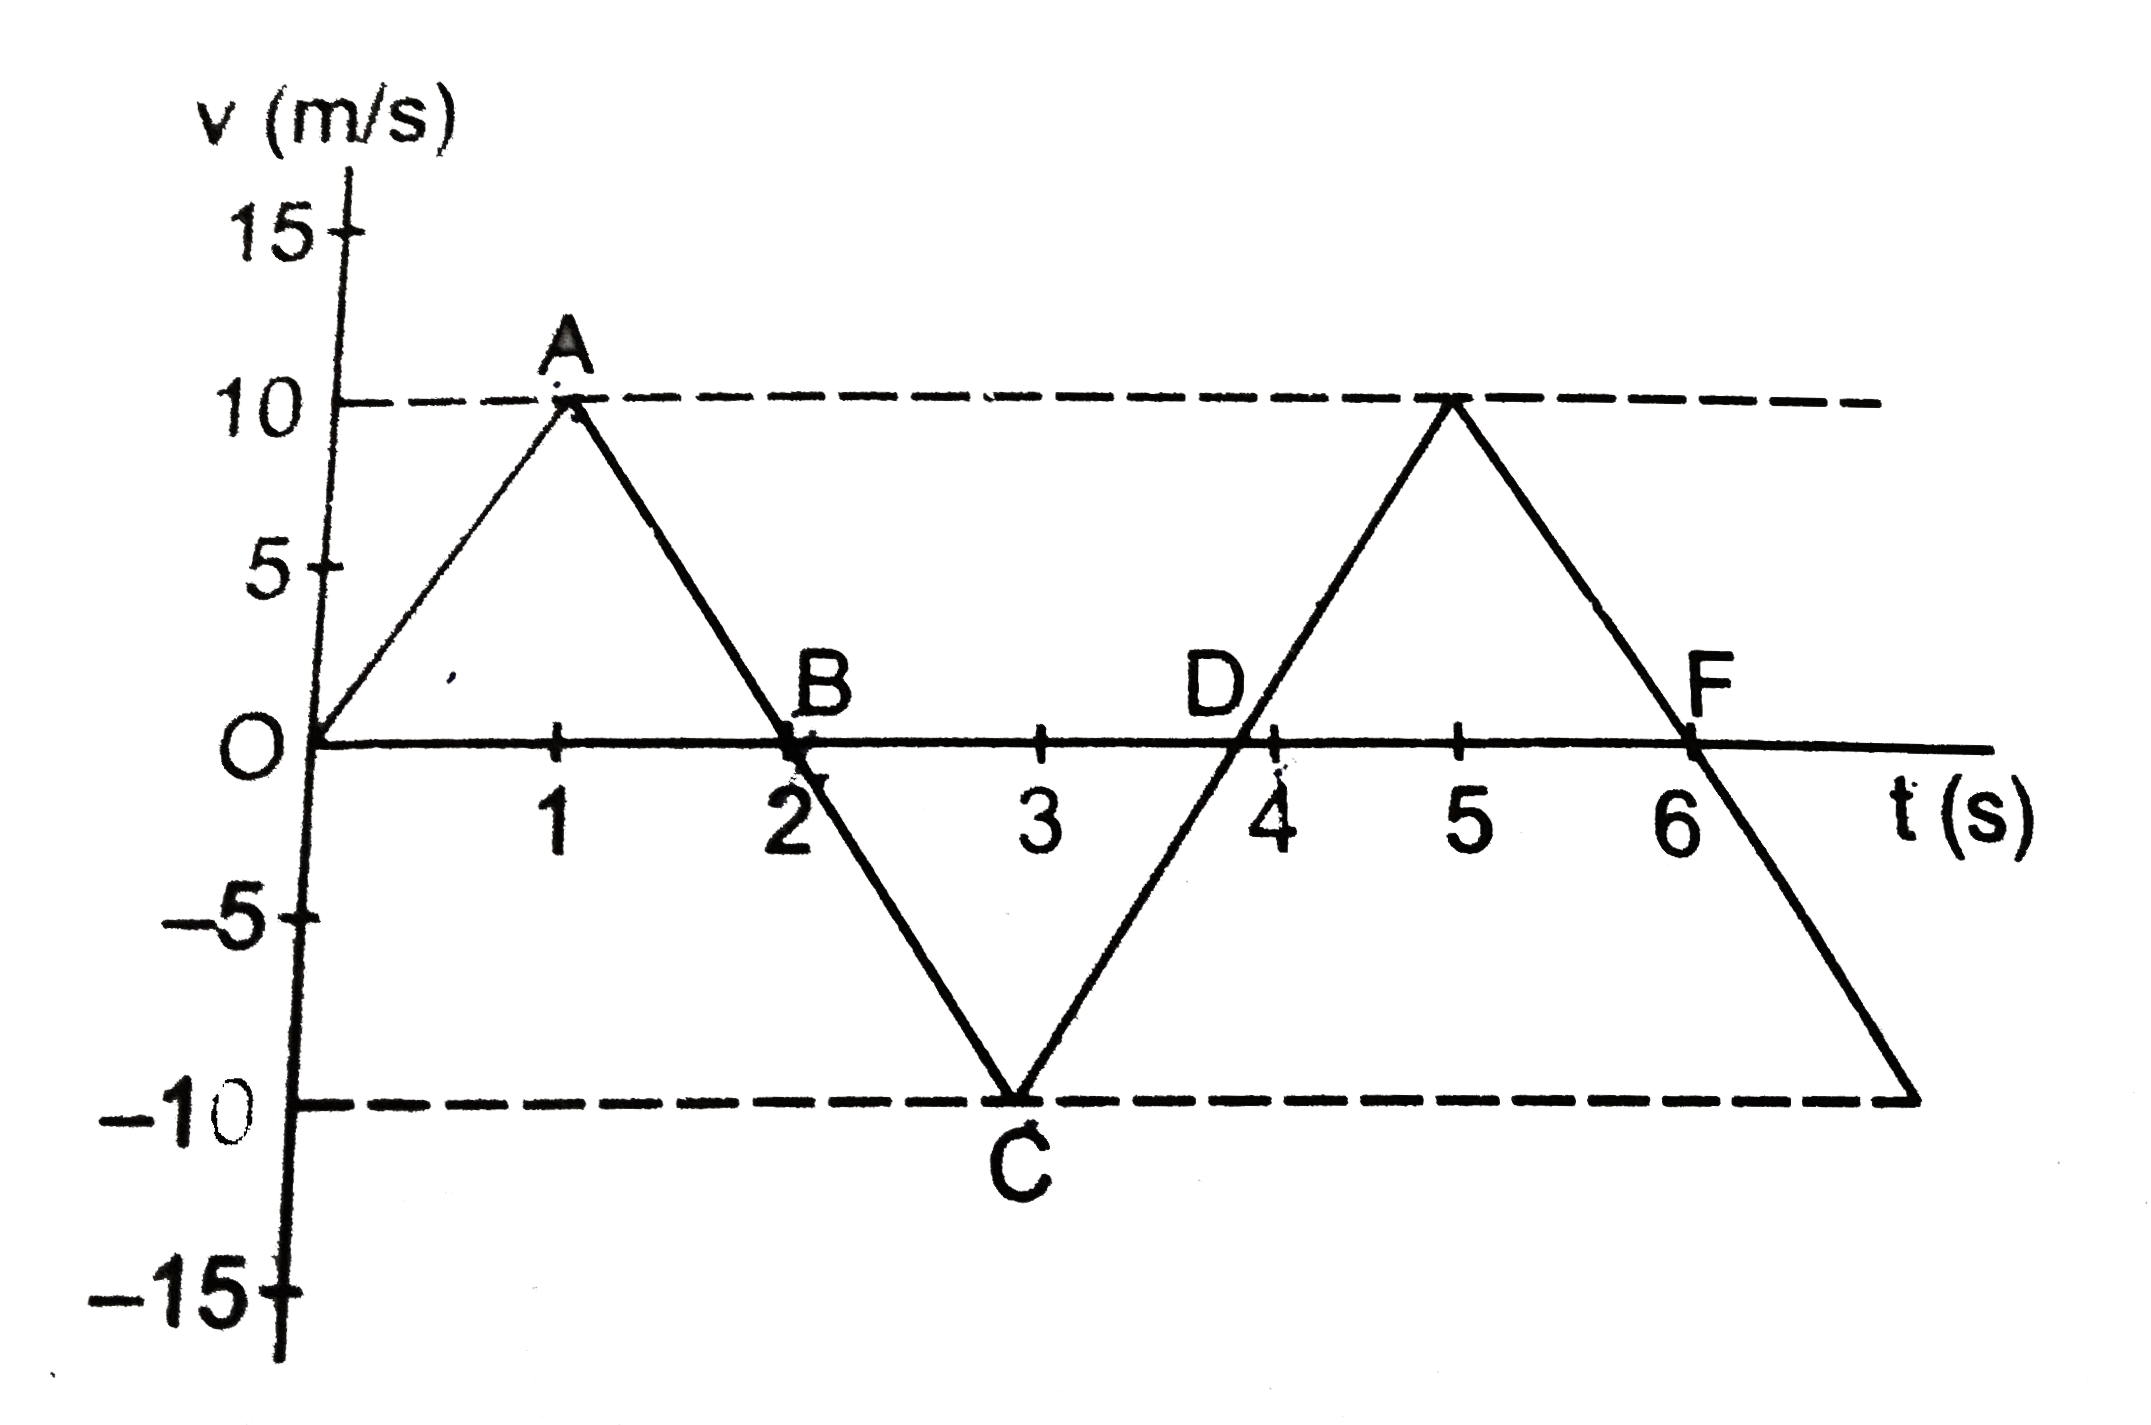
From the veloicty time graph of a particle given in figure describe the motion of the particle qualitively int eh interval 0 to 4s. Find a. the distance travelled during first two seconds, b. during the time 2s to 4s, c. during the time 0 to 4s d. displacement during 0 to 4 s. e. acceleration at t=1/2 and f. acceleration at t=2s
 .
.
At t=0, the particle is at rest say at the origin. After that the velocity is positive, so that the particle moves in the positive x direction. Its speed increases till 1 second when it starts decreasing. The particle continues to move further in positive x direction. At t=2s, its velocity is reduced to zero, it has moved through a maximum positive x distance. Then it changes its direction, velocity being negative, but increasig i magnitude.At t=3s velocity is maximum in the negative x direction and then the magnitude starts decreasing. it comes to rest at t=4 s.
a. Distance during 0 to 2 s = Area of OAB
=12×2s×10ms=10m
b. Distance during 2 to 4s = Area of BCD = 10 m. The partile has mioved in negative x direction during this period.
c. The distance travelled during 0 to 4s=10 m+10m
=20m
d. displacement during 0 to 4 = 10 m+(-10m)=0
e. at t=1/2 s acceleration = slope of line OA=10 m/s^2
f. at t=2 s acceleration= slope of line ABC = - 10 m/s^2.
Topper's Solved these Questions
- REST AND MOTION : KINEMATICSBook:HC VERMA ENGLISHChapter:REST AND MOTION : KINEMATICSExercise:Objective -1
Explore 13 Videos
- REST AND MOTION : KINEMATICSBook:HC VERMA ENGLISHChapter:REST AND MOTION : KINEMATICSExercise:Objective -2
Explore 9 Videos
- REST AND MOTION : KINEMATICSBook:HC VERMA ENGLISHChapter:REST AND MOTION : KINEMATICSExercise:Question for short Answer
Explore 13 Videos
- PHYSICS AND MATHEMATICSBook:HC VERMA ENGLISHChapter:PHYSICS AND MATHEMATICSExercise:Question for short Answer
Explore 14 Videos
- ROTATIONAL MECHANICSBook:HC VERMA ENGLISHChapter:ROTATIONAL MECHANICSExercise:Questions for short Answer
Explore 21 Videos
Similar Questions
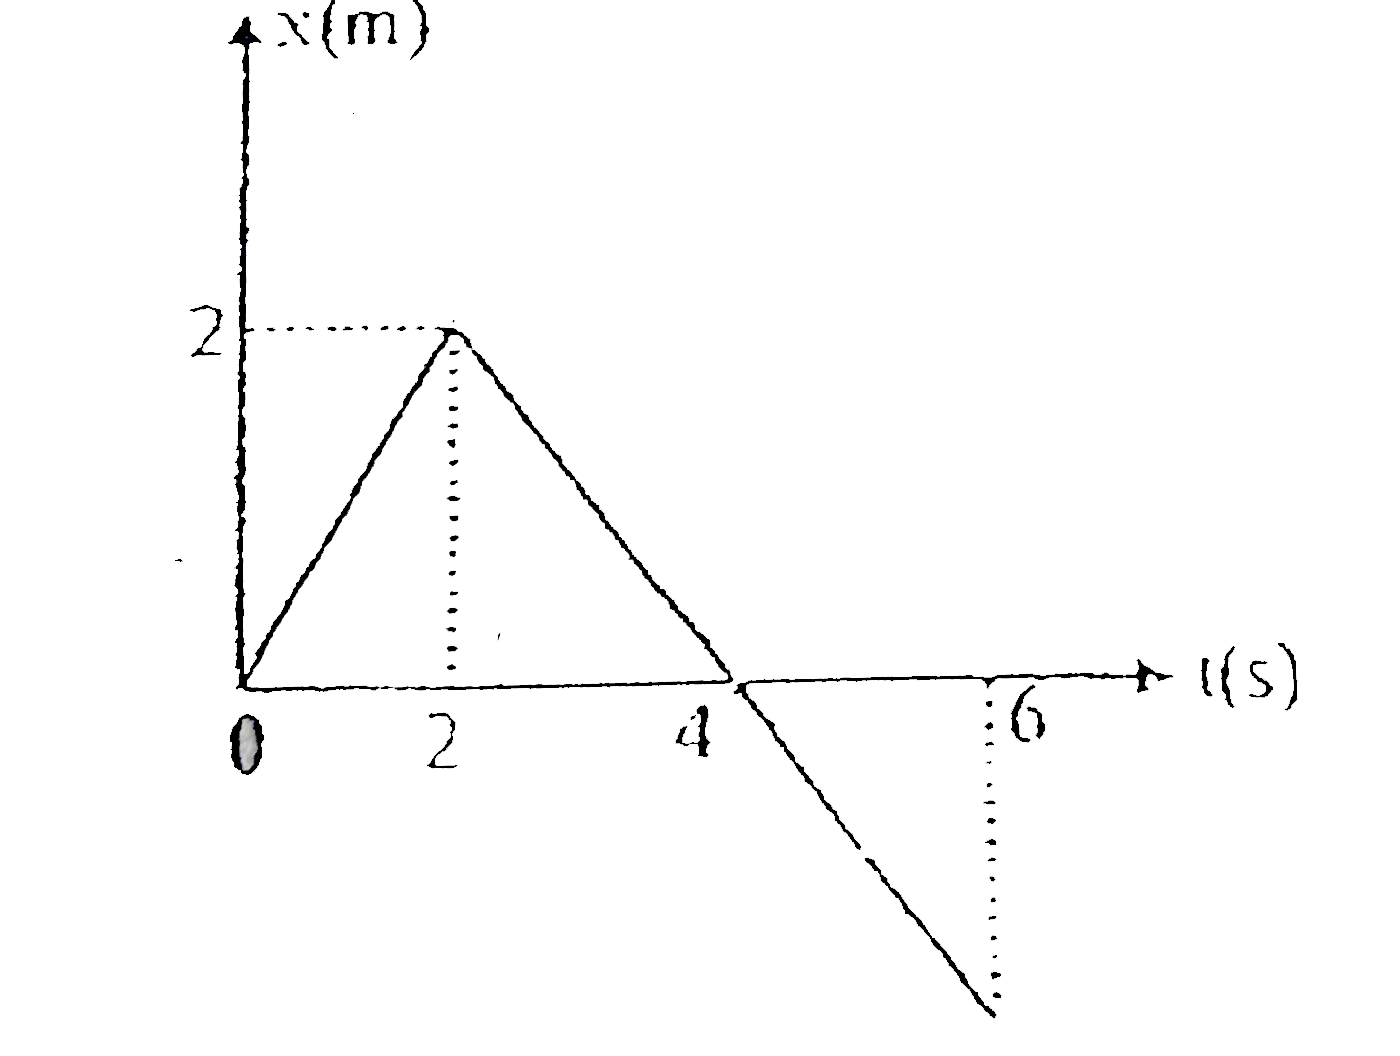
Position time graph of a particle of mass 2 kg is shown in figrure. Total work done on the particle from t=0 to t=4s is
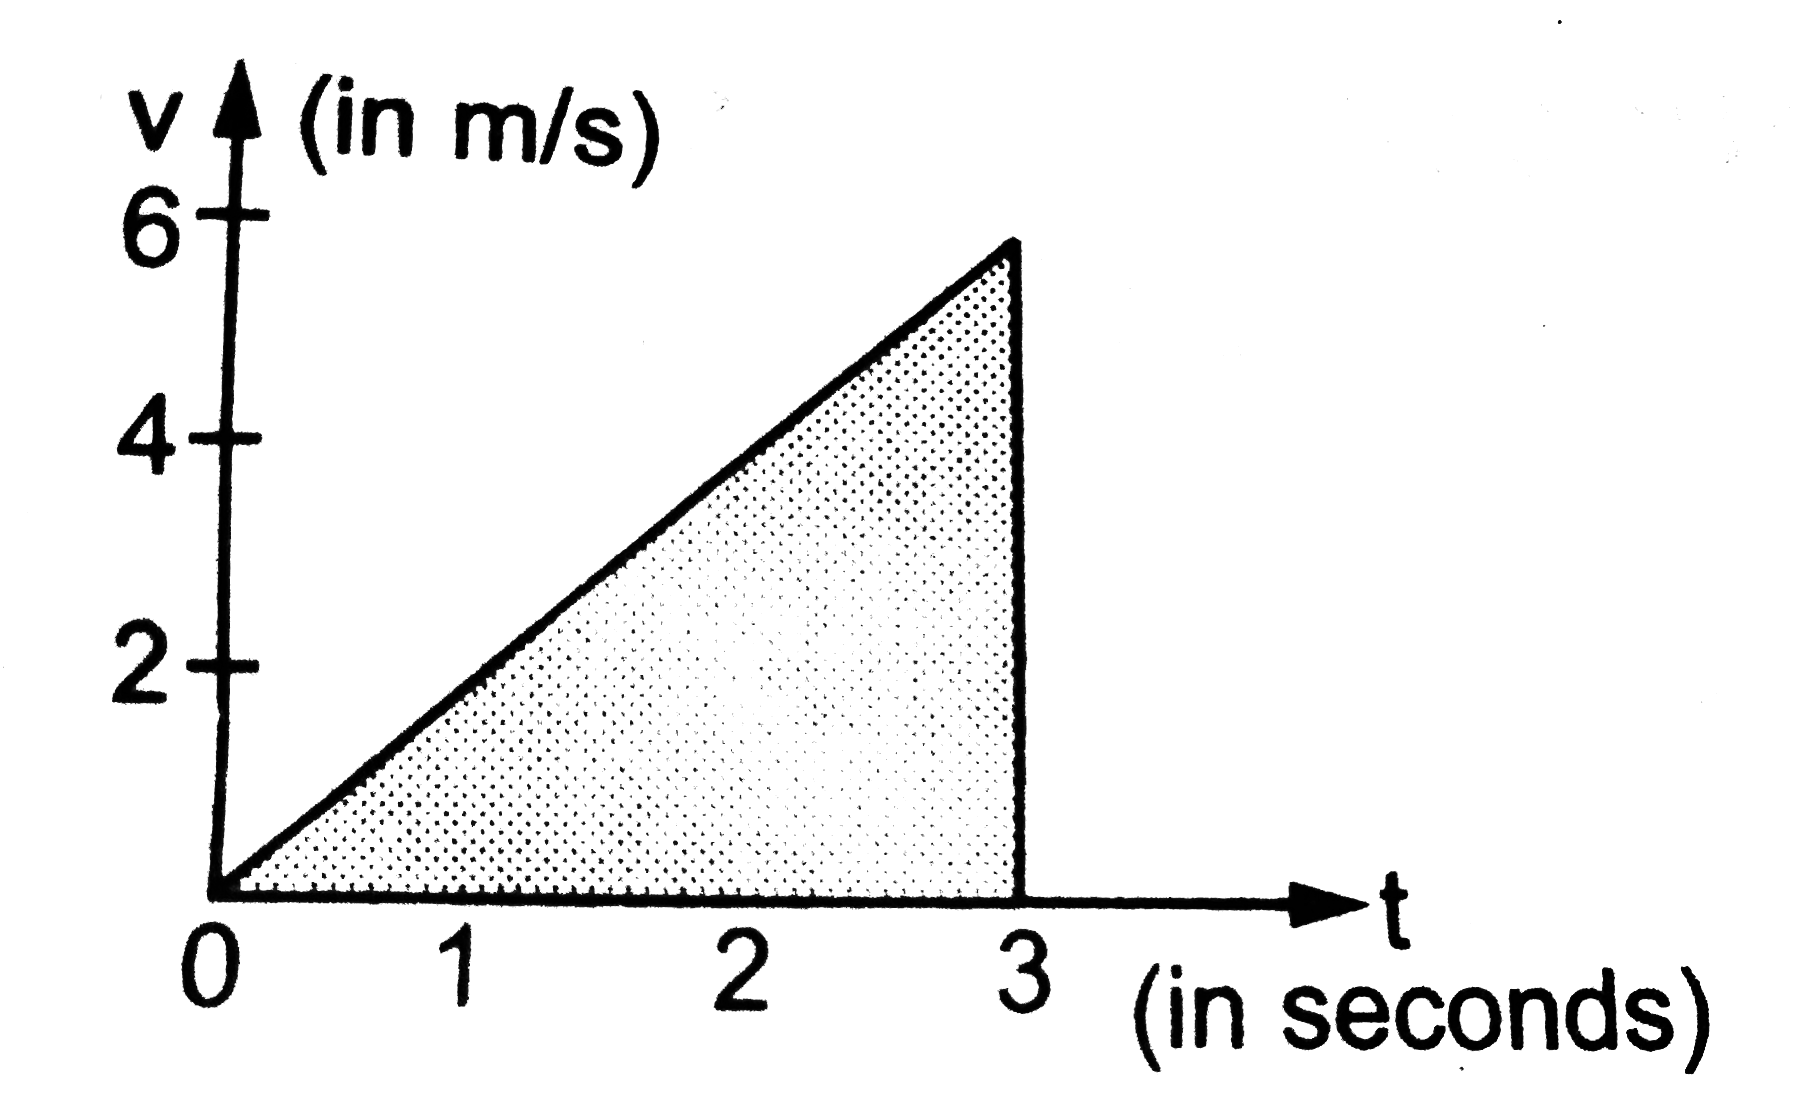
View SolutionFigure shows the speed versus time graph for a particle. Find the distance travelled by the particle during the time t=0 to t=3s.
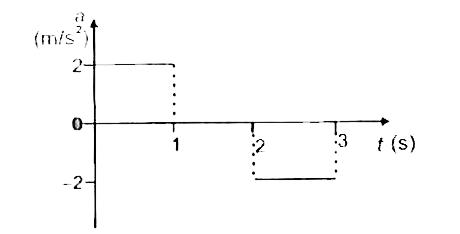
View SolutionAcceleration - time graph for a particle is given in figure. If it starts motion at t = 0, distance travelled in 3 s will be
View SolutionThe velocity-time graph of an object is given below. Calculate the average acceleration of the object in the time interval of 4 s to 6 s.
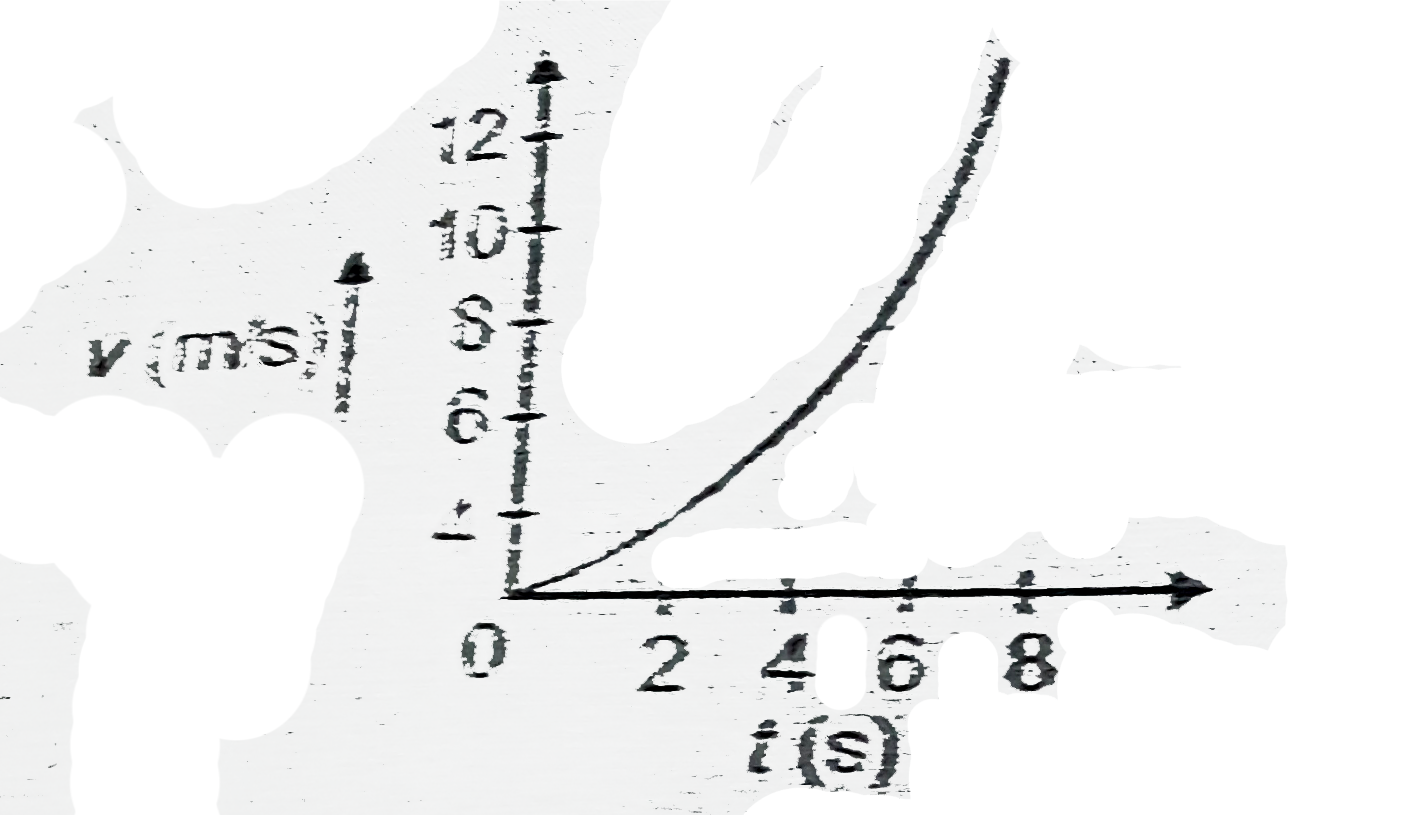
View SolutionThe speed verses time graph for a particle is shown in the figure. The distance travelled (in m) by the particle during the time interval t = 0 to t = 5 s will be __________
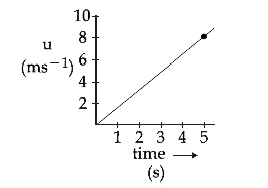
View SolutionForce-time graph of a particle of mass 6 kg is shown in figure, then change in linear momentum during t = 0 to t = 10 s is
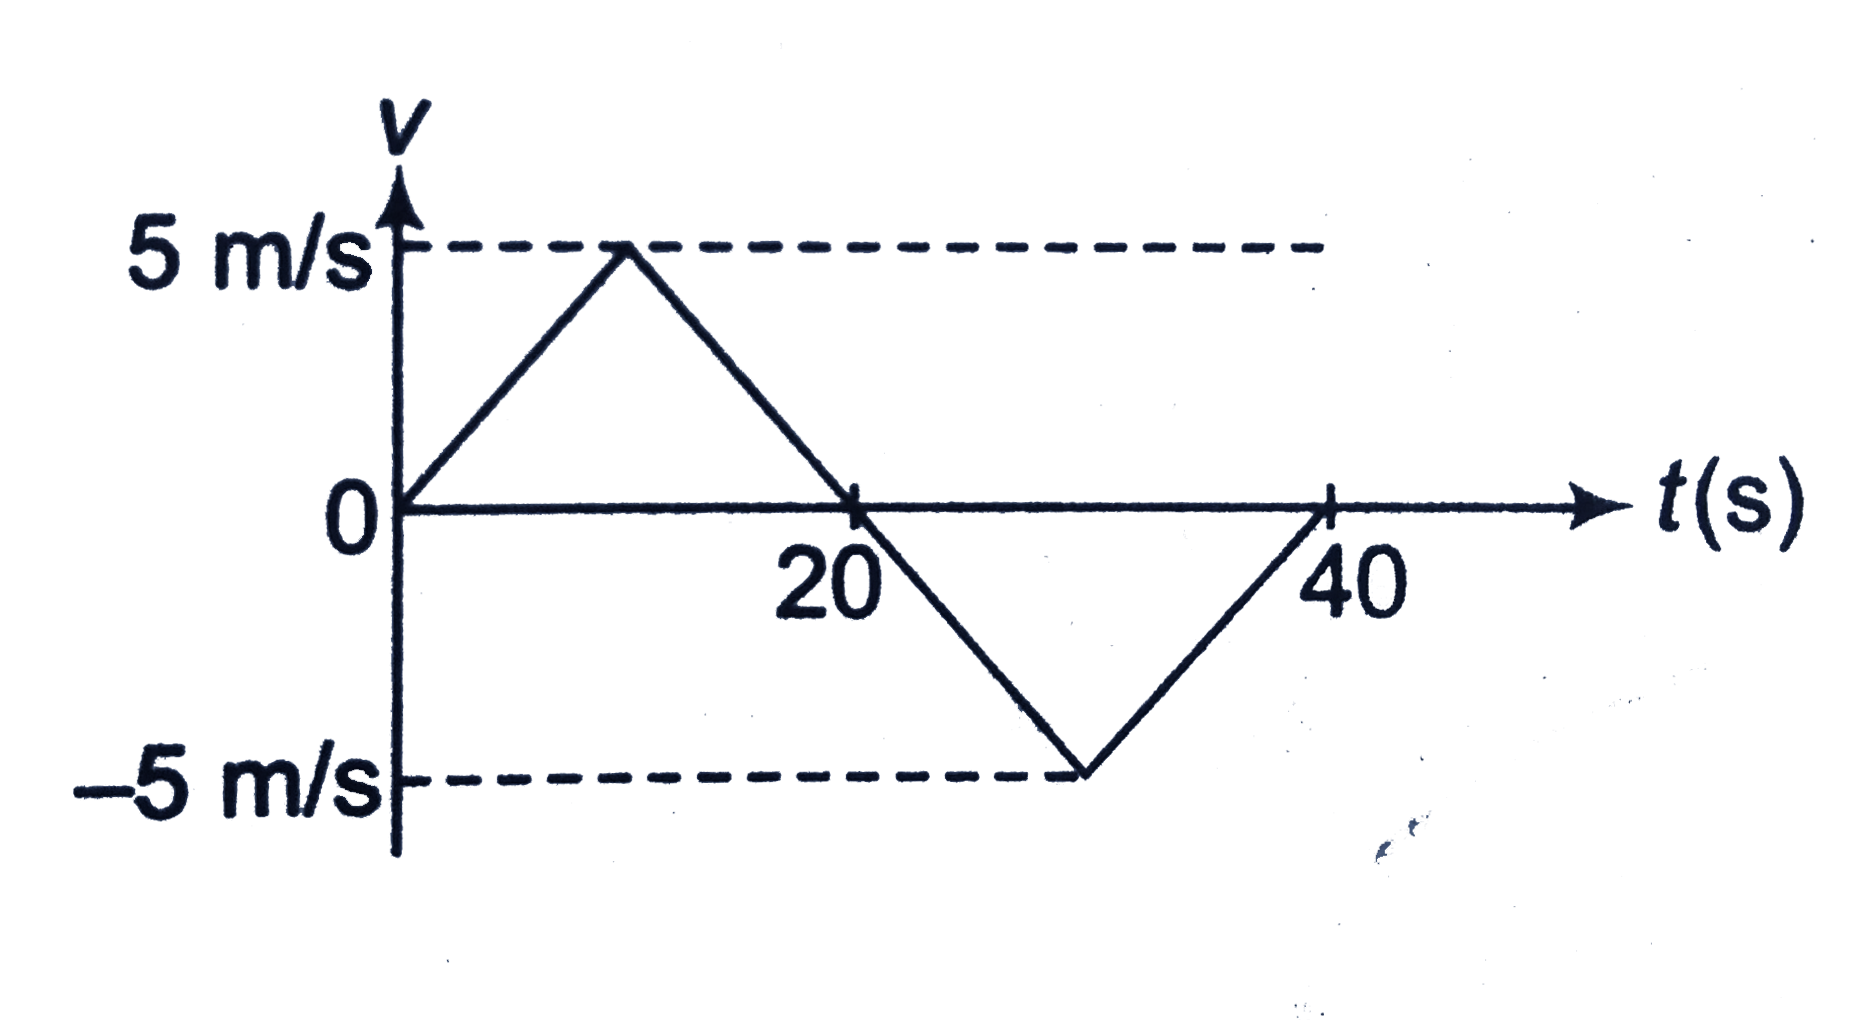
View SolutionFrom the velocity-time plot shown in Fig. find the distance travelled by the particle during the first 40s. Also find the average velocity during this period.
View SolutionThe x−t graph of a particle undergoing simple harmonic motion is shown in figure. Acceleration of particle at t=4/3s is

View SolutionThe x−t graph of a particle undergoing simple harmonic motion is shown in figure. Acceleration of particle at t=4/3s is

View SolutionFig. 2.44 shows the velocity-time graph of a particle moving in a straight line.
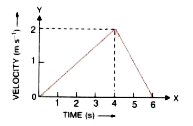
(i) State the nature of motion of particle.
(ii) Find the displacement of particle at t = 6 s.
(iii) Does the particle change its direction of motion ?
(iv) Compare the distance travelled by the particle from 0 to 4 s and from 4 s to 6 s.
(v) Find the acceleration from 0 to 4 s and retardation from 4 s to 6 s.
View Solution

