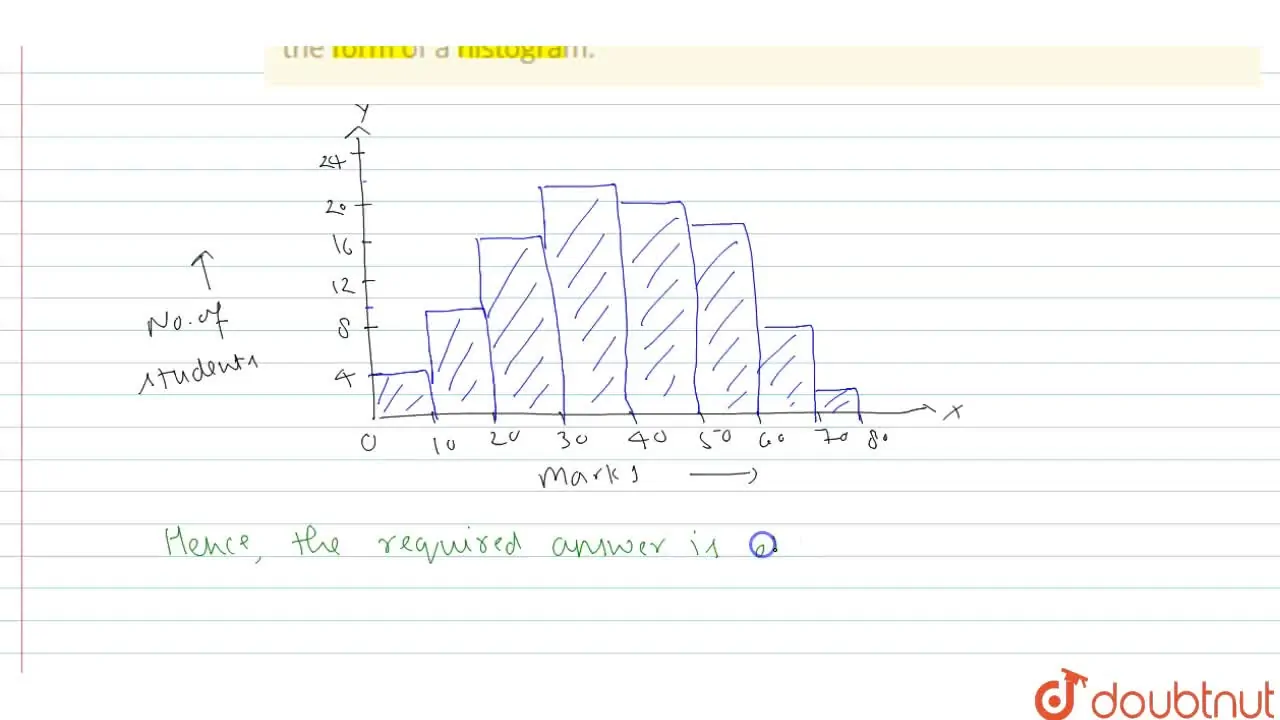
The following table gives the marks scored by
students in an entrance examination.
Represent this data in the form of a histogram.
Marks No. of Students (Frequency)
Step by step video & image solution for The following table gives the marks scored by 100 students in an entrance examination. Represent this data in the form of a histogram.<head> <style> table { font-family: arial, sans-serif; border-collapse: collapse;width: 100%; } td, th { border: 1px solid #BAFBFB ; text-align: left; padding: 8px;} tr:nth-child(even) { background-color: #BAFBFB ;} </style> </head><body><table> <tr> <th>Marks</th> <th>No. of Students (Frequency)</th> </tr> <tr> <td><b>0-10</b></td> <td>4 </td> </tr><tr> <td><b>10-20</b> </td> <td>10</td> </tr><tr> <td><b>20-30</b></td> <td>16</td> </tr><tr> <td><b>30-40</b></td> <td>22</tr> <tr><tr> <td><b>40-50</b></td> <td>20 </tr> <tr> <td><b>50-60</b></td> <td>18 </tr> <tr> <td><b>60-70</b></td> <td>8 </tr> <tr> <td><b>70-80</b></td> <td>2</tr> </table> </body> </html> by Maths experts to help you in doubts & scoring excellent marks in Class 8 exams.
Related Playlists
- BOOK - RD SHARMA ENGLISHCHAPTER - DATA HANDLING-I (CLASSIFICATION AND TABULATION DATA)EXERCISE - All Questions27videos
DATA HANDLING-I (CLASSIFICATION AND TABULATION DATA)
- BOOK - RD SHARMA ENGLISHCHAPTER - DATA HANDLING-III (PIE CHARTS OR CIRCLE GRAPHS)EXERCISE - All Questions37videos
DATA HANDLING-III (PIE CHARTS OR CIRCLE GRAPHS)
Similar Questions
The following is the distribution of weights (in kg) of 50 persons:
Draw a histogram for the above data.
Weight No. of Person (Frequency) 50−55 12 55−60 8 60−65 5 65−70 4 70−75 5 75−80 7 80−85 6 85−90 3 View SolutionThe following data relates to the cost of construction of a house in Delhi.
Draw a pie-diagram to represent the given data.
ITEMS EXPENDITURE cements 30% Steel 10% Bricks 10% Timber 15% Labour 25% Misc. 10% View SolutionThe following table shows the favourite sports of 250 students of a school. Represent the data by a bar graph.
View SolutionThe following table gives the marks of 5 students in Science and Maths.

Find the mean, median, and mode of the marks scored in ScienceView SolutionThe table shows the marks obtained by 25 students in a class test. Find the mean of the marks obtained
 View Solution
The following table gives the marks scored by 100 students in an entrance examination. Marks: 0-10 10-20 20-30 30-40 40-50 50-60 60-70 70-80 No. of Students (Frequency): 4 10 16 22 20 18 8 2 Represent this data in the form of a histogram.
View SolutionFind the mode of the following frequency table, which gives the marks scored by 40 students in a test:
 View Solution
The marks distribution of 30 students m a mathematics examination are given in Table of Example 1. Find the mode of this data.
View SolutionFollowing are the marks obtained by 30 students in a examination

Taking class intervals 0−10,10−20,…..40−50 construct a frequency table.View SolutionDraw a histogram for the marks of students given below:
 View Solution


