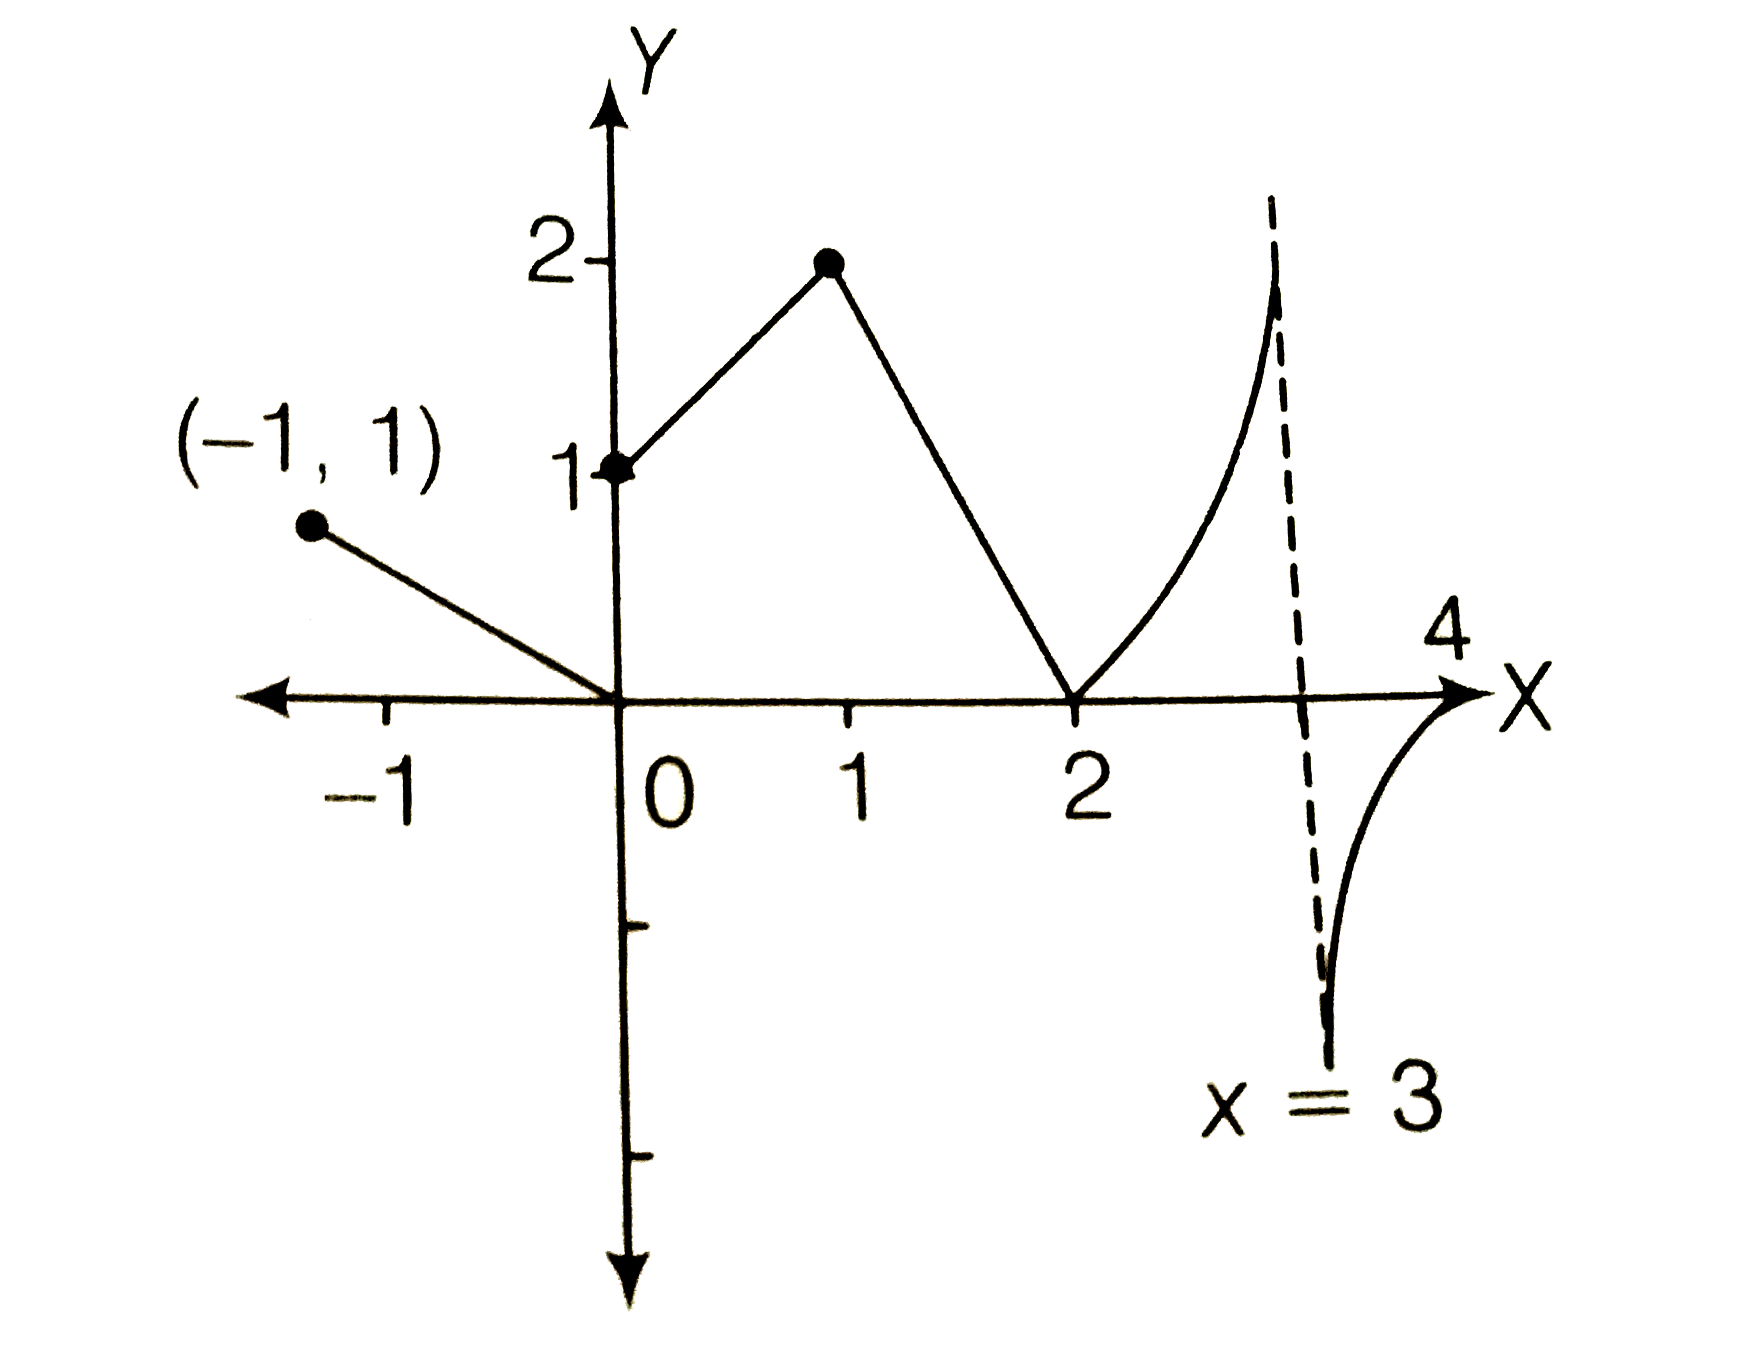
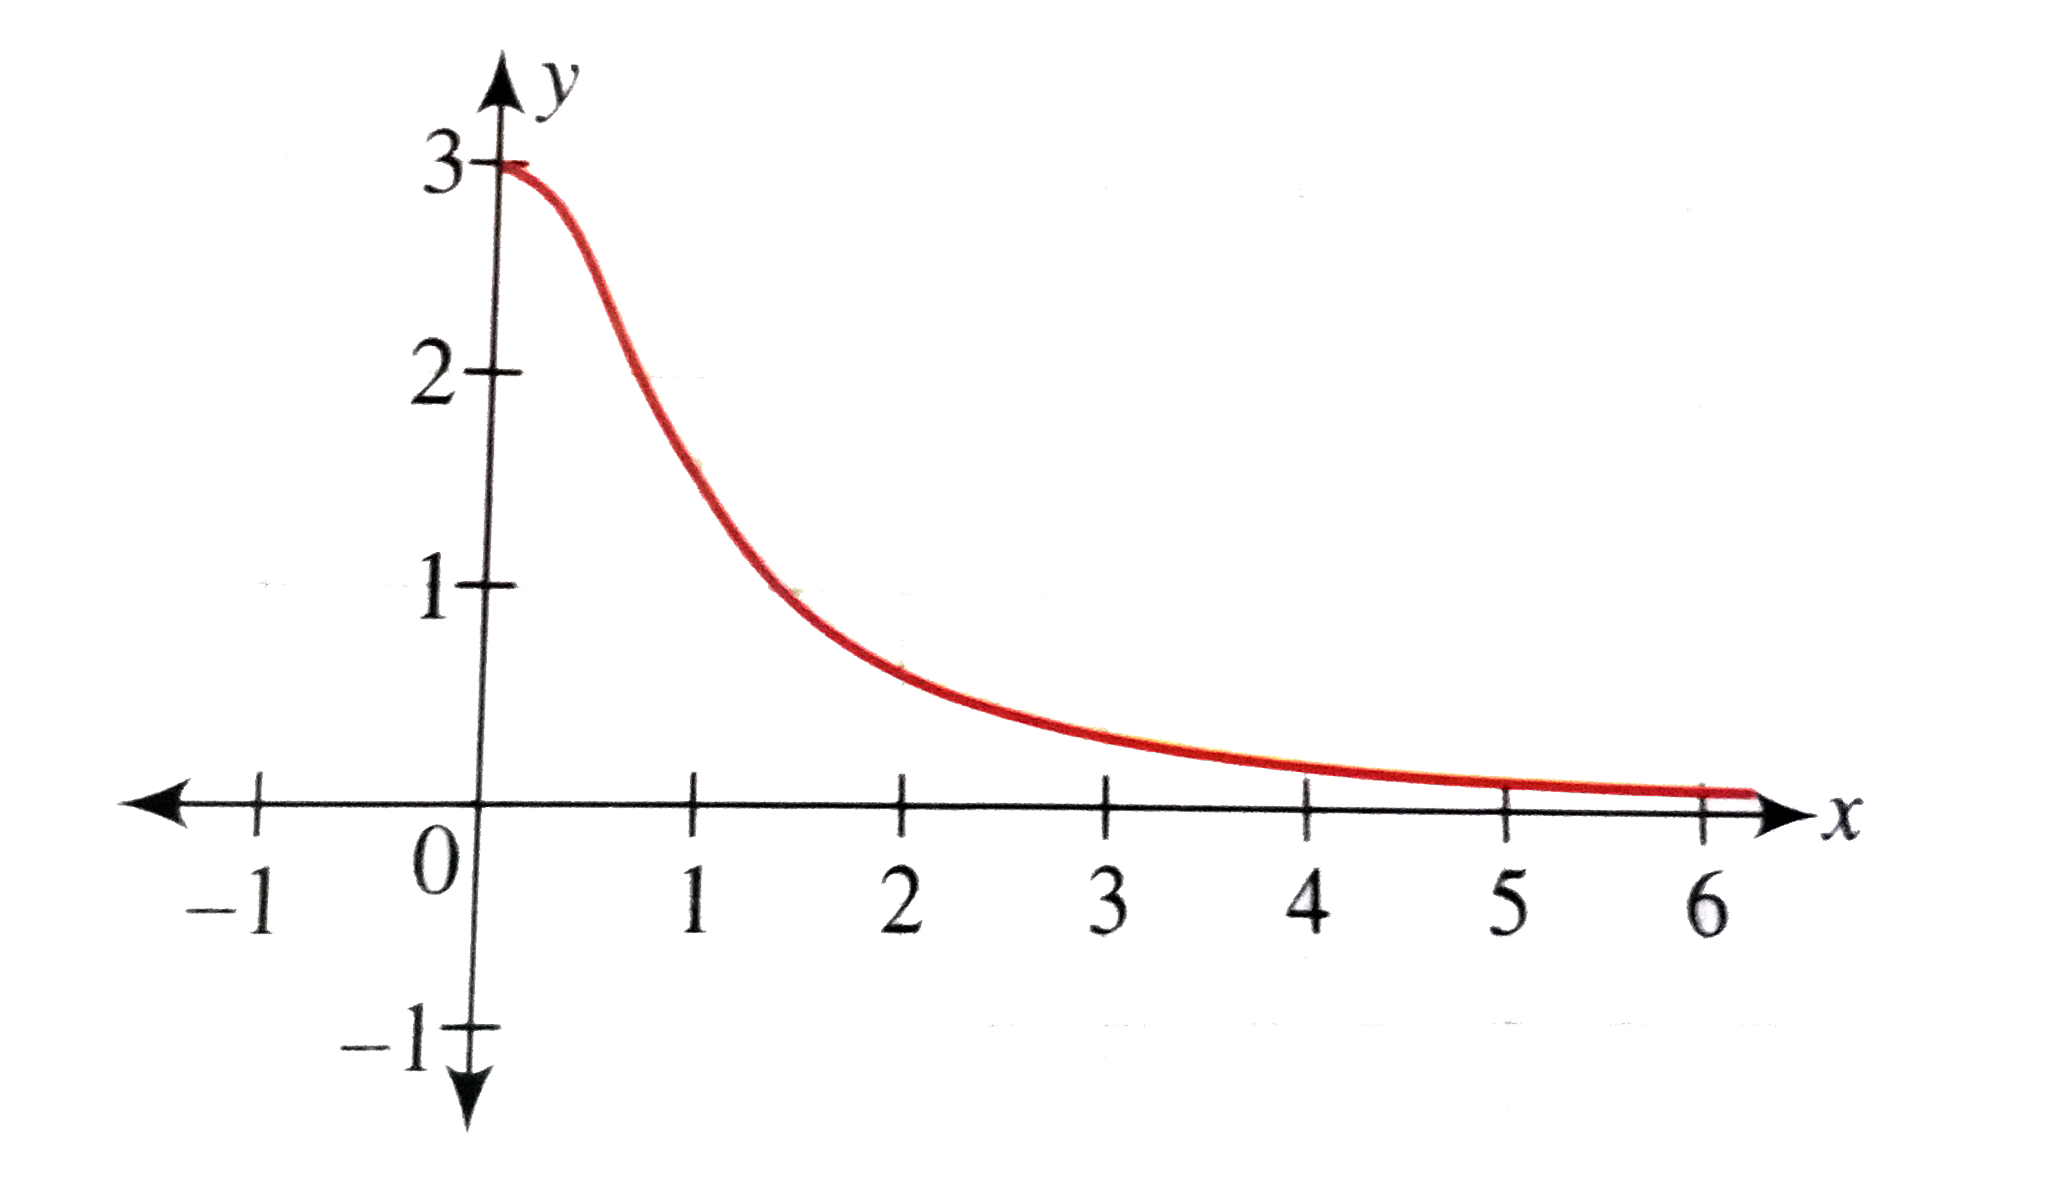
If graph of a function f(x) which is defined in [-1, 4] is shown in the following figure then identify the correct statement(s).
![If graph of a function f(x) which is defined in [-1, 4] is shown in the following figure then identify the correct statement(s).](https://d10lpgp6xz60nq.cloudfront.net/physics_images/CEN_CAL_C01_E17_027_Q01.png)
domain of f(|x|−1) is [−5,5]
range of f(|x|+1) is [0,2]
range of f(−|x|) is [−1,0]
domain of f[−3,3]
The correct Answer is:A, B, C
(a) −1≤|x|−1≤4⇒0≤|x|≤5⇒−5≤x≤5
(b) f(|x|+1)
range of f(|x|+1) is [0, 2]

range of f(−|x|) is [−1,0]

(d) −1≤|x|≤4⇒x∈[−4,4]
Topper's Solved these Questions
- FUNCTIONSBOOK - CENGAGE ENGLISHCHAPTER - FUNCTIONSEXERCISE - Comprehension Type
7 Videos
- FUNCTIONSBOOK - CENGAGE ENGLISHCHAPTER - FUNCTIONSEXERCISE - Comprehension Type
7 Videos
- EQUATION OF PLANE AND ITS APPLICATIONS -IIBOOK - CENGAGE ENGLISHCHAPTER - EQUATION OF PLANE AND ITS APPLICATIONS -IIEXERCISE - DPP 3.4
14 Videos
- GETTING STARTED WITH GRAPHSBOOK - CENGAGE ENGLISHCHAPTER - GETTING STARTED WITH GRAPHSEXERCISE - Exercises 1.18
1 Videos
Similar Questions
The graph of a function fx) which is defined in [-1, 4] is shown in the adjacent figure. Identify the correct statement(s). (1) domain of f(|x|)−1)is[−5,5] (2) range of f(|x|+1) is [0,2] (3) range of f(−|x|) is [-1,0] (4) domain of f(|x|)is[−3,3]
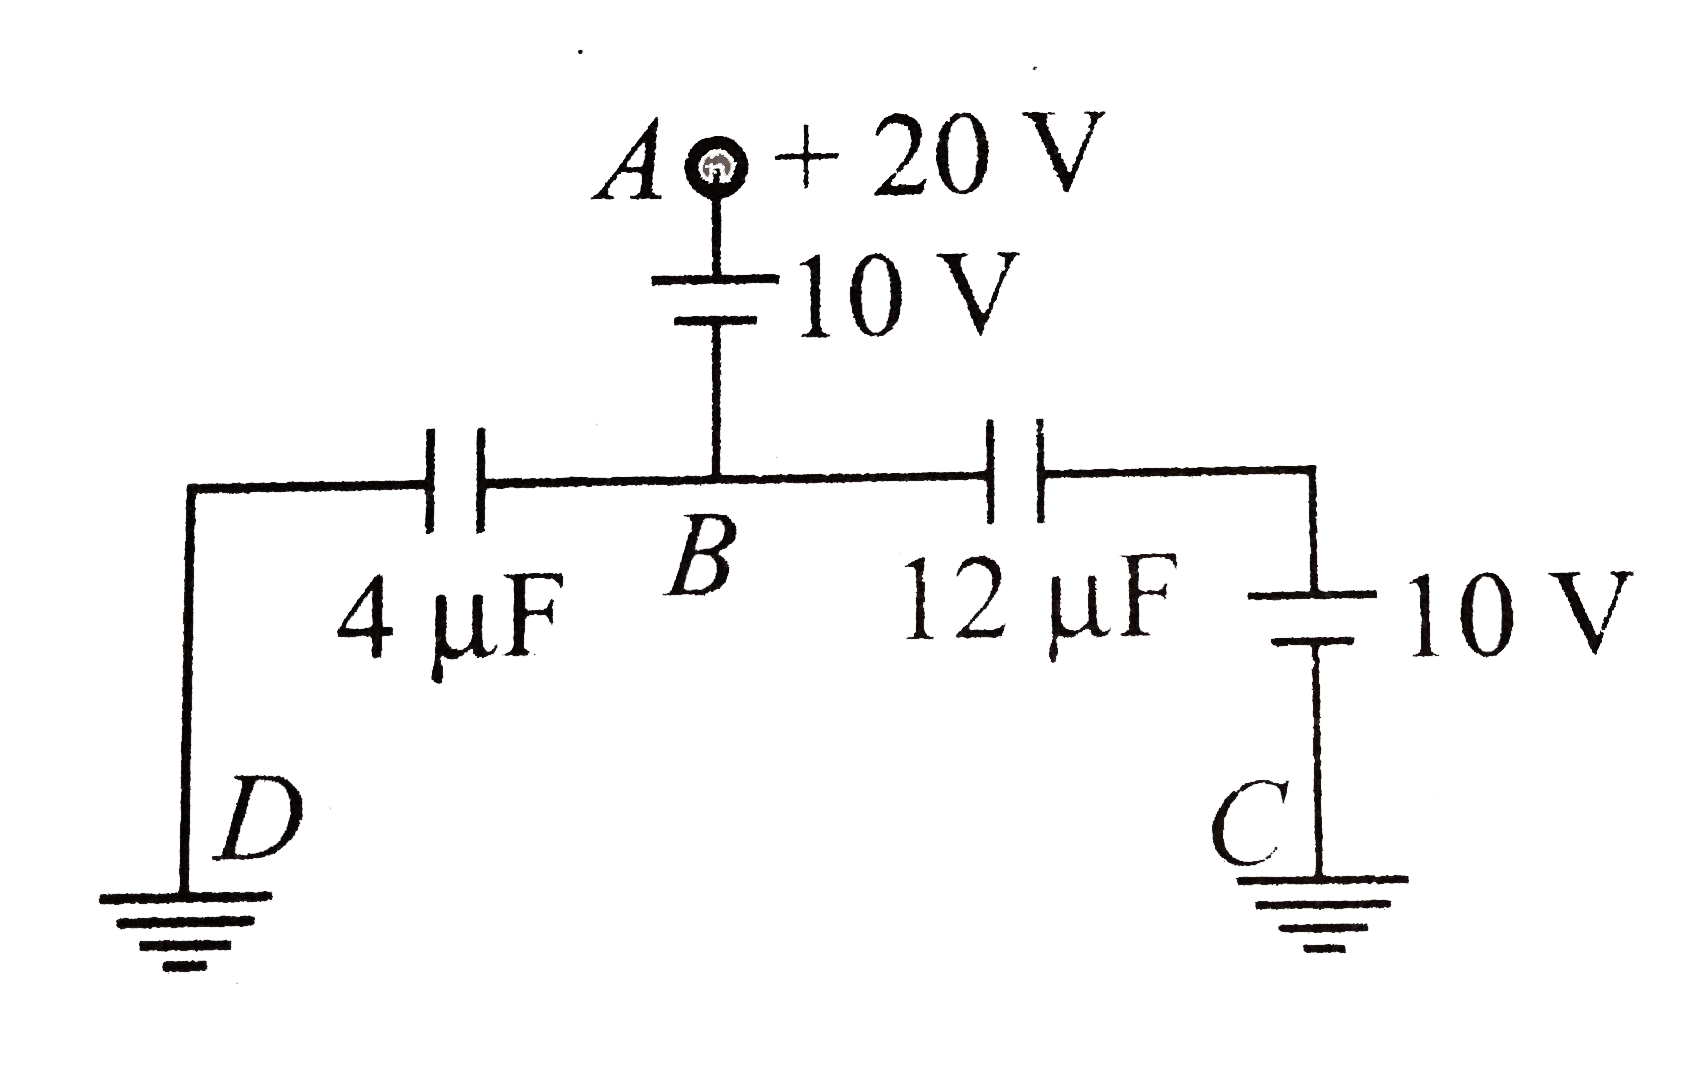
View SolutionFor the arrangement shown in figure identify the correct statement.
View SolutionThe graph of the function y=f(x) is shown in the adjacent figure then correct statement is
View SolutionThe graph of y=f(x) is as shown in the following figure.
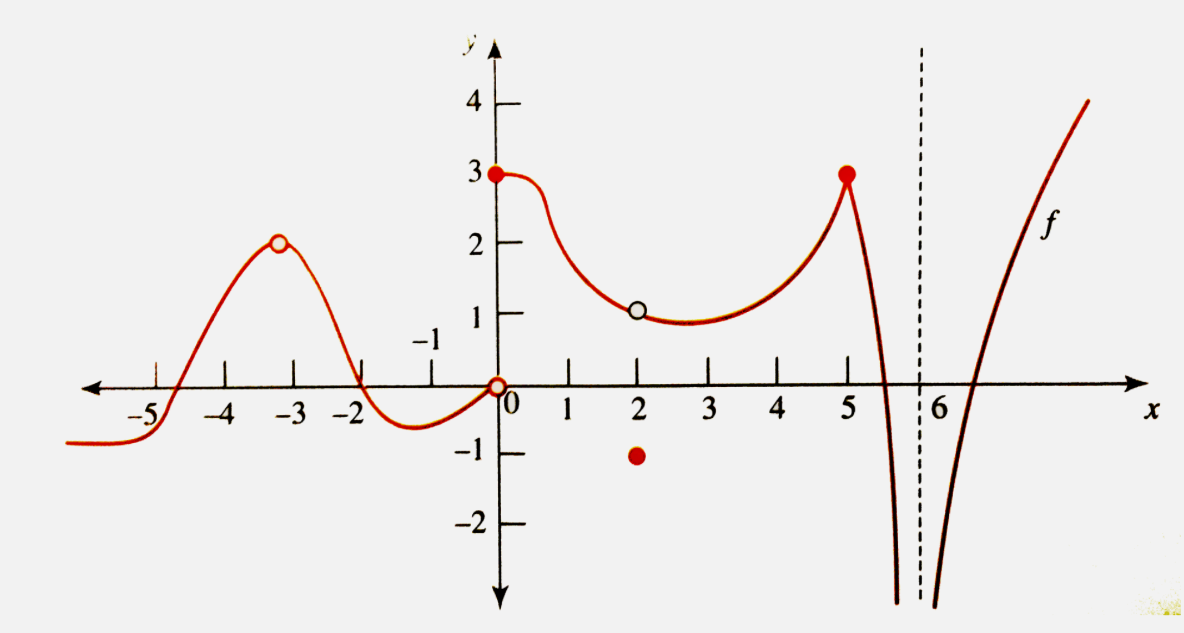
Identify the points of discontinuity and give the reason for the same.
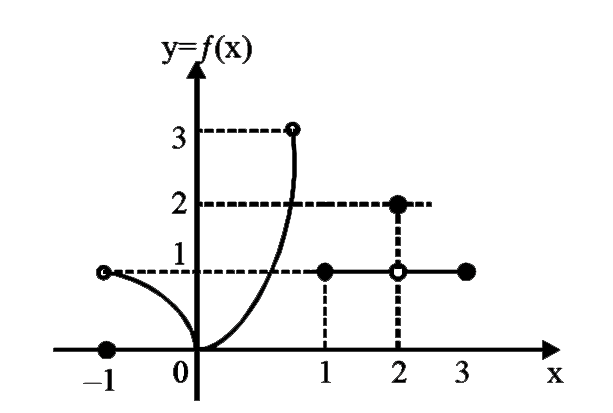
View SolutionIf f(x) is defined in −1≤x≤3 in the figure as shown then choose correct option
View SolutionTo verify Ohm's law, a student connects the voltmeter across the battery as shown in the figure. The measure voltage is plotted as a function of the current, and the following graph is obtained
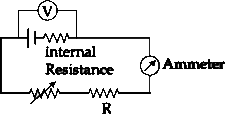
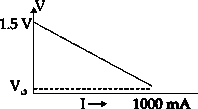
if VO is almost zero. identify the correct statement
View SolutionA function f is defined by f(x)=exsinx in [0,π]. Which of the following is not correct?
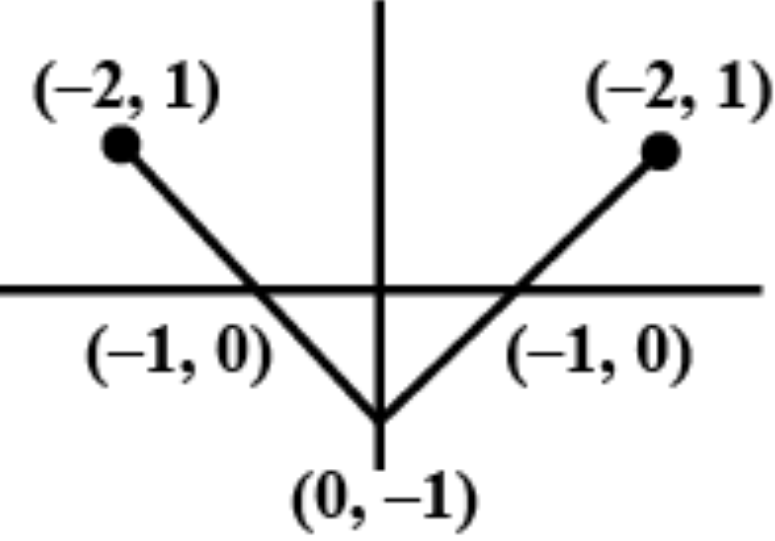
View SolutionThe graph of the function y=f(x). Then which of the following curve represent the graph of the function y=|f(x)|
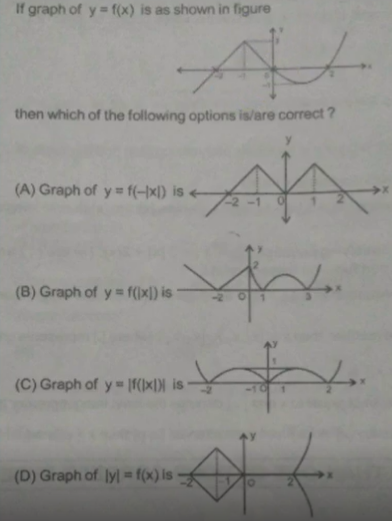
View SolutionIf graph of y= f(x) is as shown in figure, then which of the following options is/are correct?
View SolutionThe graph of y=f(x) is as shown in the following figure. Draw the graph of y=[f(x)].
View Solution
