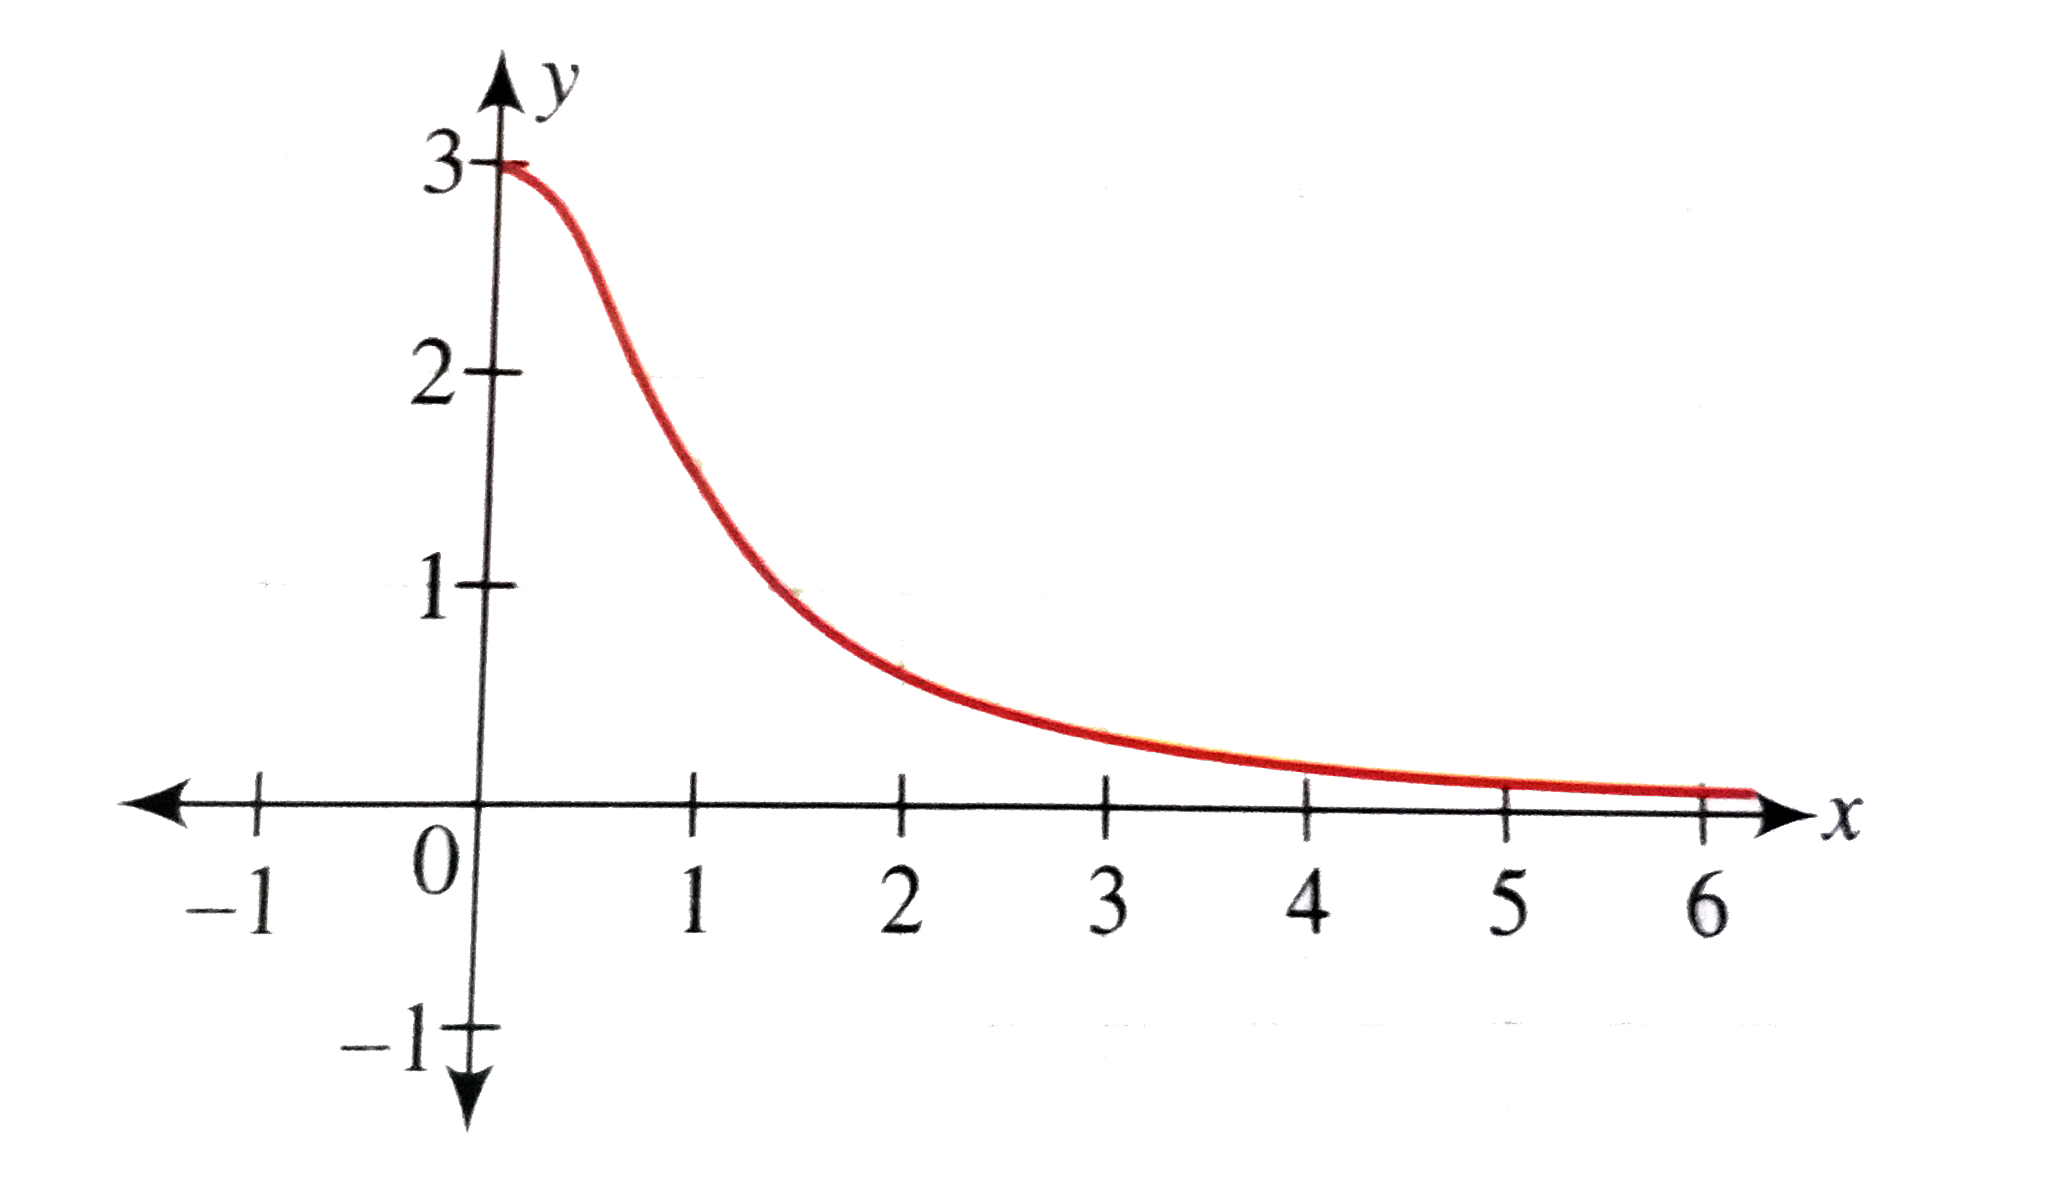
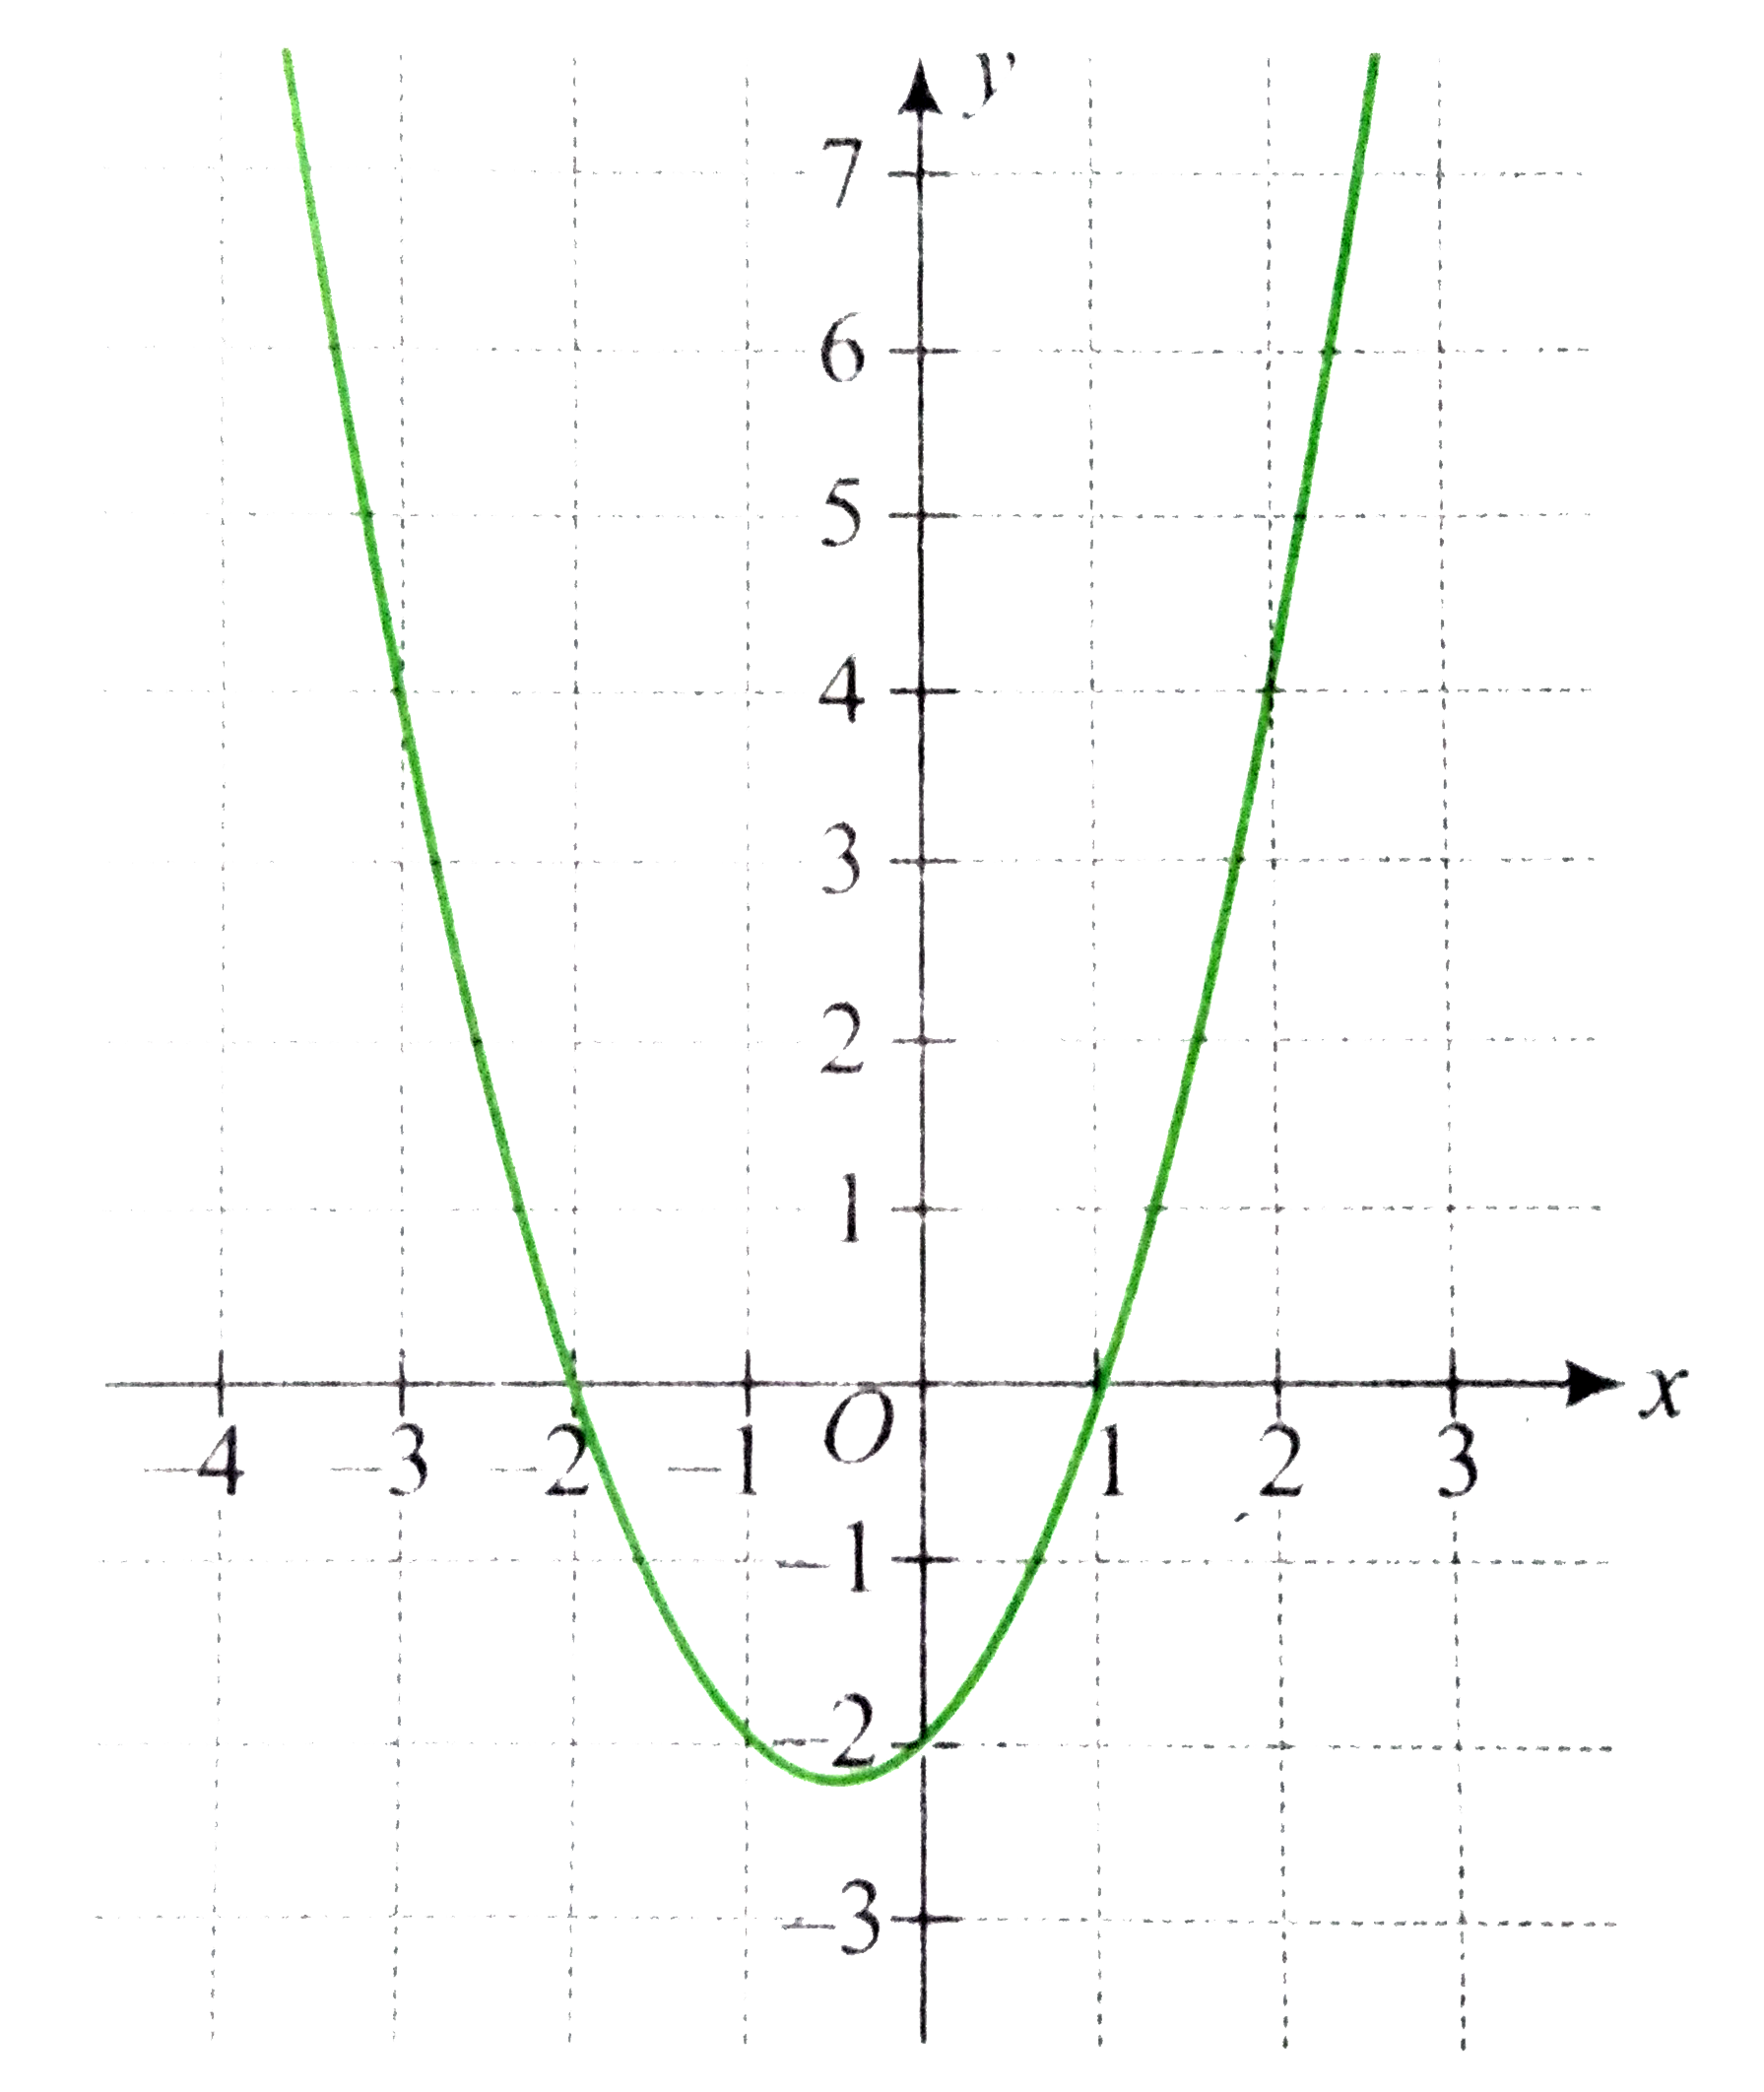
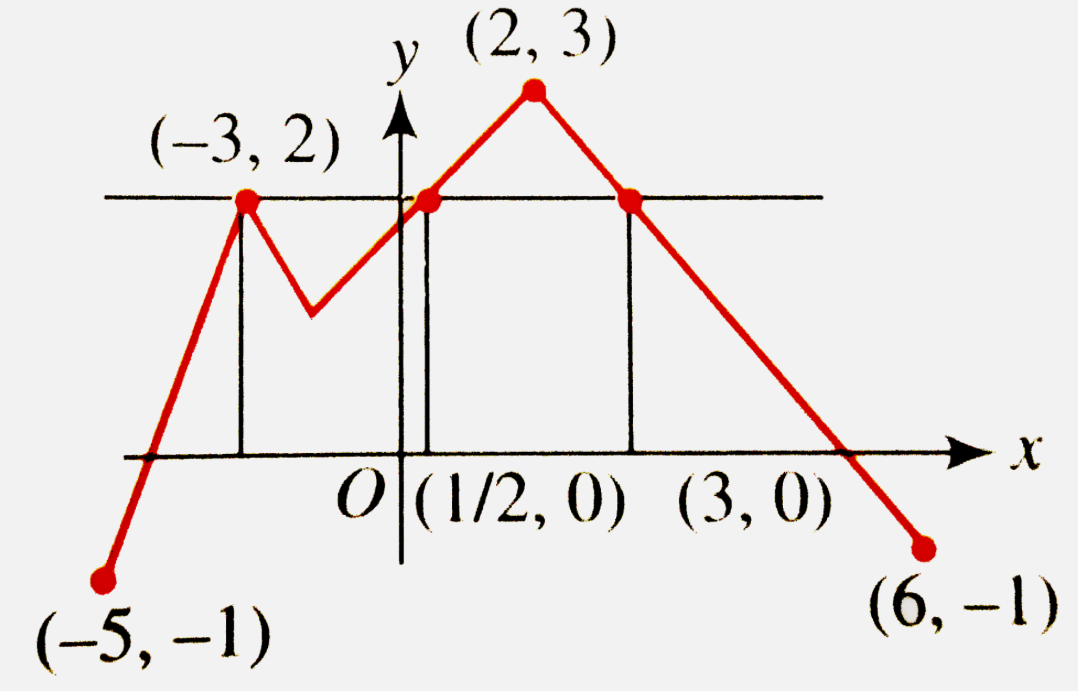
The graph of y = f(x) is as shown in the following figure.
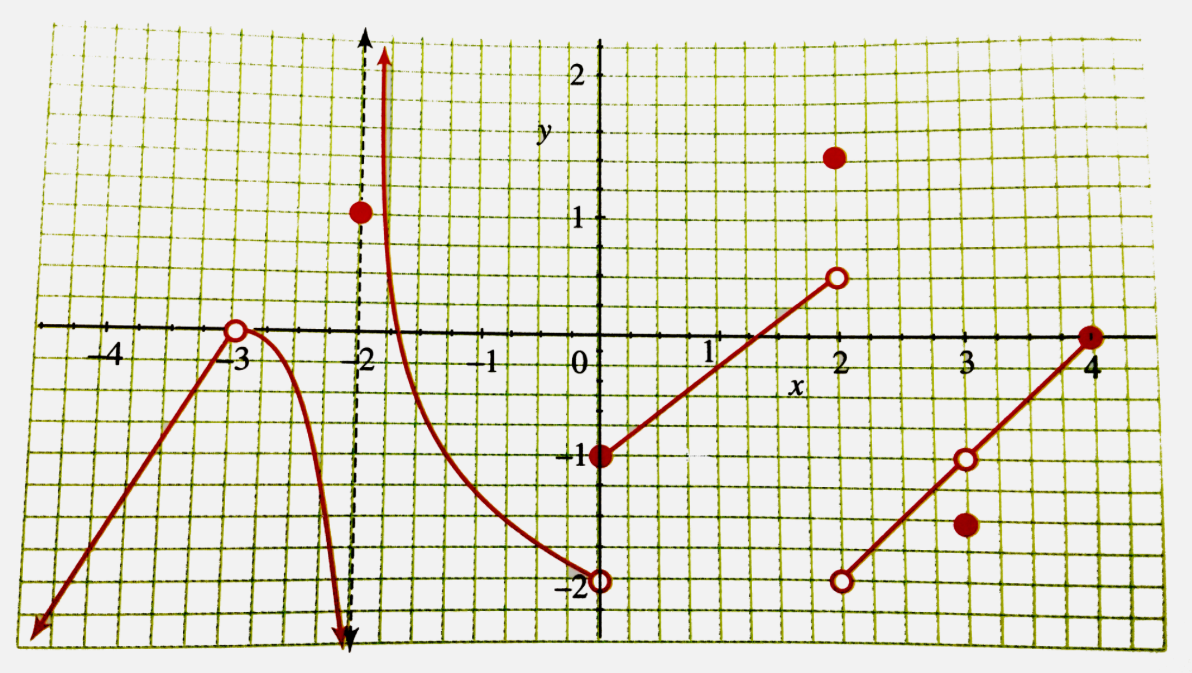
Find the following values
(i)
(iv)
(vii)
(x iii)
Video Solution
Text Solution
(i) f(-3) does not exist
(iii)
(v)
(vii)
(viii)
(i x)
(x i)
(x iii)
|
Topper's Solved these Questions
- GETTING STARTED WITH GRAPHSBook:CENGAGE ENGLISHChapter:GETTING STARTED WITH GRAPHSExercise:Exercises 1.8
Explore 1 Video
- GETTING STARTED WITH GRAPHSBook:CENGAGE ENGLISHChapter:GETTING STARTED WITH GRAPHSExercise:Exercises 1.9
Explore 1 Video
- GETTING STARTED WITH GRAPHSBook:CENGAGE ENGLISHChapter:GETTING STARTED WITH GRAPHSExercise:Exercises 1.6
Explore 1 Video
- FUNCTIONSBook:CENGAGE ENGLISHChapter:FUNCTIONSExercise:Comprehension Type
Explore 7 Videos
- GRAPH OF INVERSE TRIGONOMETRIC FUNCTIONSBook:CENGAGE ENGLISHChapter:GRAPH OF INVERSE TRIGONOMETRIC FUNCTIONSExercise:Exercises
Explore 18 Videos
Similar Questions
Knowledge Check
The graph of y=f(x) is shown below.
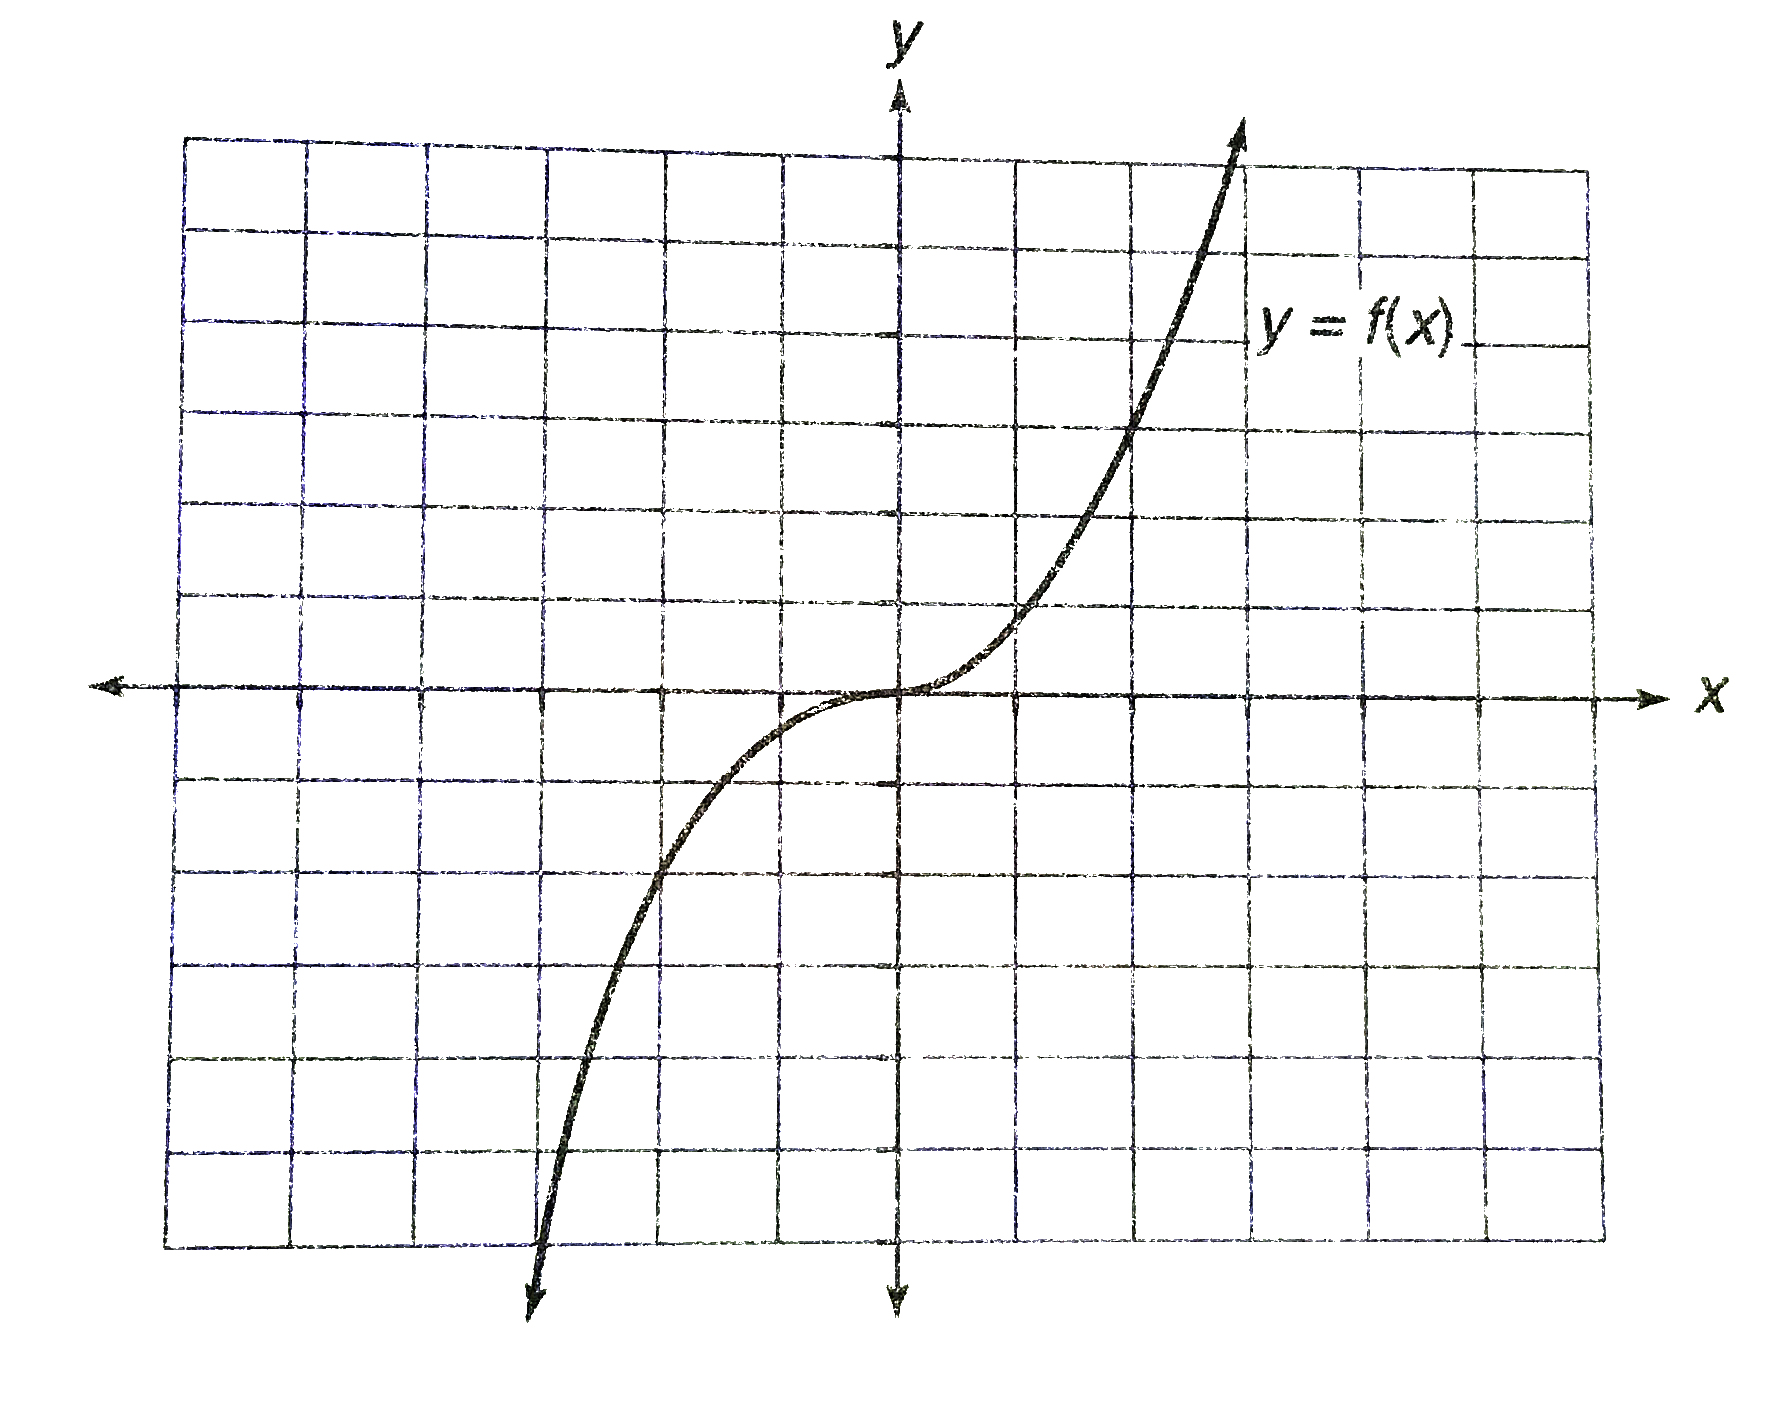
Which of the following could represents the graph of y=f(x−2)+1?A B
B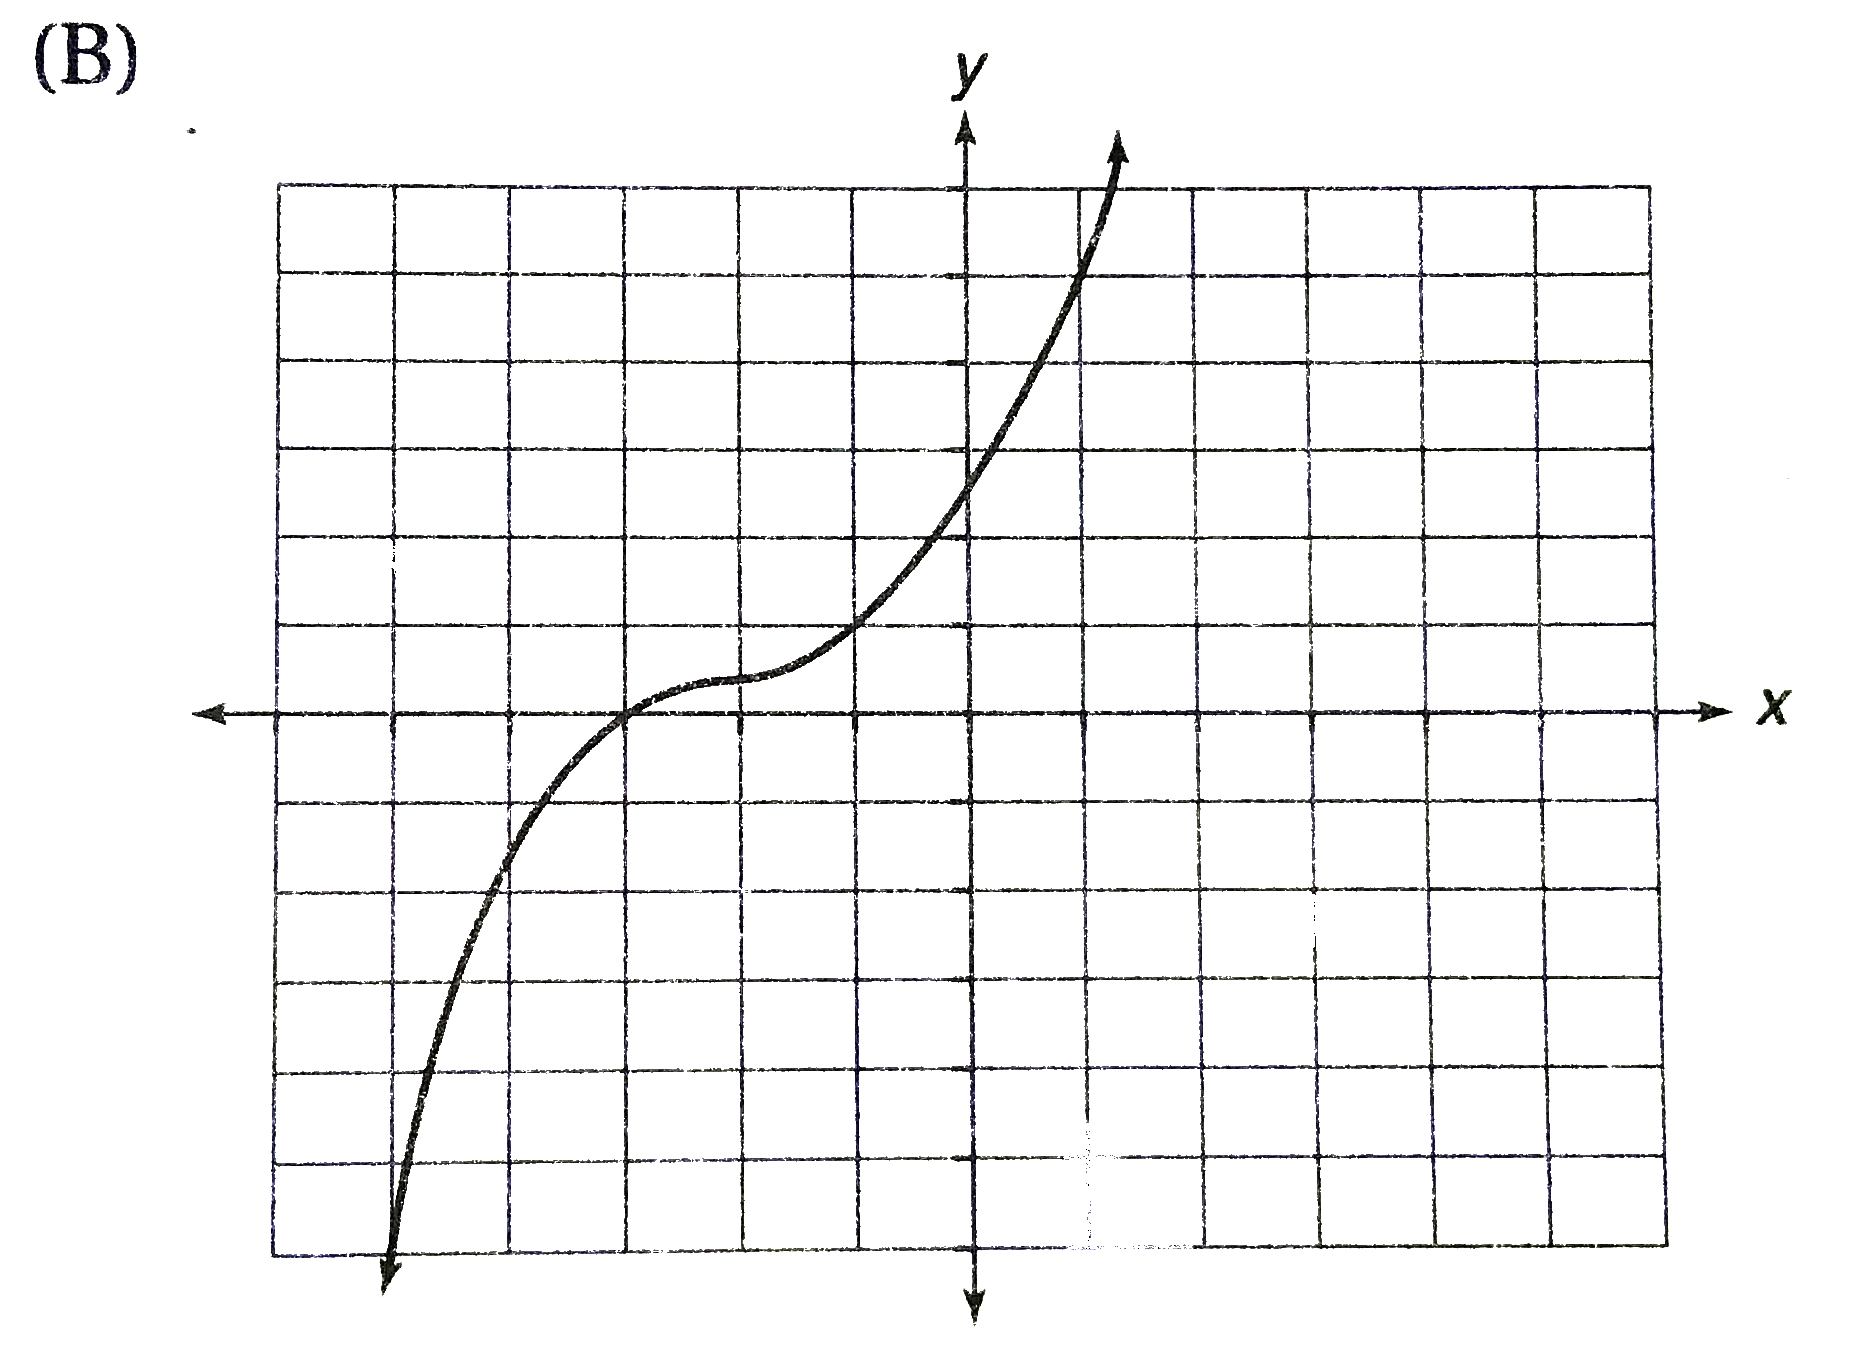 C
C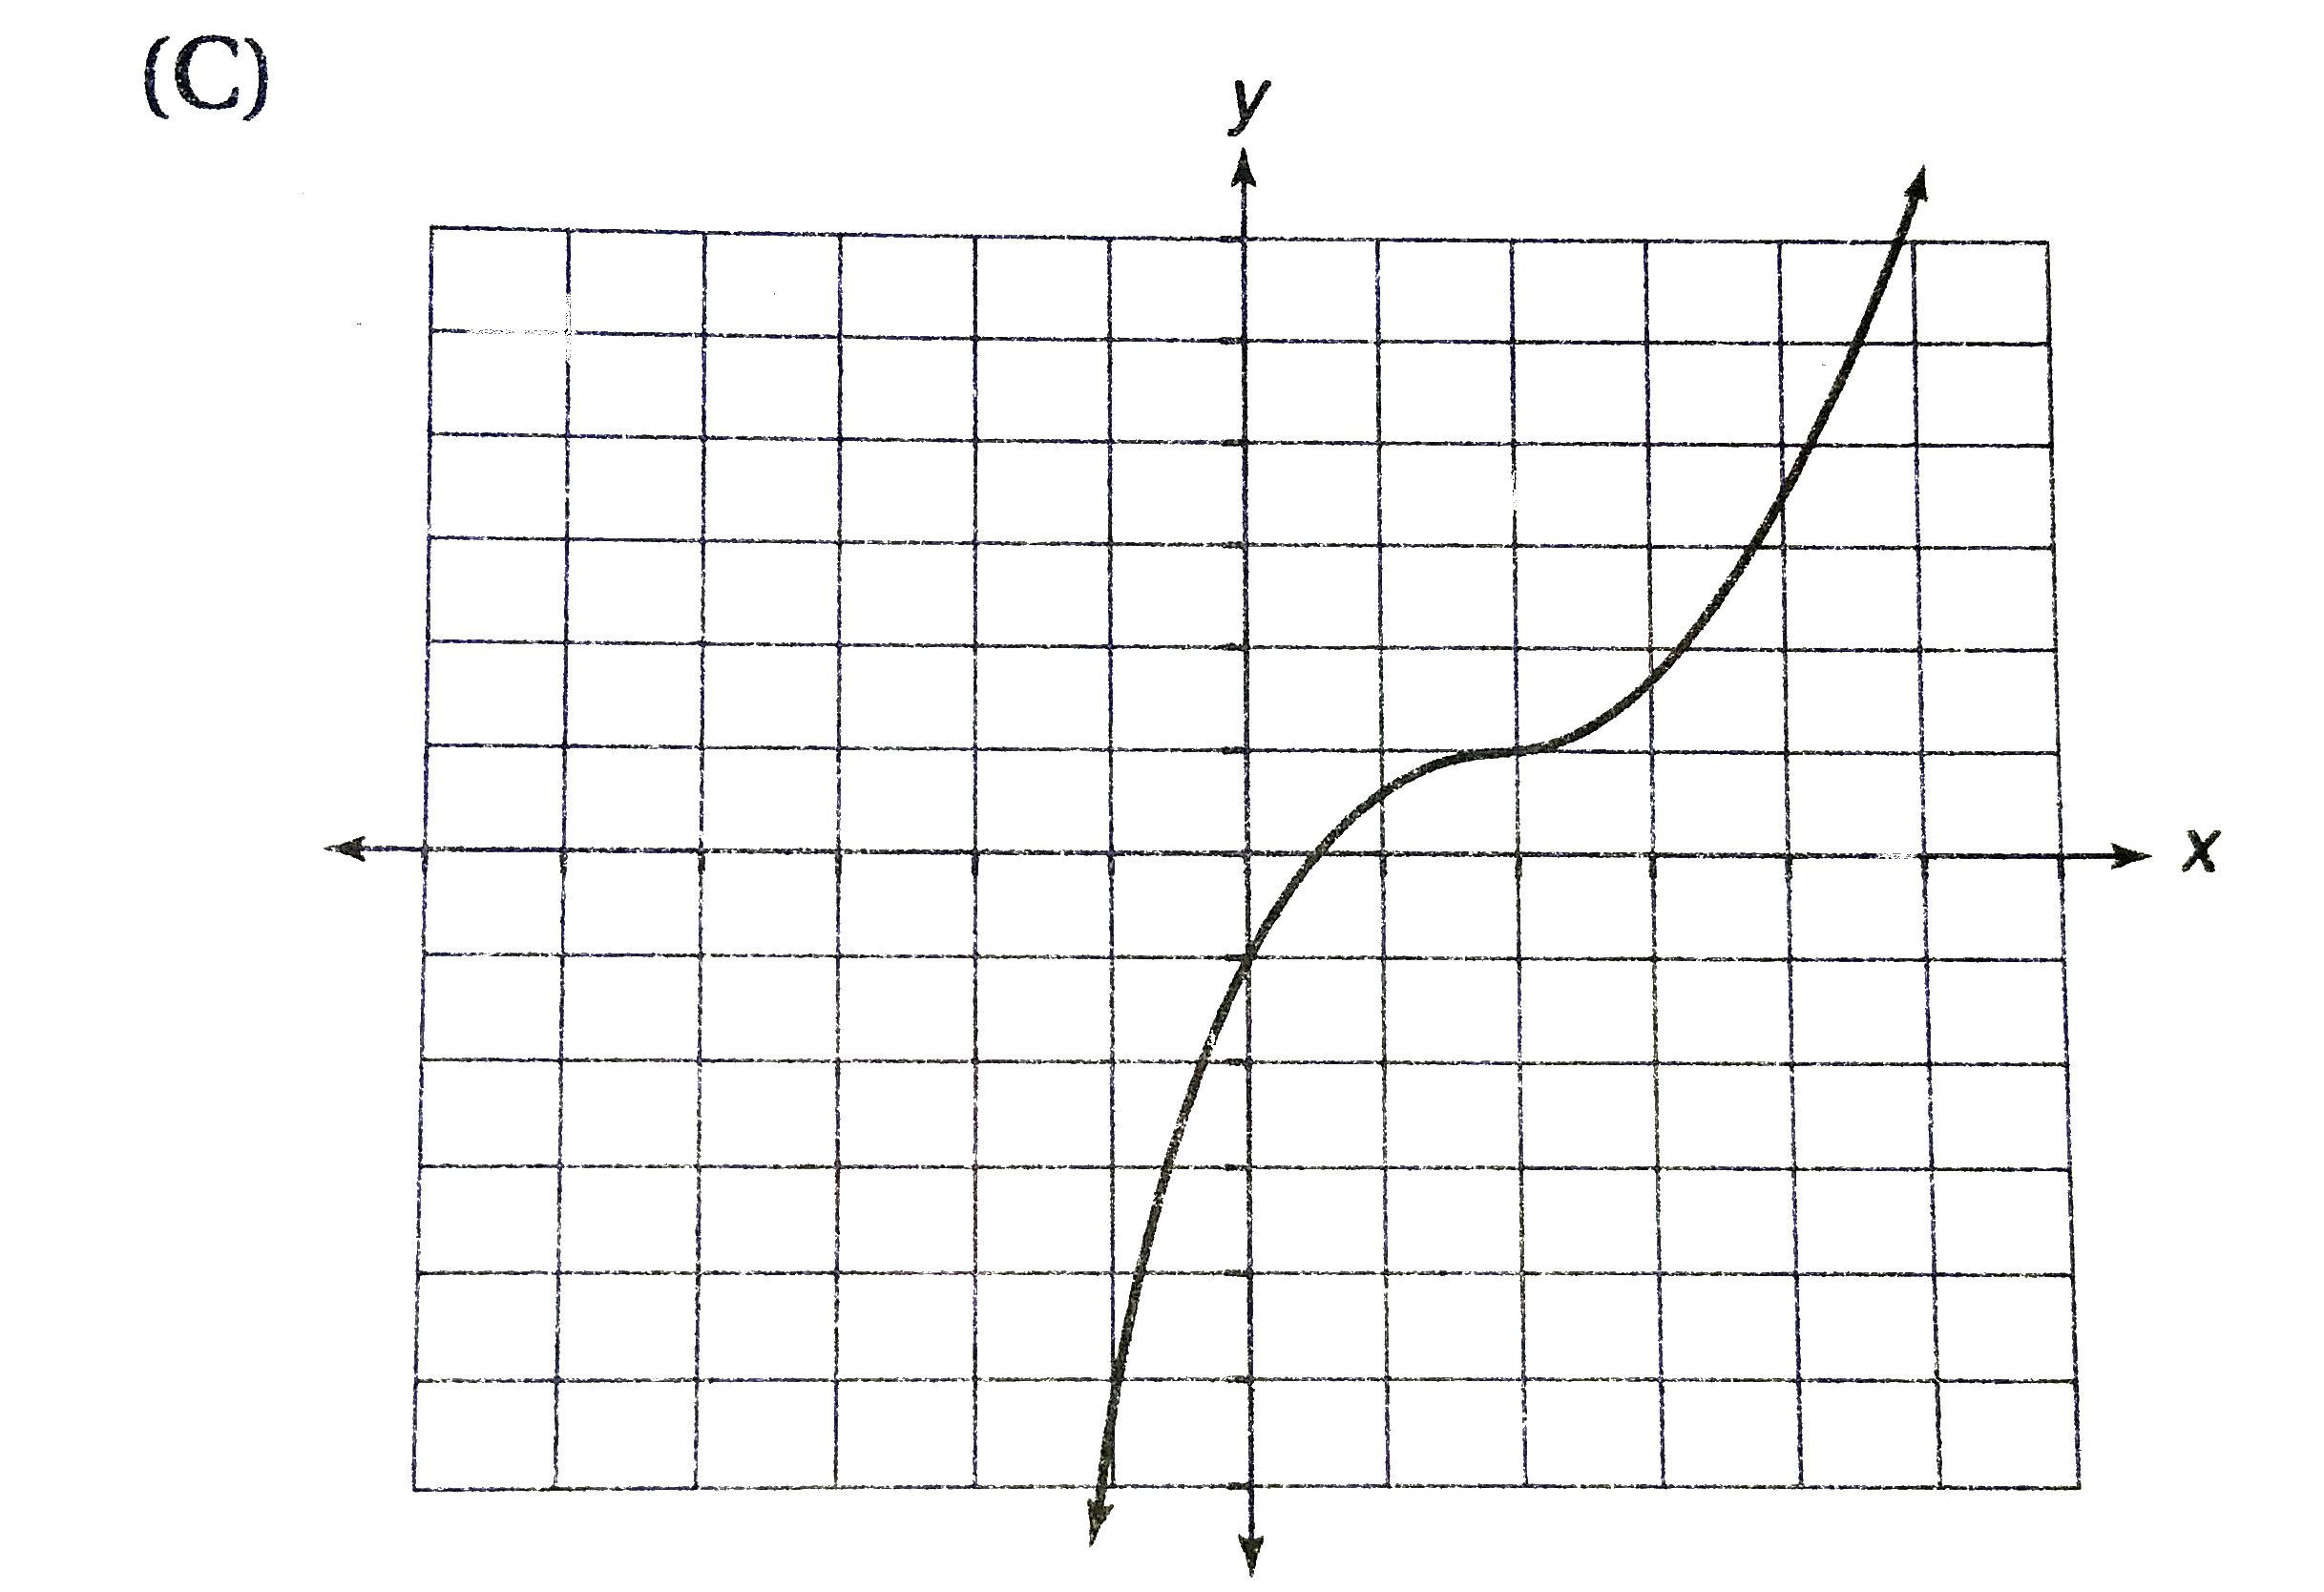 D
D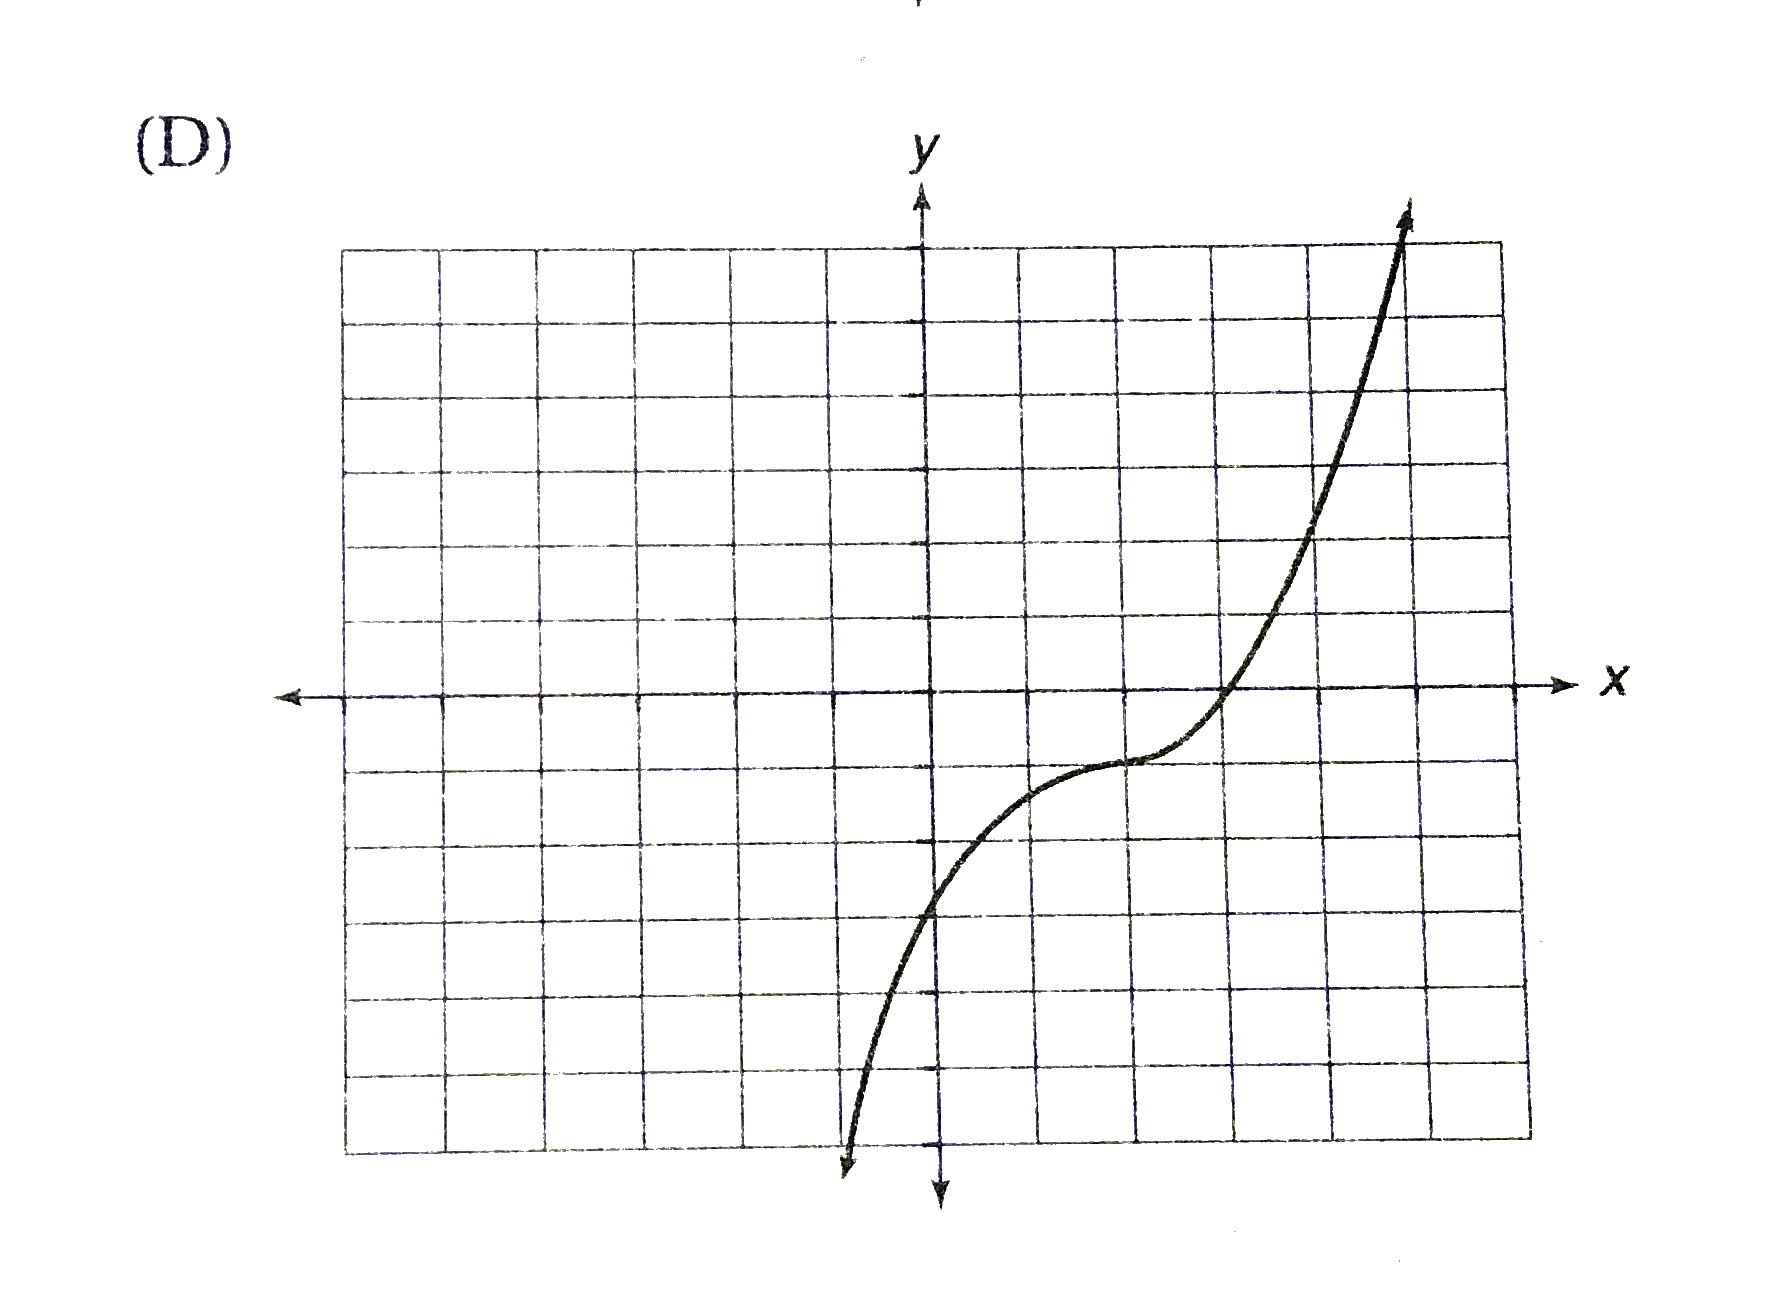
The graph of y=f(x) is shown to the right. If f(−1)=v, then which one of the following could be the value of f(v) ?
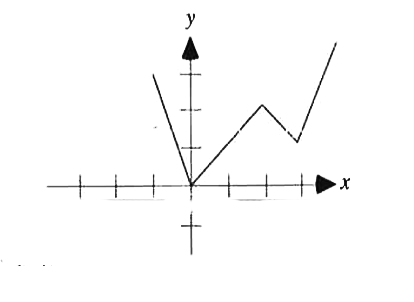 A0B1C2D2.5
The graph y = f (x) is as shown:
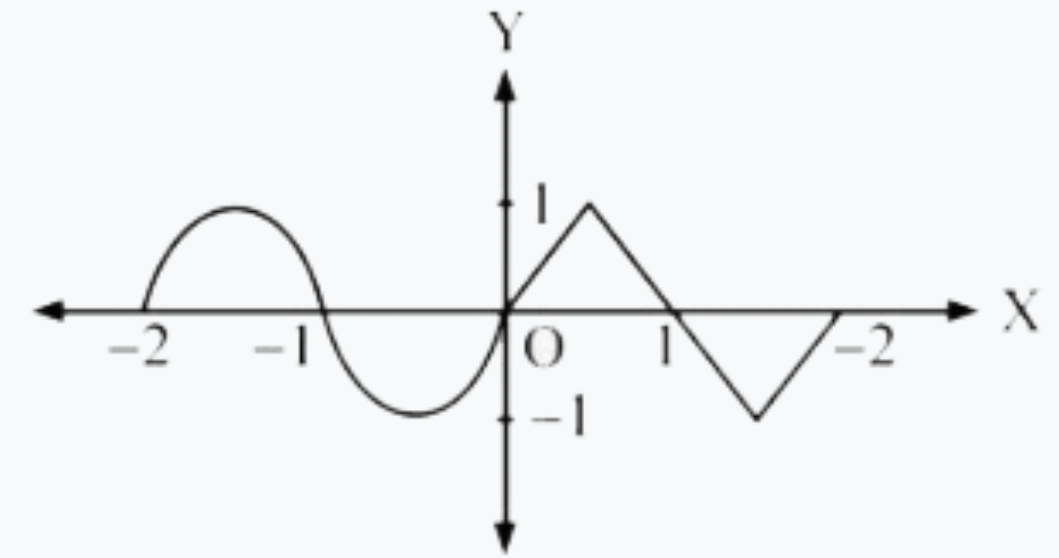
The graph of y = f (–|x|) is:
View SolutionThe graph of y = f(x) is shown, find the number of solution of f(f(x)) = 2.
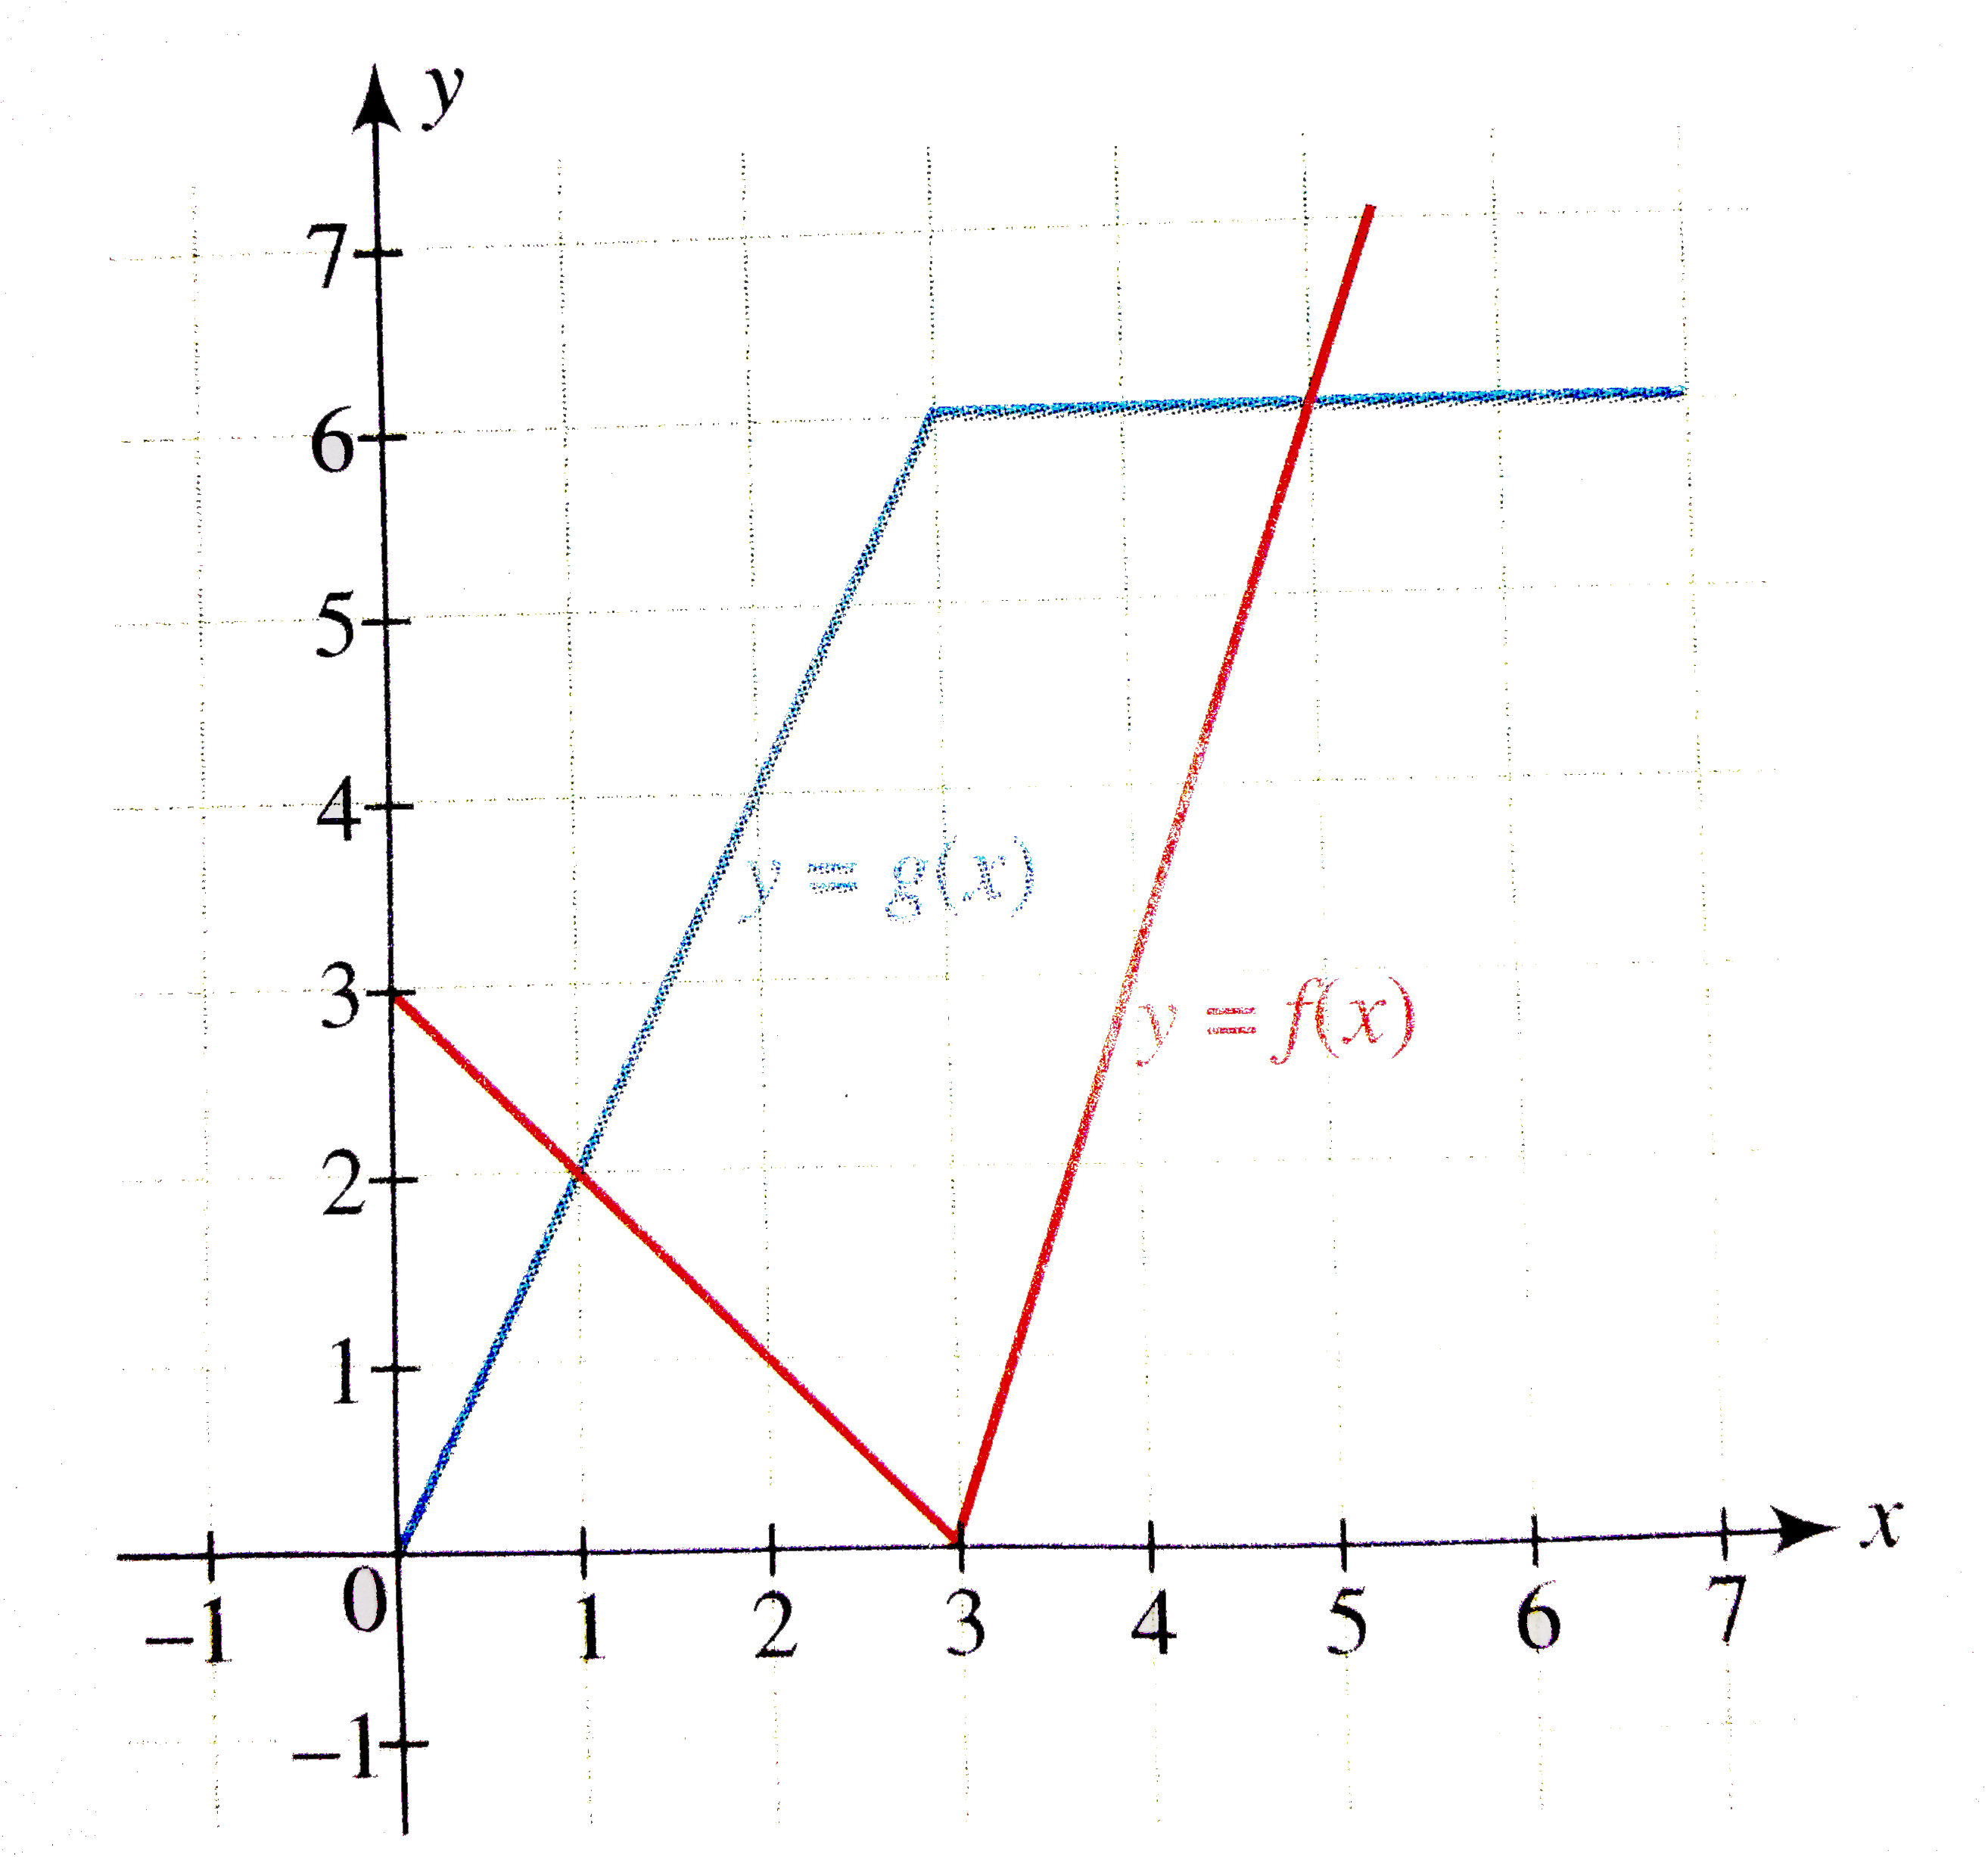
View SolutionGraph of y=f(x)andy=g(x) is given in the following figure. If h(x)=f(g(x)), then find the value of h'(2).
View SolutionThe graph of the function y=f(x) is as shown in the figure.
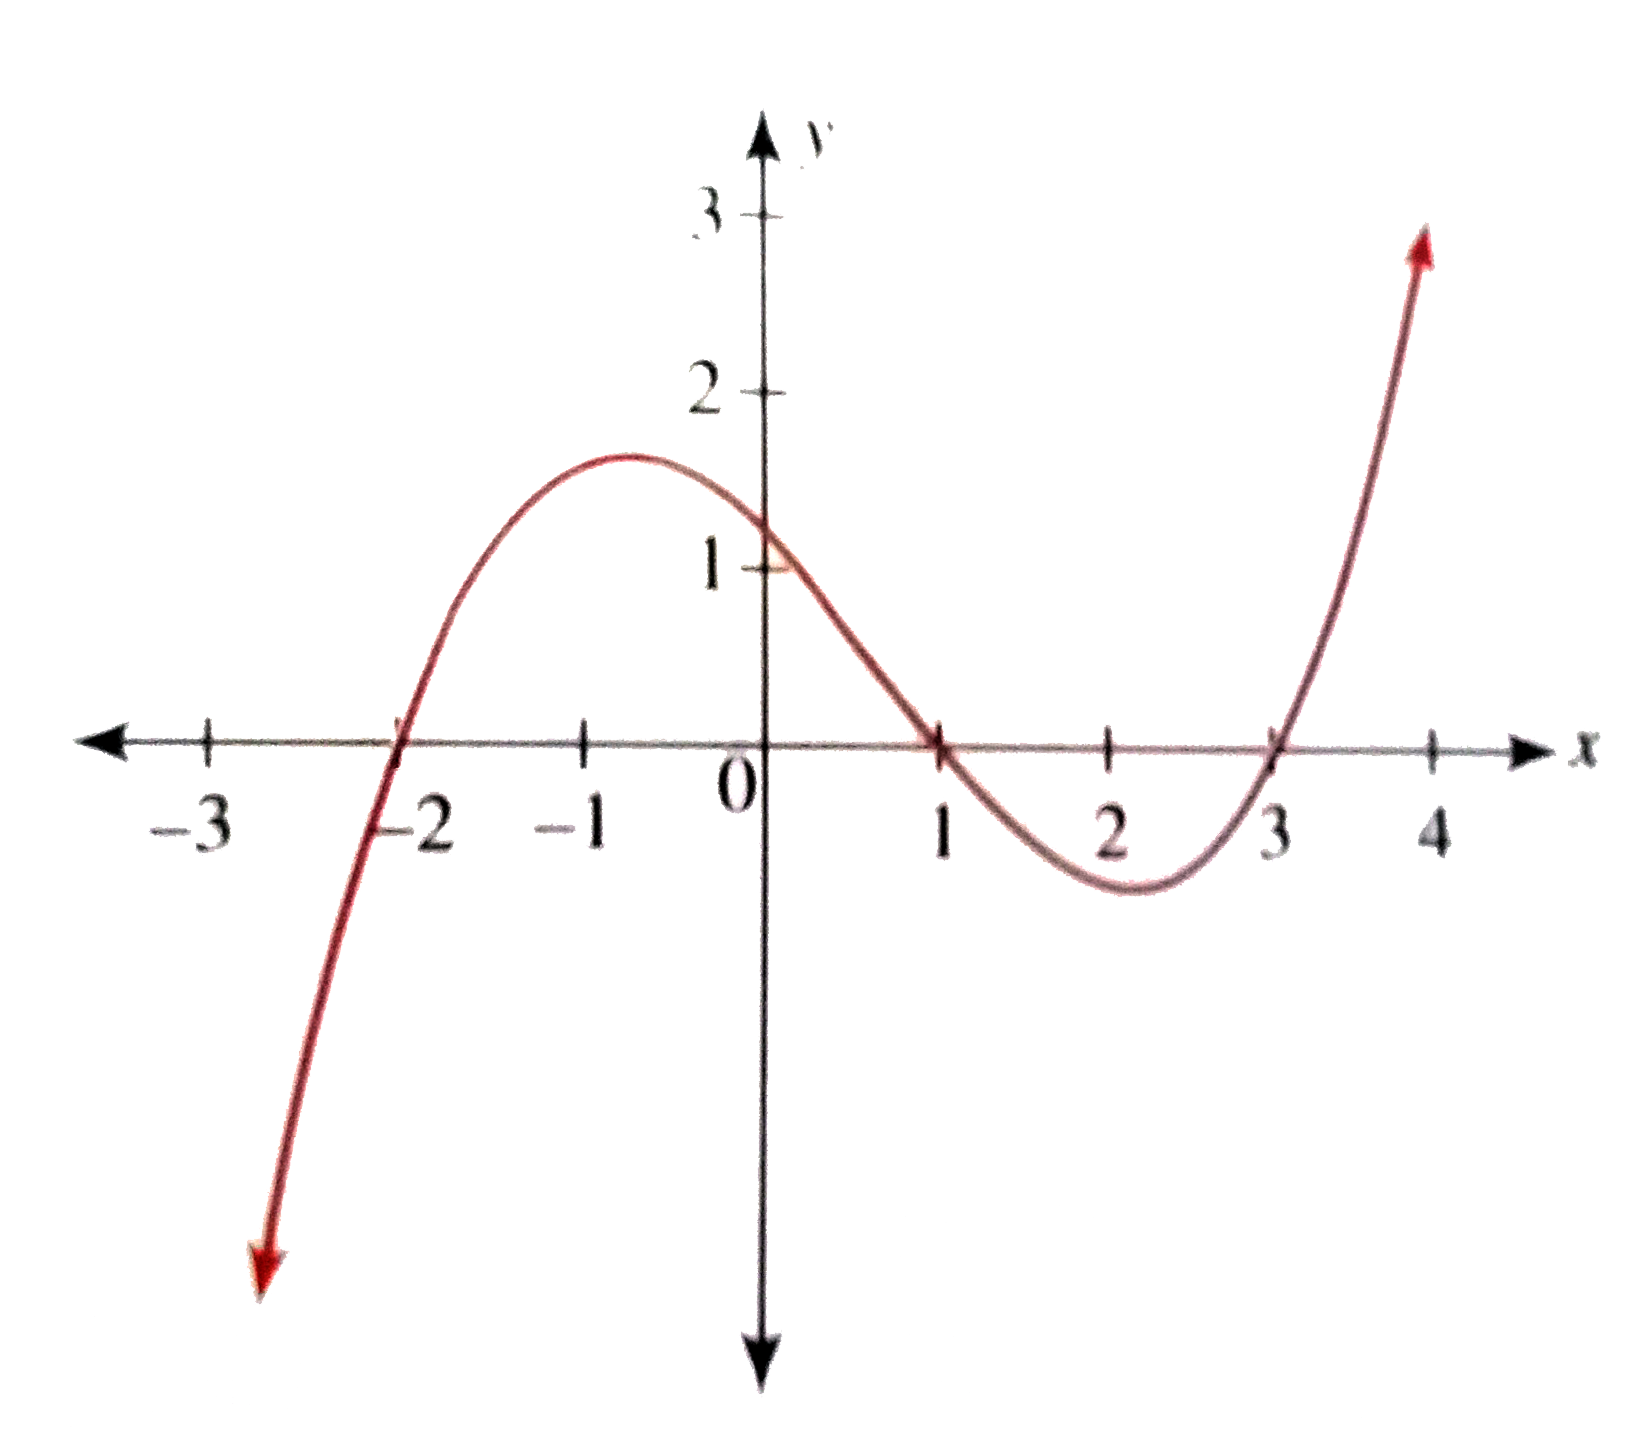
Then draw the graphs of
(i) |y|=sgn(f(x)) (ii) |y|=|f(x∣)|
(iii) y=xsgn(f(x))
View SolutionFind the range of the following
(i) f(x)=x2 (ii) f(x)=x
(iii) f(x)=x2+2 (iv) f(x)=x3
View SolutionThe graph of a polynomial y=f(x) , shown in Fig. 2.18. Find the number of real zeros of f(x) . (FIGURE)
View Solution


