British geneticist R.C. Punnett developed a graphical representation of gentic cross called "Punnett Square". Mention the possible result this representation predicts of the genetic cross carried.
Step-by-Step Solution:
1. Understanding the Punnett Square: The Punnett Square is a graphical tool used to predict the outcome of a genetic cross. It is structured like a checkerboard, where the alleles from one parent are listed along the top and the alleles from the other parent are listed along the side.
2. Types of Genetic Crosses: The Punnett Square can be used for various types of genetic crosses:
- Monohybrid Cross: Involves one trait (e.g., flower color).
- Dihybrid Cross: Involves two traits (e.g., flower color and plant height).
- Test Cross: Used to determine the genotype of an individual with a dominant phenotype by crossing it with a homozygous recessive individual.
- Reciprocal Cross: Involves switching the parental alleles to see if the results change.
3. Predicting Ratios: The Punnett Square allows us to predict:
- Genotypic Ratio: The ratio of different genetic combinations (e.g., homozygous dominant, heterozygous, homozygous recessive).
- Phenotypic Ratio: The ratio of observable traits (e.g., the proportion of plants with purple flowers vs. white flowers).
4. Example of a Monohybrid Cross: For a monohybrid cross between a homozygous dominant (AA) and a homozygous recessive (aa) plant:
- The Punnett Square would show all offspring as heterozygous (Aa), leading to a phenotypic ratio of 100% dominant phenotype.
5. Example of a Dihybrid Cross: For a dihybrid cross between two heterozygous parents (AaBb x AaBb):
- The Punnett Square would show a phenotypic ratio of 9:3:3:1 for the four possible phenotypes.
Summary of Results:
The Punnett Square predicts the possible genotypes and phenotypes of offspring from genetic crosses, providing both genotypic and phenotypic ratios.
---
- Monohybrid Cross: Involves one trait (e.g., flower color).
- Dihybrid Cross: Involves two traits (e.g., flower color and plant height).
- Test Cross: Used to determine the genotype of an individual with a dominant phenotype by crossing it with a homozygous recessive individual.
- Reciprocal Cross: Involves switching the parental alleles to see if the results change.
- Genotypic Ratio: The ratio of different genetic combinations (e.g., homozygous dominant, heterozygous, homozygous recessive).
- Phenotypic Ratio: The ratio of observable traits (e.g., the proportion of plants with purple flowers vs. white flowers).
- The Punnett Square would show all offspring as heterozygous (Aa), leading to a phenotypic ratio of 100% dominant phenotype.
- The Punnett Square would show a phenotypic ratio of 9:3:3:1 for the four possible phenotypes.
The Punnett Square predicts the possible genotypes and phenotypes of offspring from genetic crosses, providing both genotypic and phenotypic ratios.
Topper's Solved these Questions
- XII BOARDSBOOK - XII BOARD PREVIOUS YEAR PAPER ENGLISHCHAPTER - XII BOARDSEXERCISE - SECTION-B
81 Videos
- XII BOARDSBOOK - XII BOARD PREVIOUS YEAR PAPER ENGLISHCHAPTER - XII BOARDSEXERCISE - SECTION-C
86 Videos
- XII BOARDSBOOK - XII BOARD PREVIOUS YEAR PAPER ENGLISHCHAPTER - XII BOARDSEXERCISE - Delhi Board : Set III section -D
2 Videos
- SAMPLE PAPER 2019BOOK - XII BOARD PREVIOUS YEAR PAPER ENGLISHCHAPTER - SAMPLE PAPER 2019EXERCISE - Section E Part B
3 Videos
Similar Questions
Assertion :- Punnett sequare is a graphical representation to calculate the probability of all possible genotypes of offsprings in a genetic cross.
Reason :- It was developed by a British geneticist, Raginald C. Punnett.
View SolutionA cross was carried out between two pea plants showing the contrasting traits of height of the plant. The result of the cross showed 50% of parenal characters.
i) Work out the cross with the help of a Punnett square.
ii) Name the type of the cross carried out.
View Solution
Knowledge Check
The graphical representation to calculate the probability of all possible genotypes of offspring in a genetic cross is called a) Pedigree analysis b) Karyotype c) Punnett square d) Chromosome map
APedigree analysisBKaryotypeCPunnett squareDChromosome mapRead the passages and answer the questions that follow
Co-dominance
Mendel's early work with pea plants provided the foundational knowledge for genetics, but Mendel's simple example of two alleles, one dominant and one recessive, for a given gene is a rarity. In fact, dominance and recessiveness are not actually allelic properties. Rather, they are effects that can only be measured in relation to the effects of other alleles at the same locus. Furthermore, dominance may change according to the level of organization of the phenotype. Variations of dominance highlight the complexity of understanding genetic influences on phenotypes. Co-dominance is a type of non-Mendelian inheritance pattern that finds the traits expressed by the alleles to be equal in the phenotype. There is neither a complete dominance nor incomplete dominance of one trait over the other for that given characteristic. In camellia flowers, petal colour is controlled by codominance. When a red flower is crossed with a white flower, all of the offspring are covered in both red and white petals.
Punnett square showing a test cross between a white-furred bull (WW) and a red-furred cow (RR). All their offspring are heterozygotes:AGenotype RWBGenotype WWCGenotype RRDCannot be determined
Select the option with correct set of statements for Punnett square. (a) Developed by a British geneticist. (b) Used to calculate the probability of genotypes of offsprings. (c) Useful for monohybrid crosses only. (d) It is a mathematical formula which helps to calculate the types of gametes.
View SolutionSelect the option with correct set of statements for Punnett square. (1) Developed by British geneticist. (2)Used to calculate the probability of genotypes offsprings. (3)Useful for monohybrid crosses only. (4) It is a mathematical formula which helps to calculate the types of gametes.
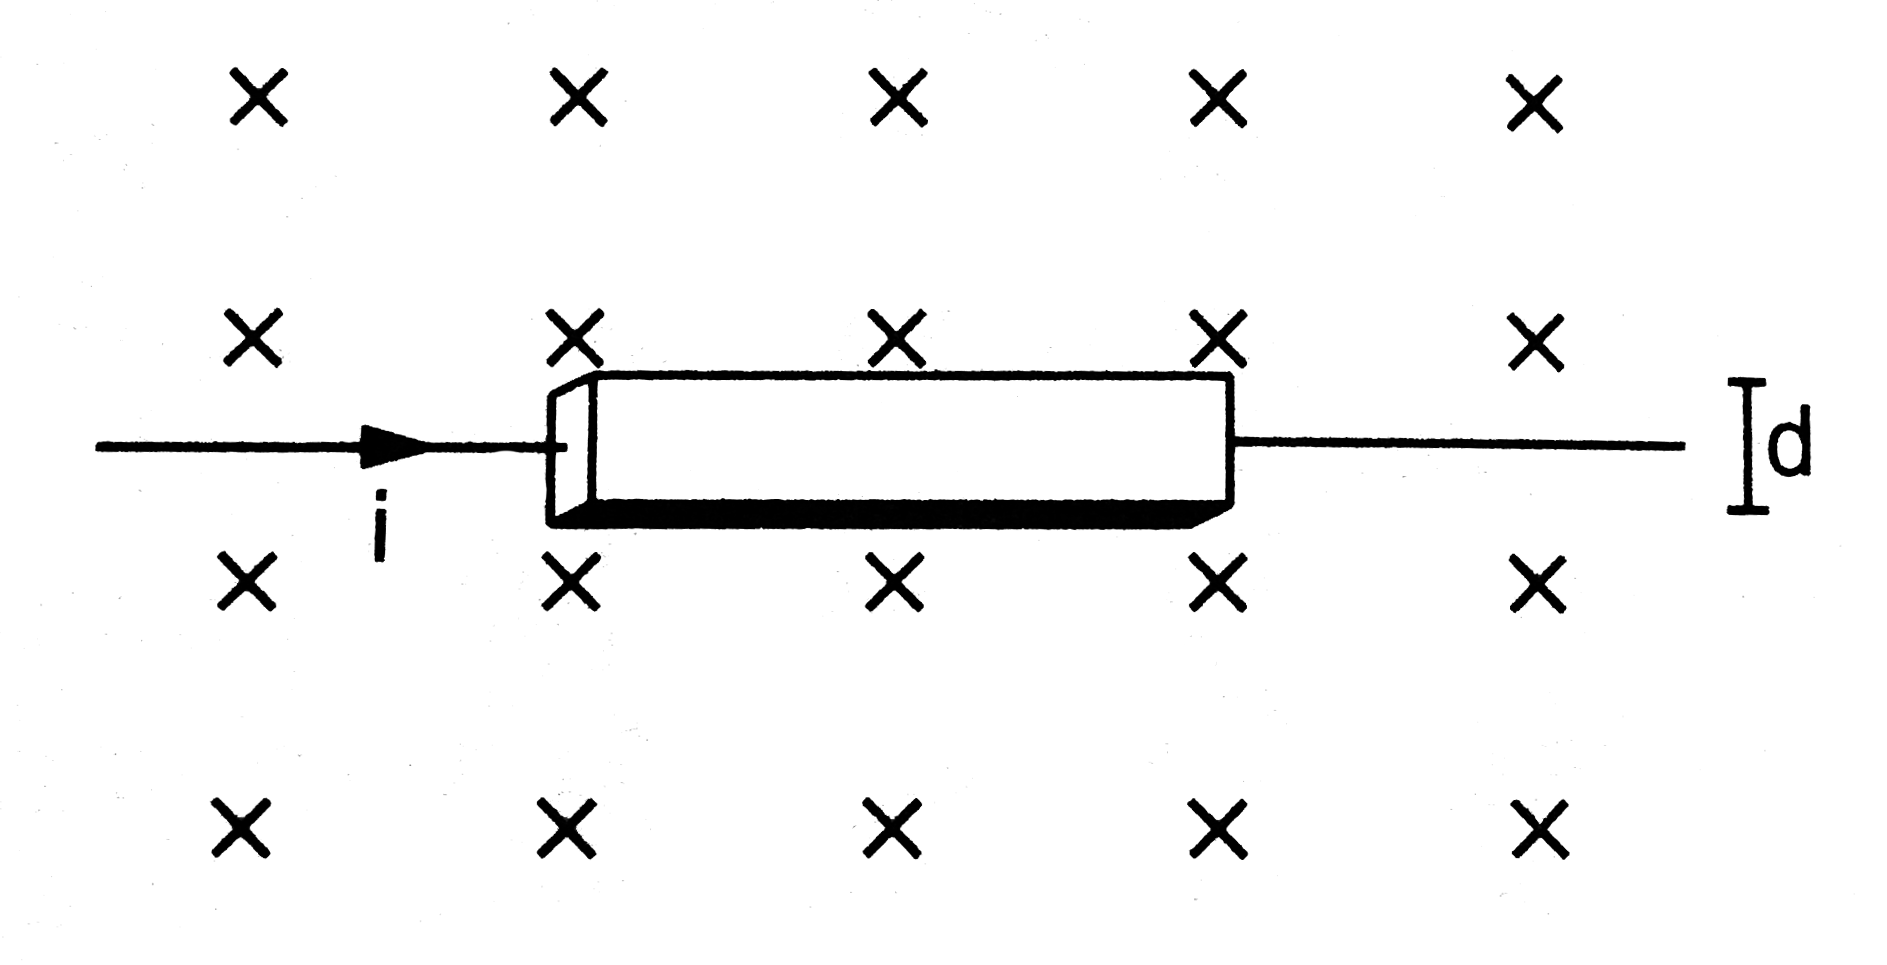
View SolutionA currrent I is passed through a silver strip of width d and area of cross section A. The number of free electrons per unit volume is n. (a) Find the drift velocity v of the electrons. (b) If a magnetic field B exists in the region as shown in what is the average magnetic force on the free electrons? (c) Due to the magnetic force, the free electrons get accumulated on one side of the conductor along its length. This produces a transverse electric field in the conductor which opposes the magnetic force on the electrons. Find the magnitude of the electric field which will be the potential diference developed across the width of the conductor due to the electron- accumulation? The appearance of a transverse emf, when a current-carrying wire is placed in a magnetic field, is called hall effect.

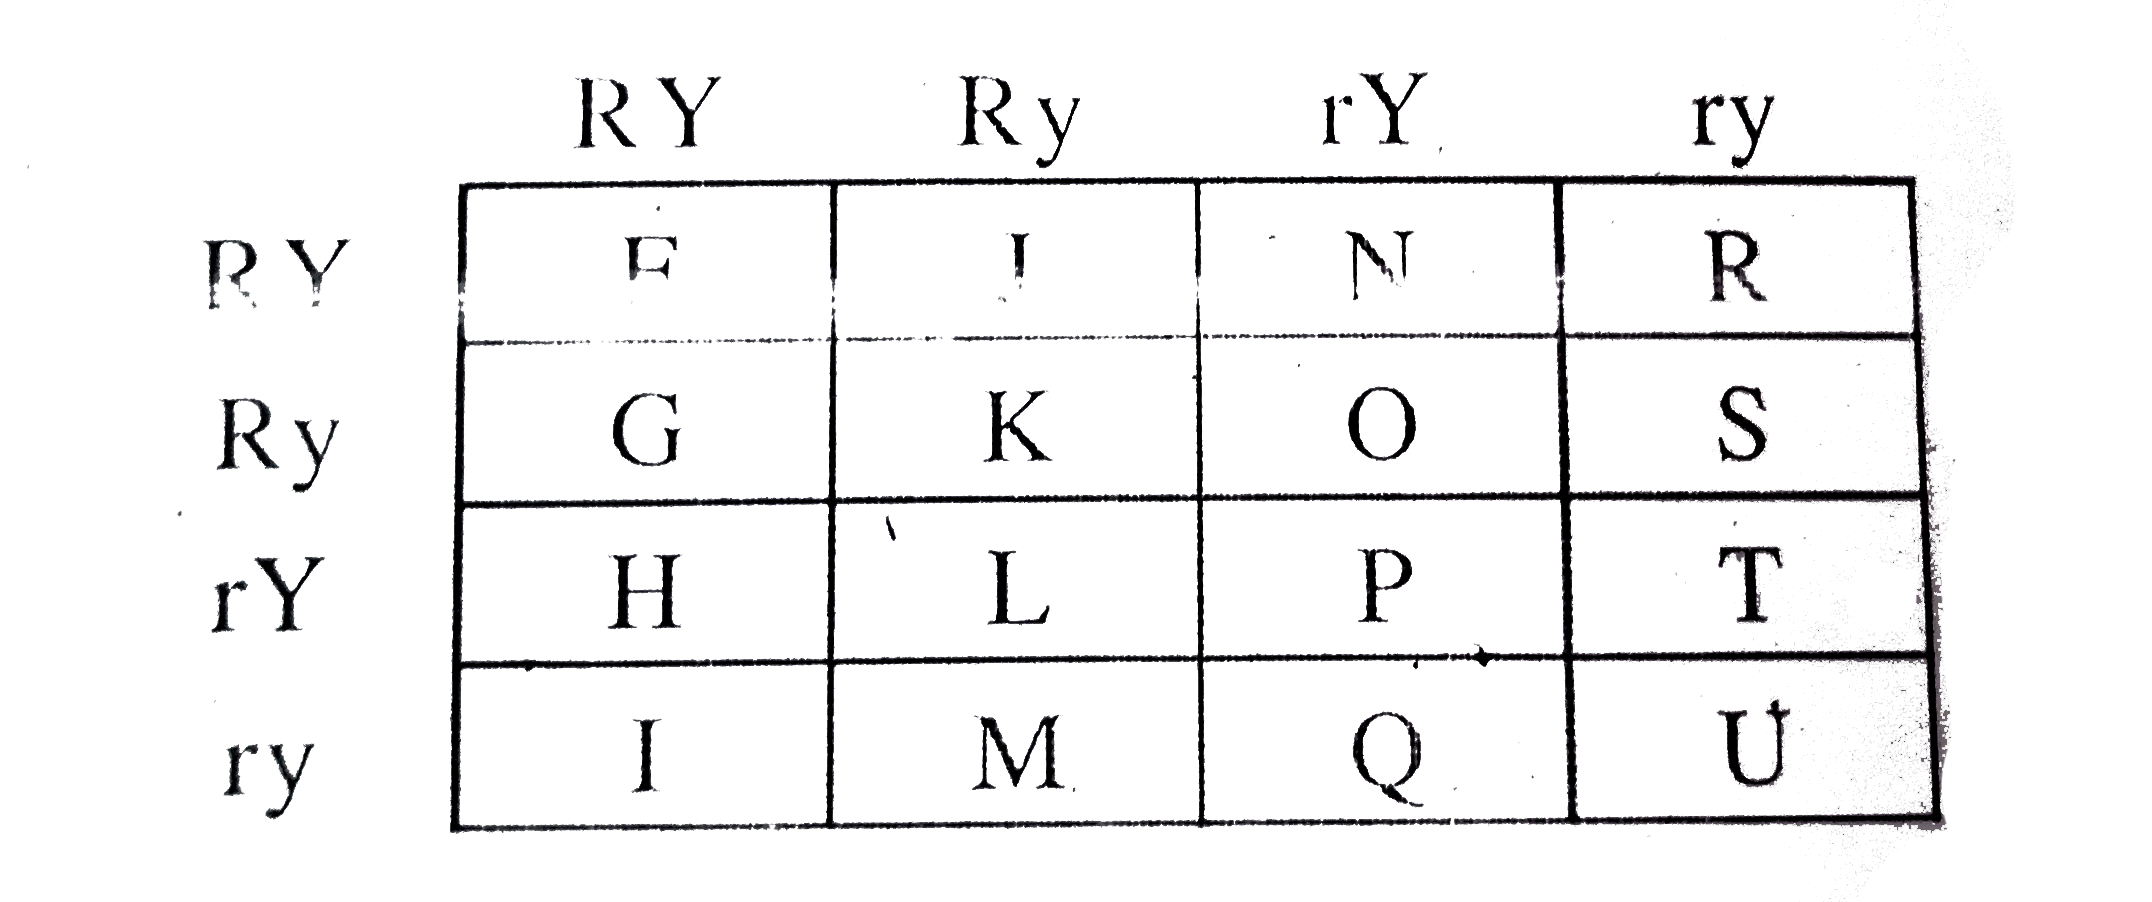
View SolutionThe punnett square shown below represents the pattern of inheritance in dihybrid cross, when round (R) is dominant over wrinkled (r) seeds and yellow (Y) is dominant over green (y) seeds :

Find out the odd one :
View SolutionConsider a uniform wire of length l. Cross-sectional area A, Young's modulus of the material of the wave is Y. Some information related to the wire is given in column-1 and dependence of the result is given in column-2. Then match the approprite choice between the columns and match the list given in options
Column-I Column-II(A) Let us suspend wire vertically from a (p) Young'sModulusrigud support and attach a mass m atits lower end. If the mass is slightly pulleddown and released, it executes S.H.Mof a time period which will depend on(B) Work done in stretching the wire up to length (q) elongation (x)l+xwill depend on(C) If the given is fixed between two rigid (r) length (l)supports and its temperature is decreasedthermal stress that develops in the wirewill depend on(D) If the wire is pulled at its ends equal and (s) area of cross-section (A) opposite forces of magnitude F so that itundergoes an elongation x, according toHook's law, F=kx, where k is the forceconstant.Force constant (k) of the wirewill depend on
View SolutionUsing punnett square show the F2 results of a dihybrid cross where the pure breed parents have contrasting traits with reference to seed shape and seed colour in Pisum Sativum. Give the phenotypic ratio.
View Solution
