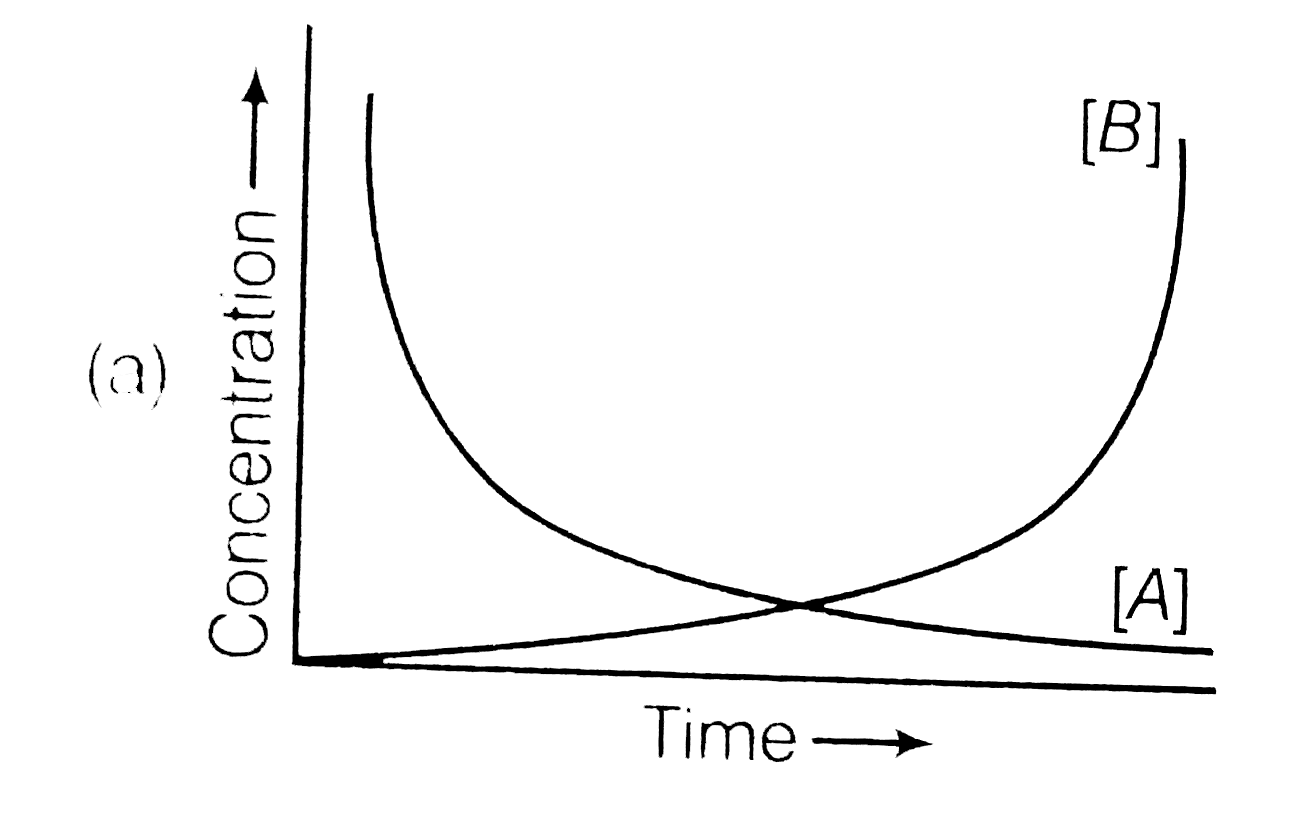
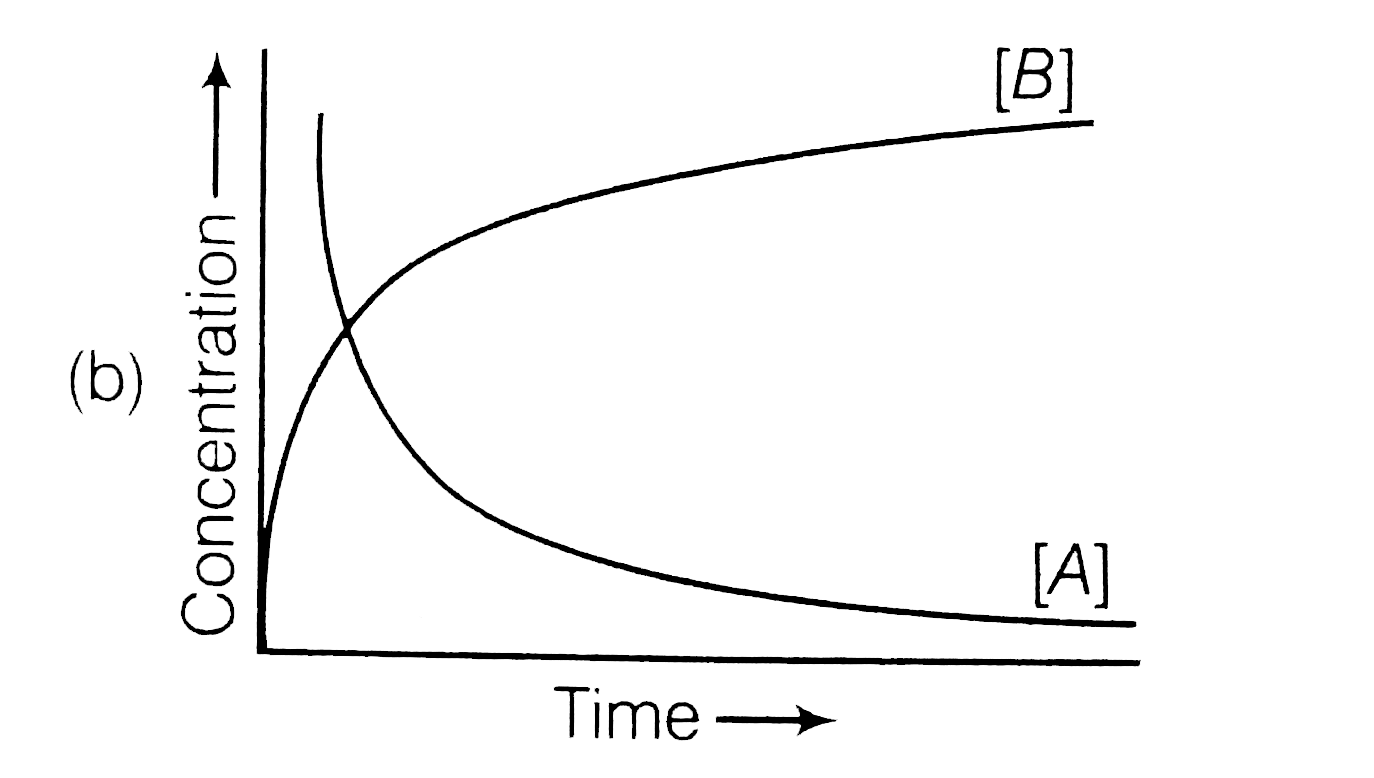
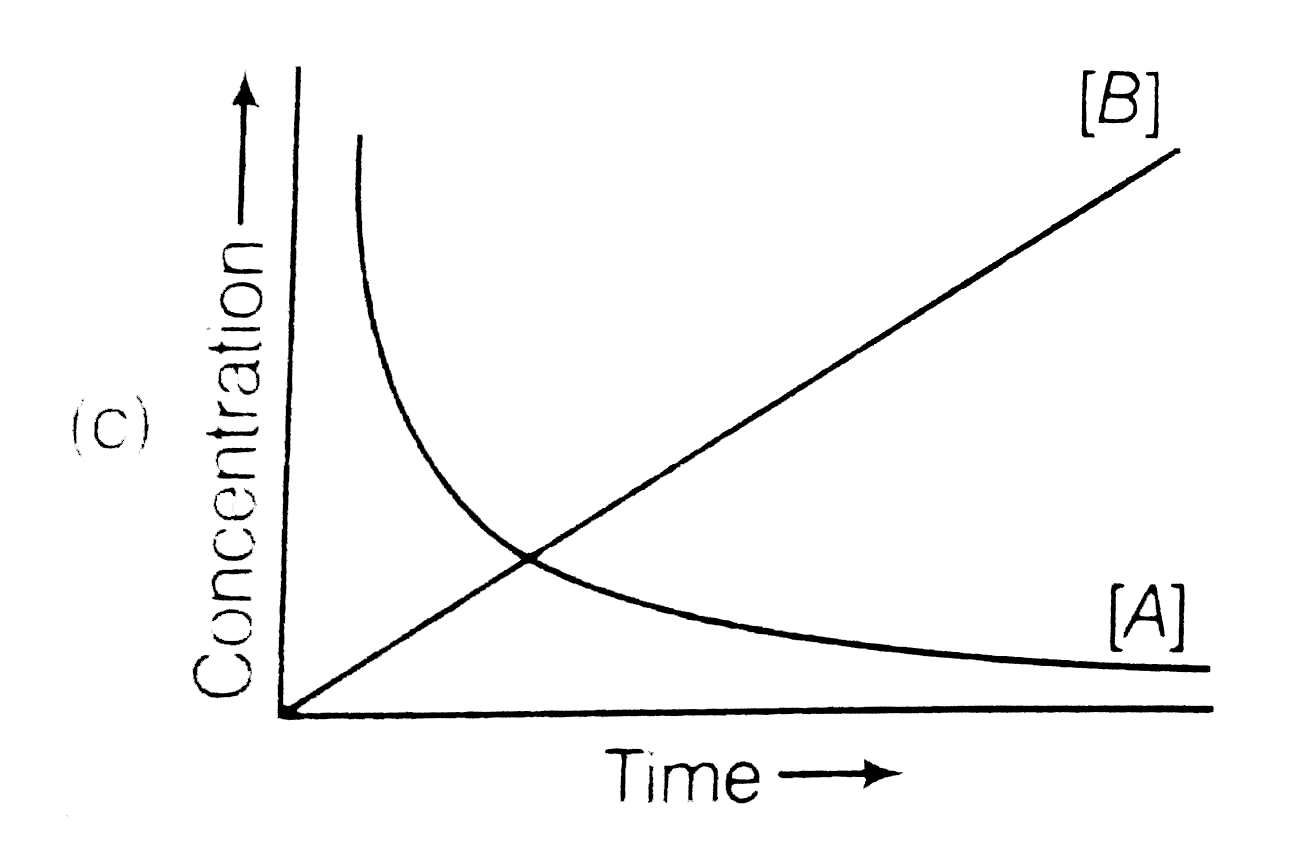
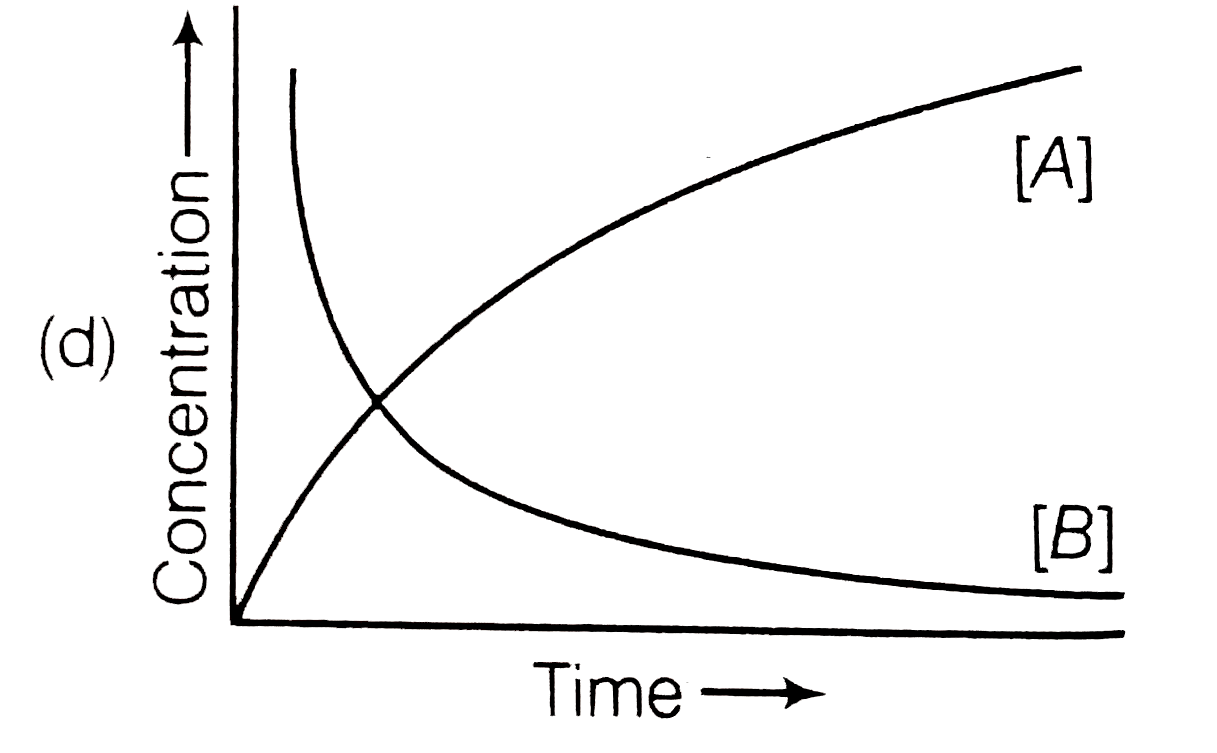
Consider the reaction . The concentration of both the reactants and the products varies exponentially with time. Which of the following figure correctly describes the change in concentration of reactants and products with time ?
The correct Answer is:B
To solve the problem regarding the reaction A→B and the exponential variation of concentrations with time, we can follow these steps:
Step 1: Understand the Reaction
The reaction involves a reactant A that transforms into a product B. As the reaction proceeds, the concentration of A will decrease while the concentration of B will increase.
Step 2: Analyze Concentration Changes
Since it is stated that both concentrations vary exponentially with time, we can express this mathematically:
- The concentration of A decreases exponentially with time, which can be represented as:
(A)=(A0)e−kt
where (A0) is the initial concentration of A, k is the rate constant, and t is time.
- The concentration of B increases exponentially with time, which can be represented as:
(B)=(B0)(1−e−kt)
where (B0) is the final concentration of B that can be achieved as t approaches infinity.
Step 3: Sketch the Graphs
1. Graph for A: The graph of (A) versus time will show an exponential decay. It starts at (A0) and approaches zero as time increases.
2. Graph for B: The graph of (B) versus time will show an exponential increase. It starts at zero and approaches (B0) as time increases.
Step 4: Compare with Given Options
Now, we need to compare the sketches of (A) and (B) with the provided options to identify which one correctly represents the exponential changes in concentration.
- Option A: Shows (A) decreasing exponentially but (B) increasing incorrectly.
- Option B: Correctly shows (A) decreasing exponentially and (B) increasing exponentially.
- Option C: Shows (A) decreasing correctly but (B) increasing incorrectly.
- Option D: Incorrectly shows both concentrations.
Conclusion
The correct figure that describes the change in concentration of reactants and products with time is Option B, where the concentration of A decreases exponentially and the concentration of B increases exponentially.
---
The reaction involves a reactant A that transforms into a product B. As the reaction proceeds, the concentration of A will decrease while the concentration of B will increase.
Since it is stated that both concentrations vary exponentially with time, we can express this mathematically:
- The concentration of A decreases exponentially with time, which can be represented as:
(A)=(A0)e−kt
where (A0) is the initial concentration of A, k is the rate constant, and t is time.
(B)=(B0)(1−e−kt)
where (B0) is the final concentration of B that can be achieved as t approaches infinity.
1. Graph for A: The graph of (A) versus time will show an exponential decay. It starts at (A0) and approaches zero as time increases.
2. Graph for B: The graph of (B) versus time will show an exponential increase. It starts at zero and approaches (B0) as time increases.
Now, we need to compare the sketches of (A) and (B) with the provided options to identify which one correctly represents the exponential changes in concentration.
- Option B: Correctly shows (A) decreasing exponentially and (B) increasing exponentially.
- Option C: Shows (A) decreasing correctly but (B) increasing incorrectly.
- Option D: Incorrectly shows both concentrations.
The correct figure that describes the change in concentration of reactants and products with time is Option B, where the concentration of A decreases exponentially and the concentration of B increases exponentially.
Topper's Solved these Questions
- CHEMICAL KINETICSBook:NCERT EXEMPLAR ENGLISHChapter:CHEMICAL KINETICSExercise:MULTIPLE CHOICE QUESTIONS
Explore 12 Videos
- CHEMICAL KINETICSBook:NCERT EXEMPLAR ENGLISHChapter:CHEMICAL KINETICSExercise:SHORT ANSWER TYPE QUESTION
Explore 20 Videos
- BIOMOLECULES Book:NCERT EXEMPLAR ENGLISHChapter:BIOMOLECULES Exercise:Long Answer Type Questions
Explore 5 Videos
- CHEMISTRY IN EVERYDAY LIFEBook:NCERT EXEMPLAR ENGLISHChapter:CHEMISTRY IN EVERYDAY LIFEExercise:Long Answer Type Qns
Explore 4 Videos
Similar Questions
Knowledge Check
Consider the reaction A→B. The concentration of both the reactants and the products varies exponentially with time. Which of the following figure correctly describes the change in concentration of reactants and products with time ?
A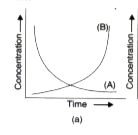 B
B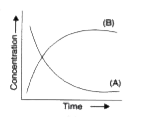 C
C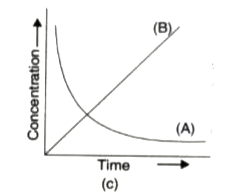 D
D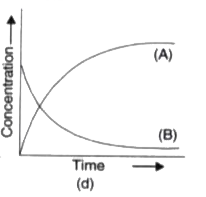
Consider the reaction A→B. The concentration of both the reactants and the products varies exponentially with time. Which of the following figure correctly describes the change in concentration of reactants and products with time ?
A B
B C
C D
D
Consider the reaction A→B. The concentration of both the reactants and the products varies exponentially with time. Which of the following figure correctly describes the change in concentration of reactants and products with time ?
A B
B C
C D
D
An increse in the concentration of the reactants of a reaction leads to change in:
View SolutionAssertion (A) : For a first order, the concentration of a reaction decreases exponentially with time.
Reason (R ): The rate of reaction at any time depends upon the concentration of the reactant at that time.
View SolutionIf concentration of reactant is increased by 2 times then K
becomes :-
View SolutionThe configurations of the reactant and the product in the following reaction, respectively, are
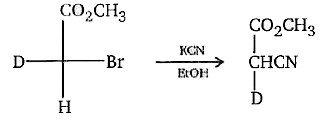
View SolutionAssertion : Order of a reaction with respect to any reactant can be zero, positive negative of fractional.
Reason : Rate of a reaction cannot decrease with increase in concentration of a reactant or a product.
View Solution