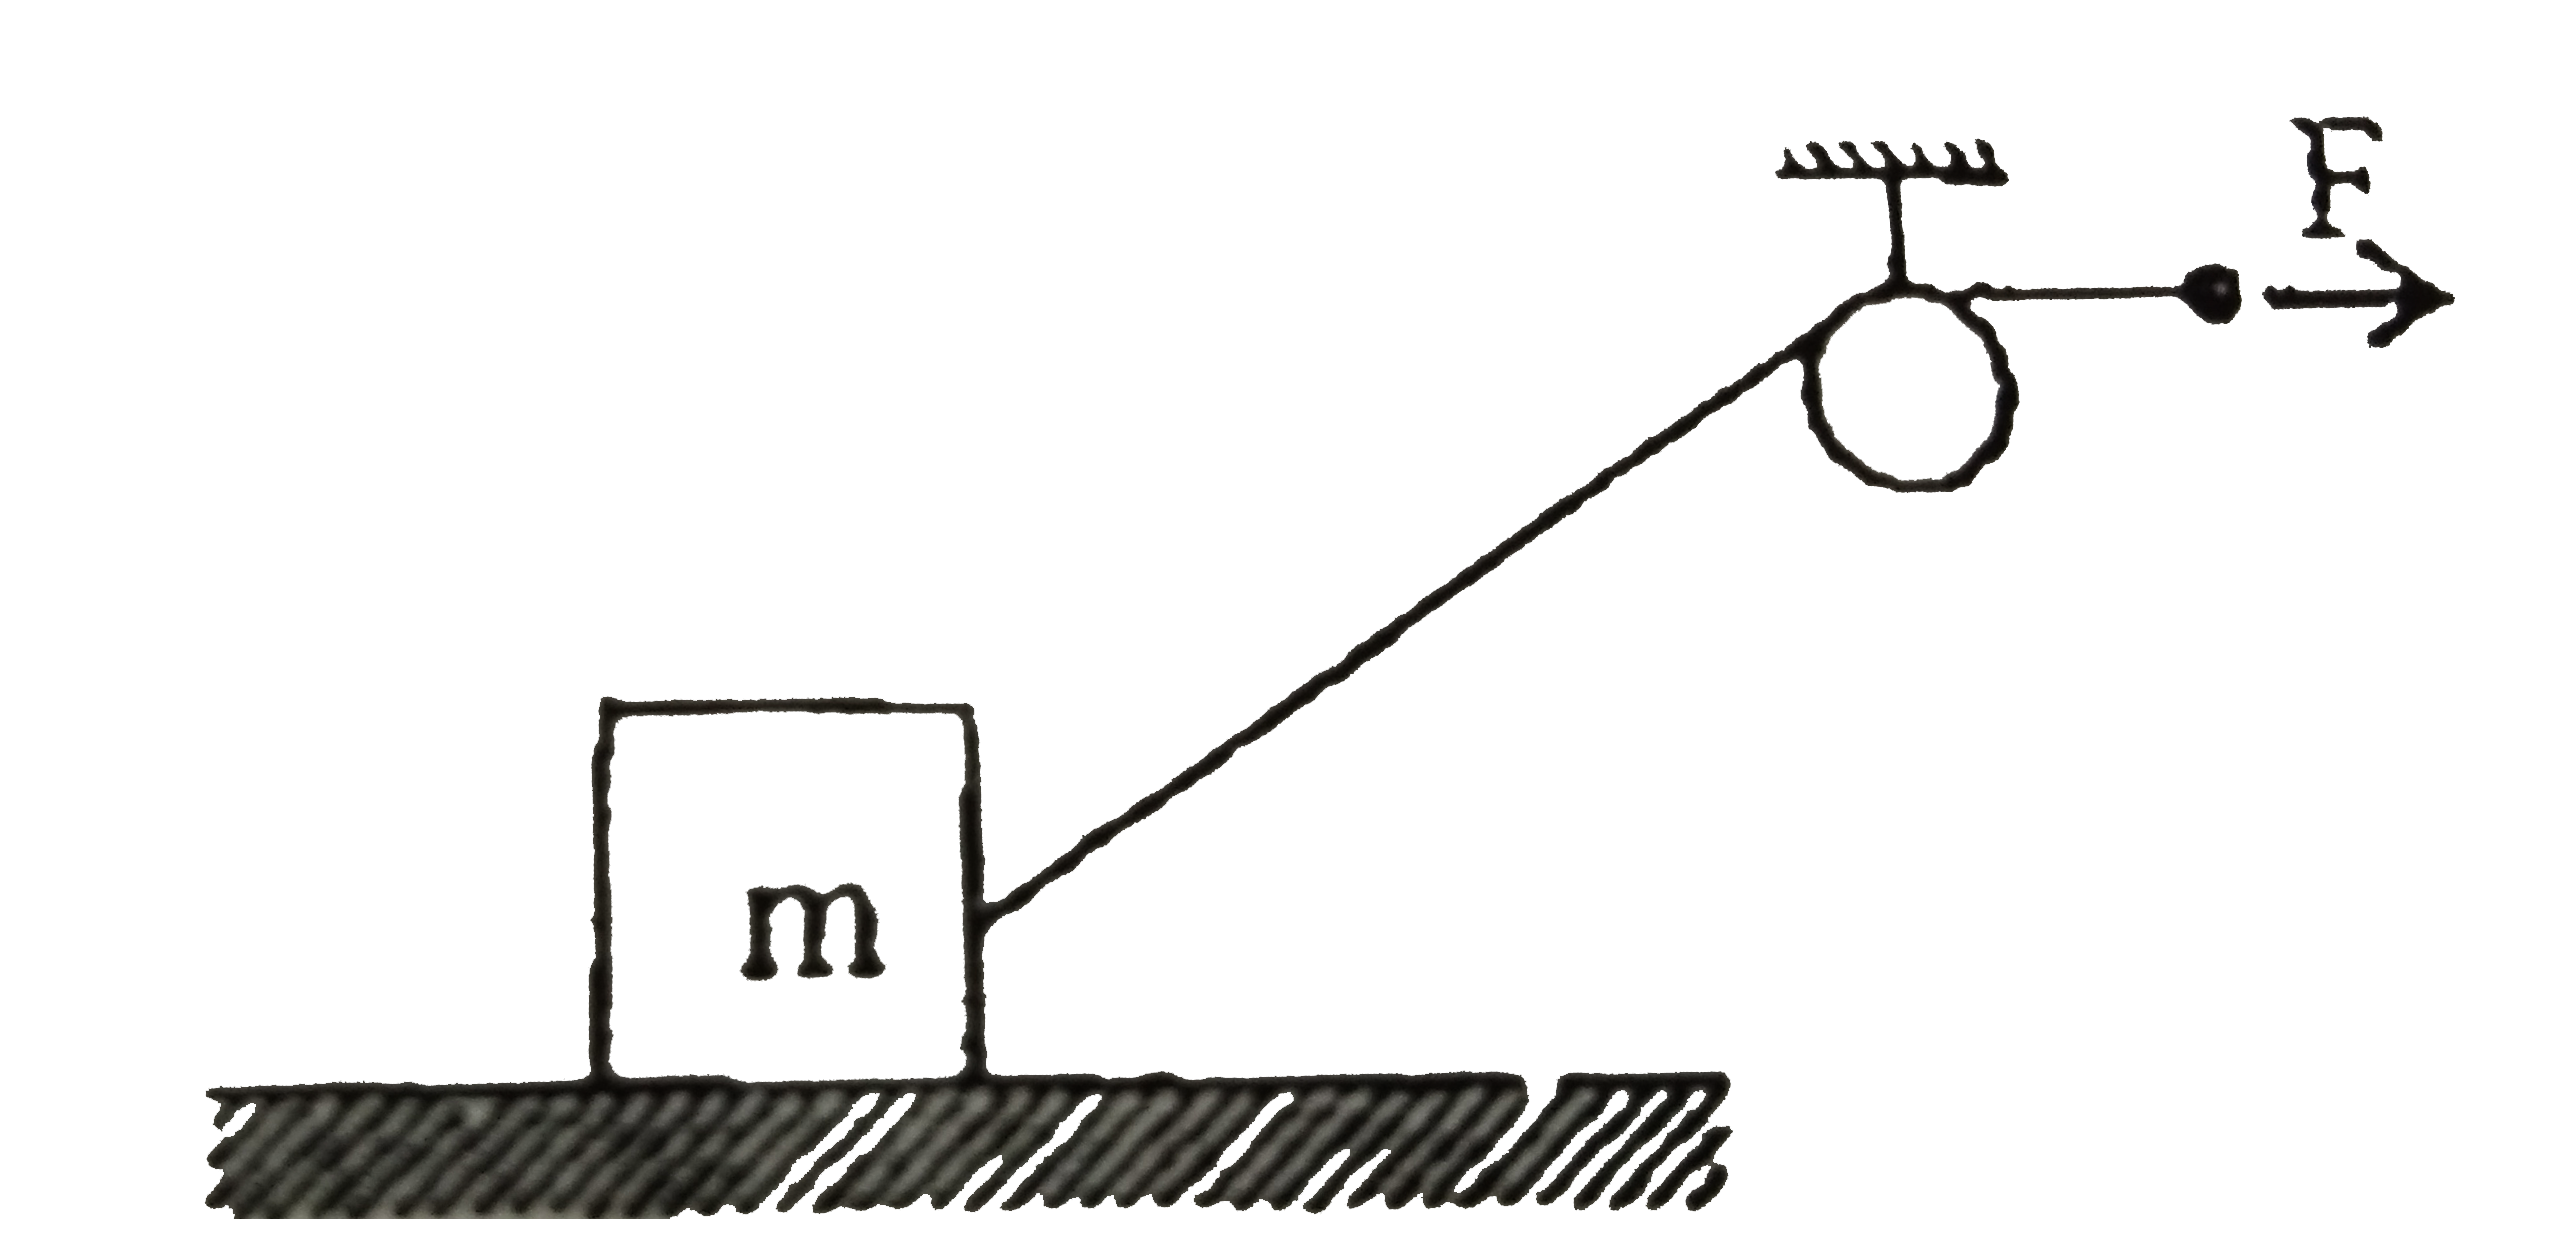
A block placed on a rough horizontal surface is pulled by a horizontal force F Let f be the force applied by the rough surface on the block . Plot a graph of f versus F .
To solve the problem of plotting a graph of the frictional force f versus the applied force F on a block placed on a rough horizontal surface, we can follow these steps:
Step 1: Understand the Forces Involved
- The block is subjected to a horizontal pulling force F and a frictional force f acting in the opposite direction.
- The frictional force f can be static or kinetic depending on whether the block is at rest or in motion.
Step 2: Analyze the Static Friction
- When the applied force F is zero, the frictional force f is also zero.
- As the applied force F increases from zero, the static friction f also increases to counteract it, until it reaches its maximum value, known as the limiting friction.
Step 3: Determine the Limiting Friction
- The maximum static friction fmax can be expressed as:
fmax=μsN
where μs is the coefficient of static friction and N is the normal force (equal to the weight of the block if on a horizontal surface).
Step 4: Identify the Transition Point
- The block will start to move when the applied force F exceeds the maximum static friction fmax.
- At this point, the frictional force will no longer increase and will instead drop to a lower value known as kinetic friction fk.
Step 5: Analyze Kinetic Friction
- Once the block starts moving, the frictional force f becomes constant and is equal to the kinetic friction, which is generally less than the maximum static friction:
fk=μkN
where μk is the coefficient of kinetic friction.
Step 6: Plot the Graph
- The graph of f versus F can be plotted as follows:
1. Start from the origin (0,0).
2. As F increases, f increases linearly until it reaches fmax.
3. At the point where F=fmax, the block starts to move.
4. After this point, f becomes constant at fk as F continues to increase.
Step 7: Label the Graph
- Label the x-axis as F (Applied Force) and the y-axis as f (Frictional Force).
- Indicate the maximum static friction point and the constant kinetic friction level on the graph.
Final Graph Description
- The graph starts at the origin, rises linearly to a maximum point (limiting friction), and then levels off to a constant value (kinetic friction) as F increases further.
- The block is subjected to a horizontal pulling force F and a frictional force f acting in the opposite direction.
- The frictional force f can be static or kinetic depending on whether the block is at rest or in motion.
- When the applied force F is zero, the frictional force f is also zero.
- As the applied force F increases from zero, the static friction f also increases to counteract it, until it reaches its maximum value, known as the limiting friction.
- The maximum static friction fmax can be expressed as:
fmax=μsN
where μs is the coefficient of static friction and N is the normal force (equal to the weight of the block if on a horizontal surface).
- The block will start to move when the applied force F exceeds the maximum static friction fmax.
- At this point, the frictional force will no longer increase and will instead drop to a lower value known as kinetic friction fk.
- Once the block starts moving, the frictional force f becomes constant and is equal to the kinetic friction, which is generally less than the maximum static friction:
fk=μkN
where μk is the coefficient of kinetic friction.
- The graph of f versus F can be plotted as follows:
1. Start from the origin (0,0).
2. As F increases, f increases linearly until it reaches fmax.
3. At the point where F=fmax, the block starts to move.
4. After this point, f becomes constant at fk as F continues to increase.
- Label the x-axis as F (Applied Force) and the y-axis as f (Frictional Force).
- Indicate the maximum static friction point and the constant kinetic friction level on the graph.
- The graph starts at the origin, rises linearly to a maximum point (limiting friction), and then levels off to a constant value (kinetic friction) as F increases further.
Topper's Solved these Questions
- LAWS OF MOTIONBook:NCERT EXEMPLAR ENGLISHChapter:LAWS OF MOTIONExercise:Short answer type questions
Explore 6 Videos
- LAWS OF MOTIONBook:NCERT EXEMPLAR ENGLISHChapter:LAWS OF MOTIONExercise:Long answer Type Questions
Explore 9 Videos
- LAWS OF MOTIONBook:NCERT EXEMPLAR ENGLISHChapter:LAWS OF MOTIONExercise:Mutiple Choice Questions (More than One Options)
Explore 6 Videos
- KINETIC THEORYBook:NCERT EXEMPLAR ENGLISHChapter:KINETIC THEORYExercise:Multiple Choice Questions (MCQs)
Explore 31 Videos
- MECHANICAL PROPERTIES OF FLUIDSBook:NCERT EXEMPLAR ENGLISHChapter:MECHANICAL PROPERTIES OF FLUIDSExercise:Long Answer Type Questions
Explore 3 Videos
Similar Questions
A block is placed on a rough floor and a horizontal force F is applied on it. The force of friction f by the floor on the block is measured for different values of F and a graph is plotted between them.
View SolutionA block is placed on a rough horizontal plane. A time dependent horizontal force F=K t acts on the block K is a postive constant. Accelration-time graph of the block is
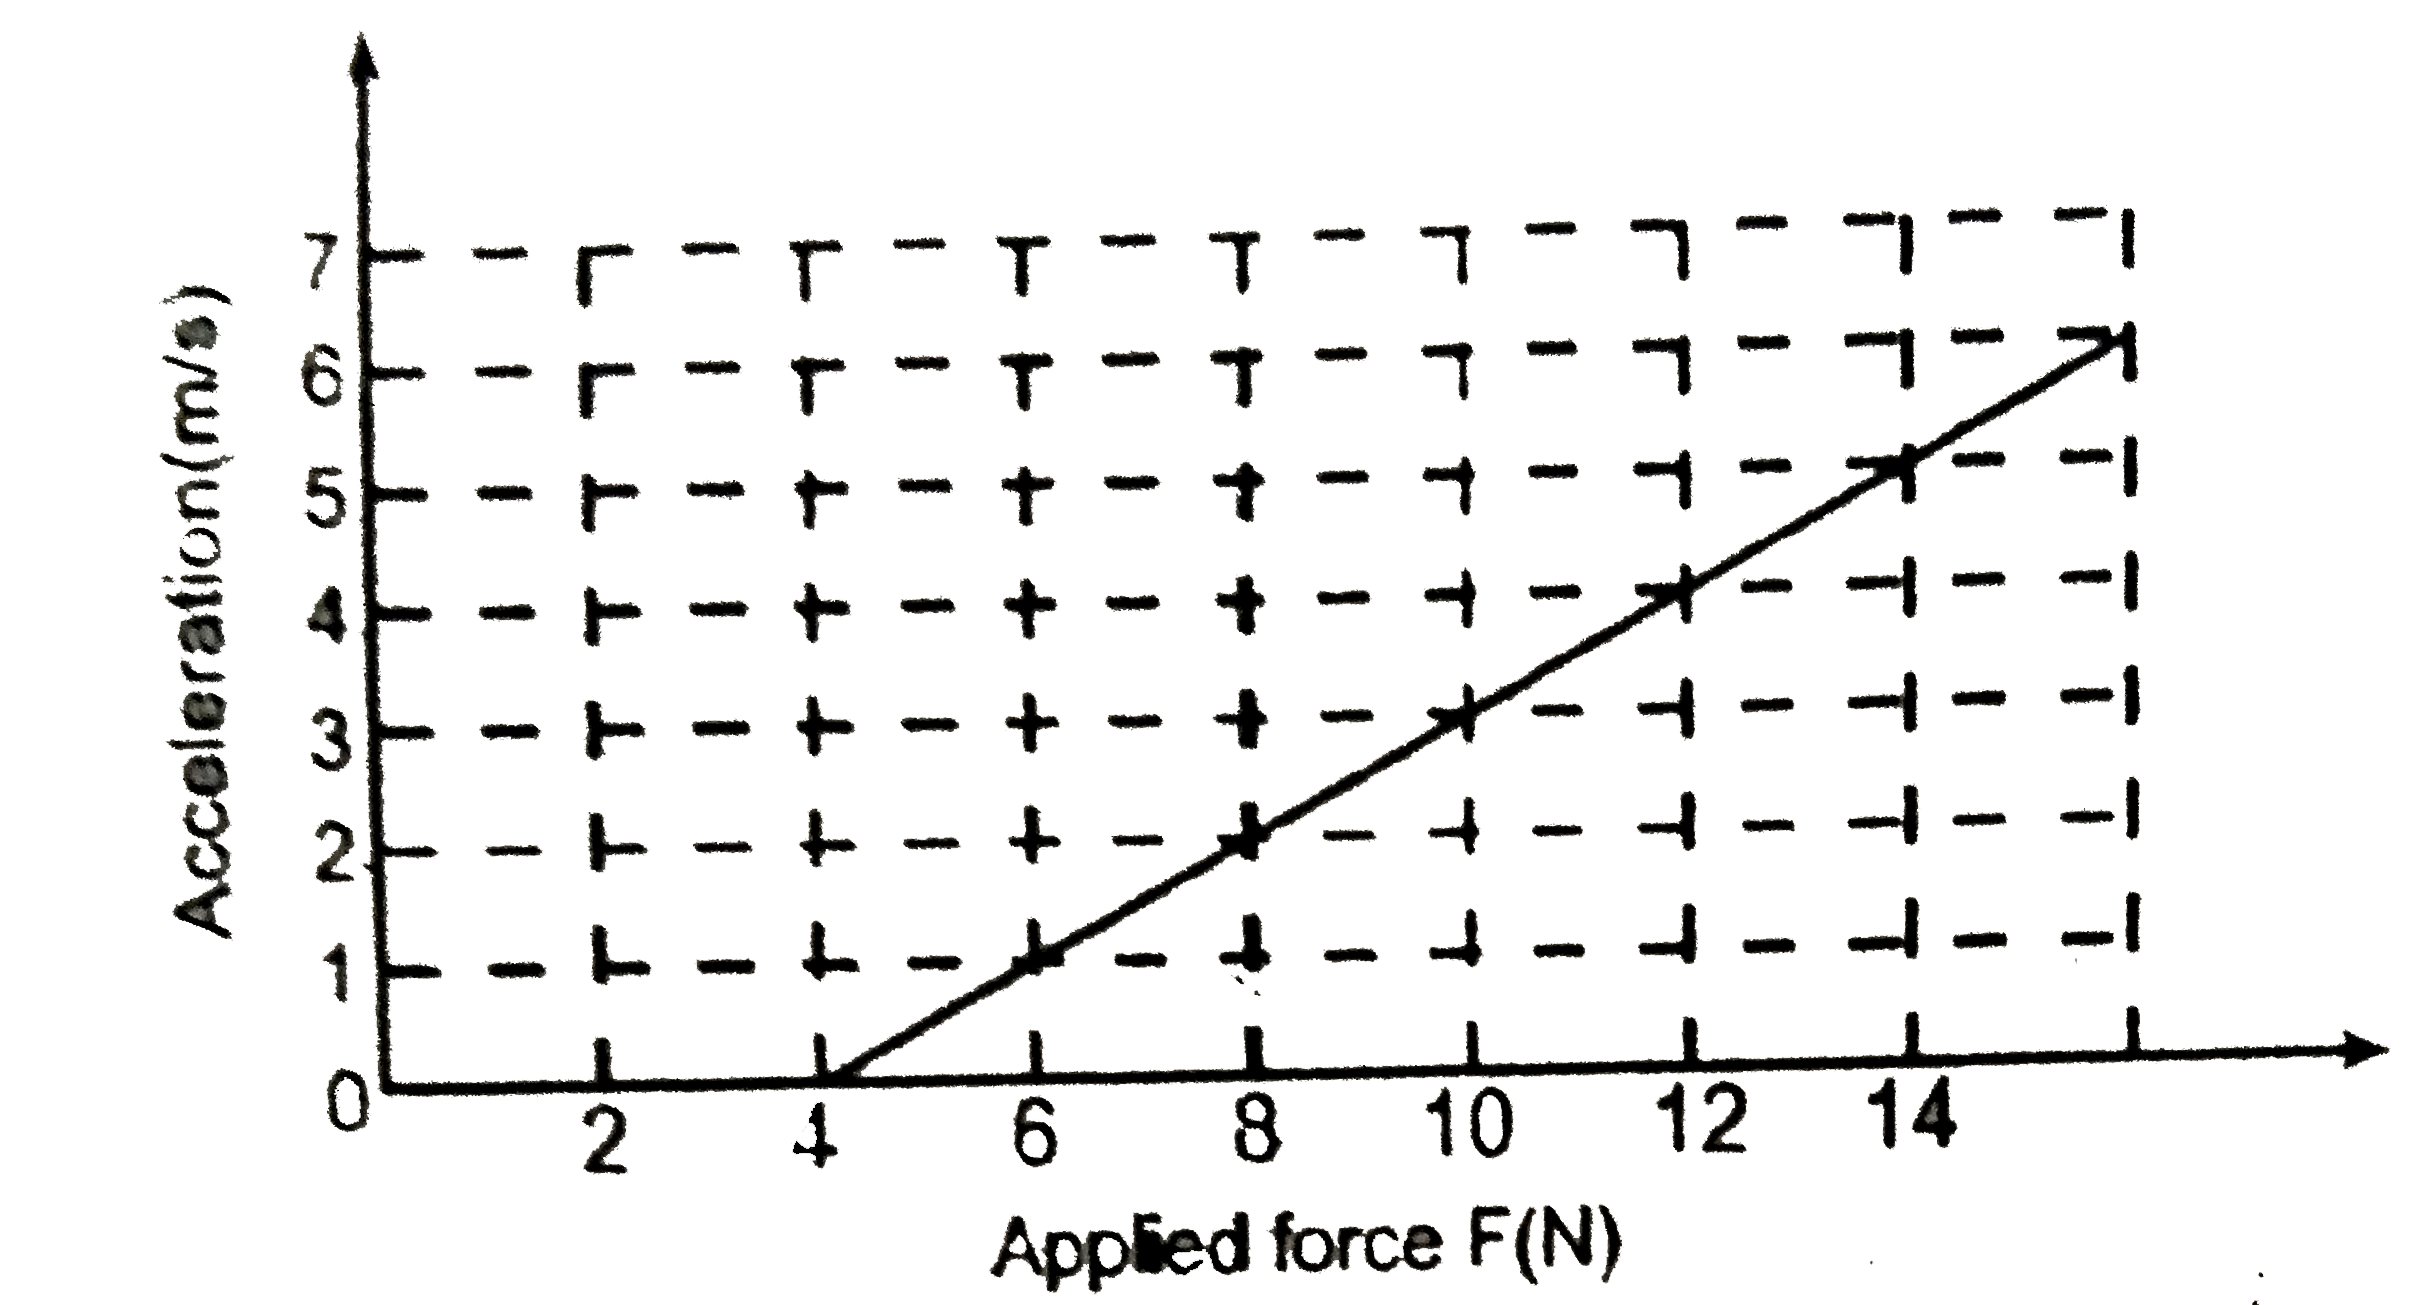
View SolutionA block of unknown mass is at rest on a rough, horizontal surface. A horizontal force F is applied to the block. The graph in the figure shows the acceleration of the block with respect to the applied force. The mass of the block is
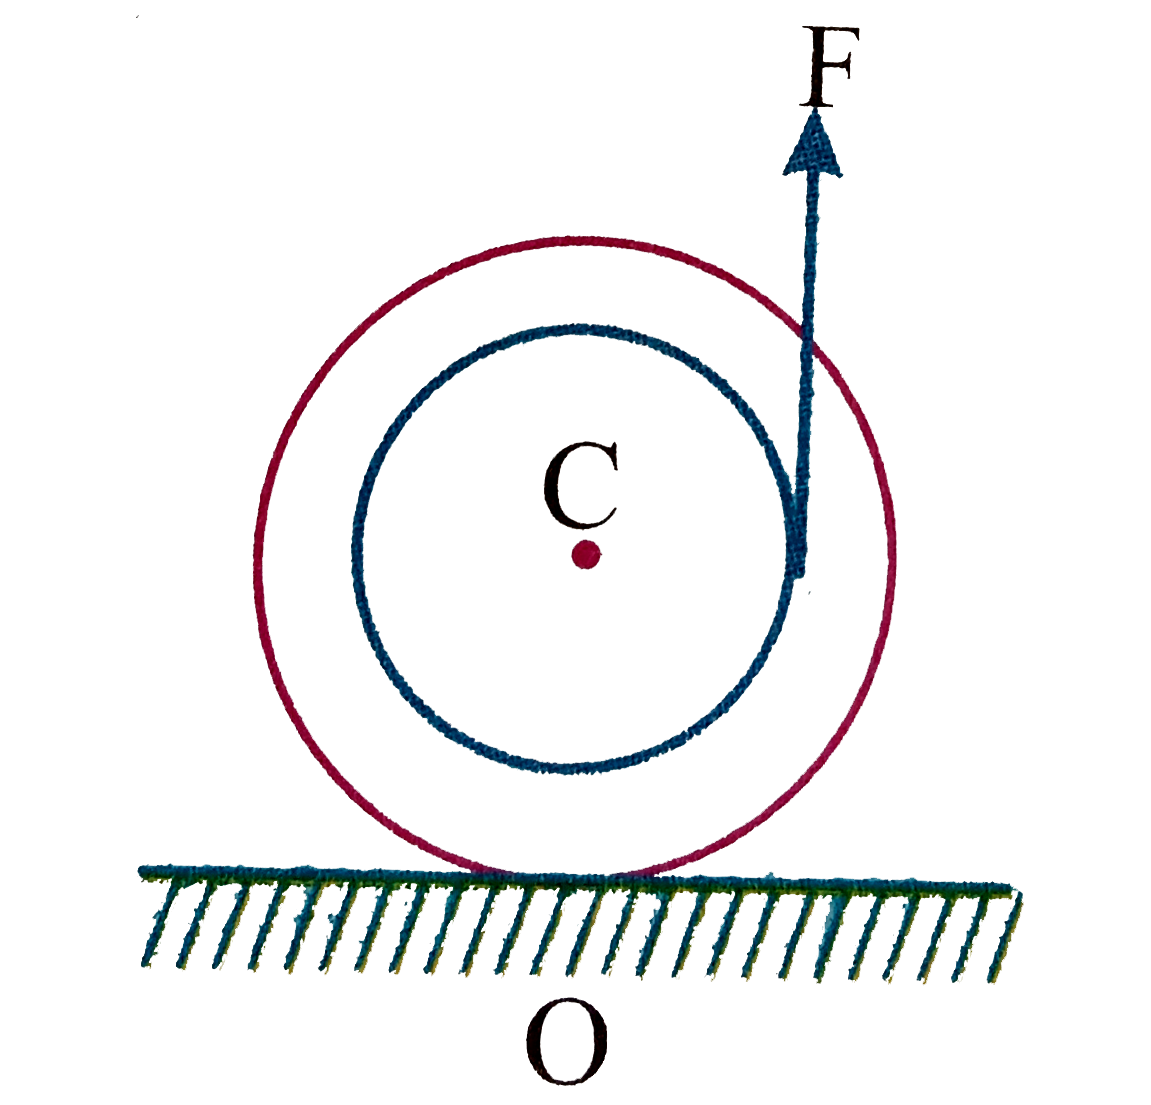
View SolutionA yo-yo is placed on a rough horizontal surface and a constant force F, which is less than its weight, pulls it vertically. Due to this
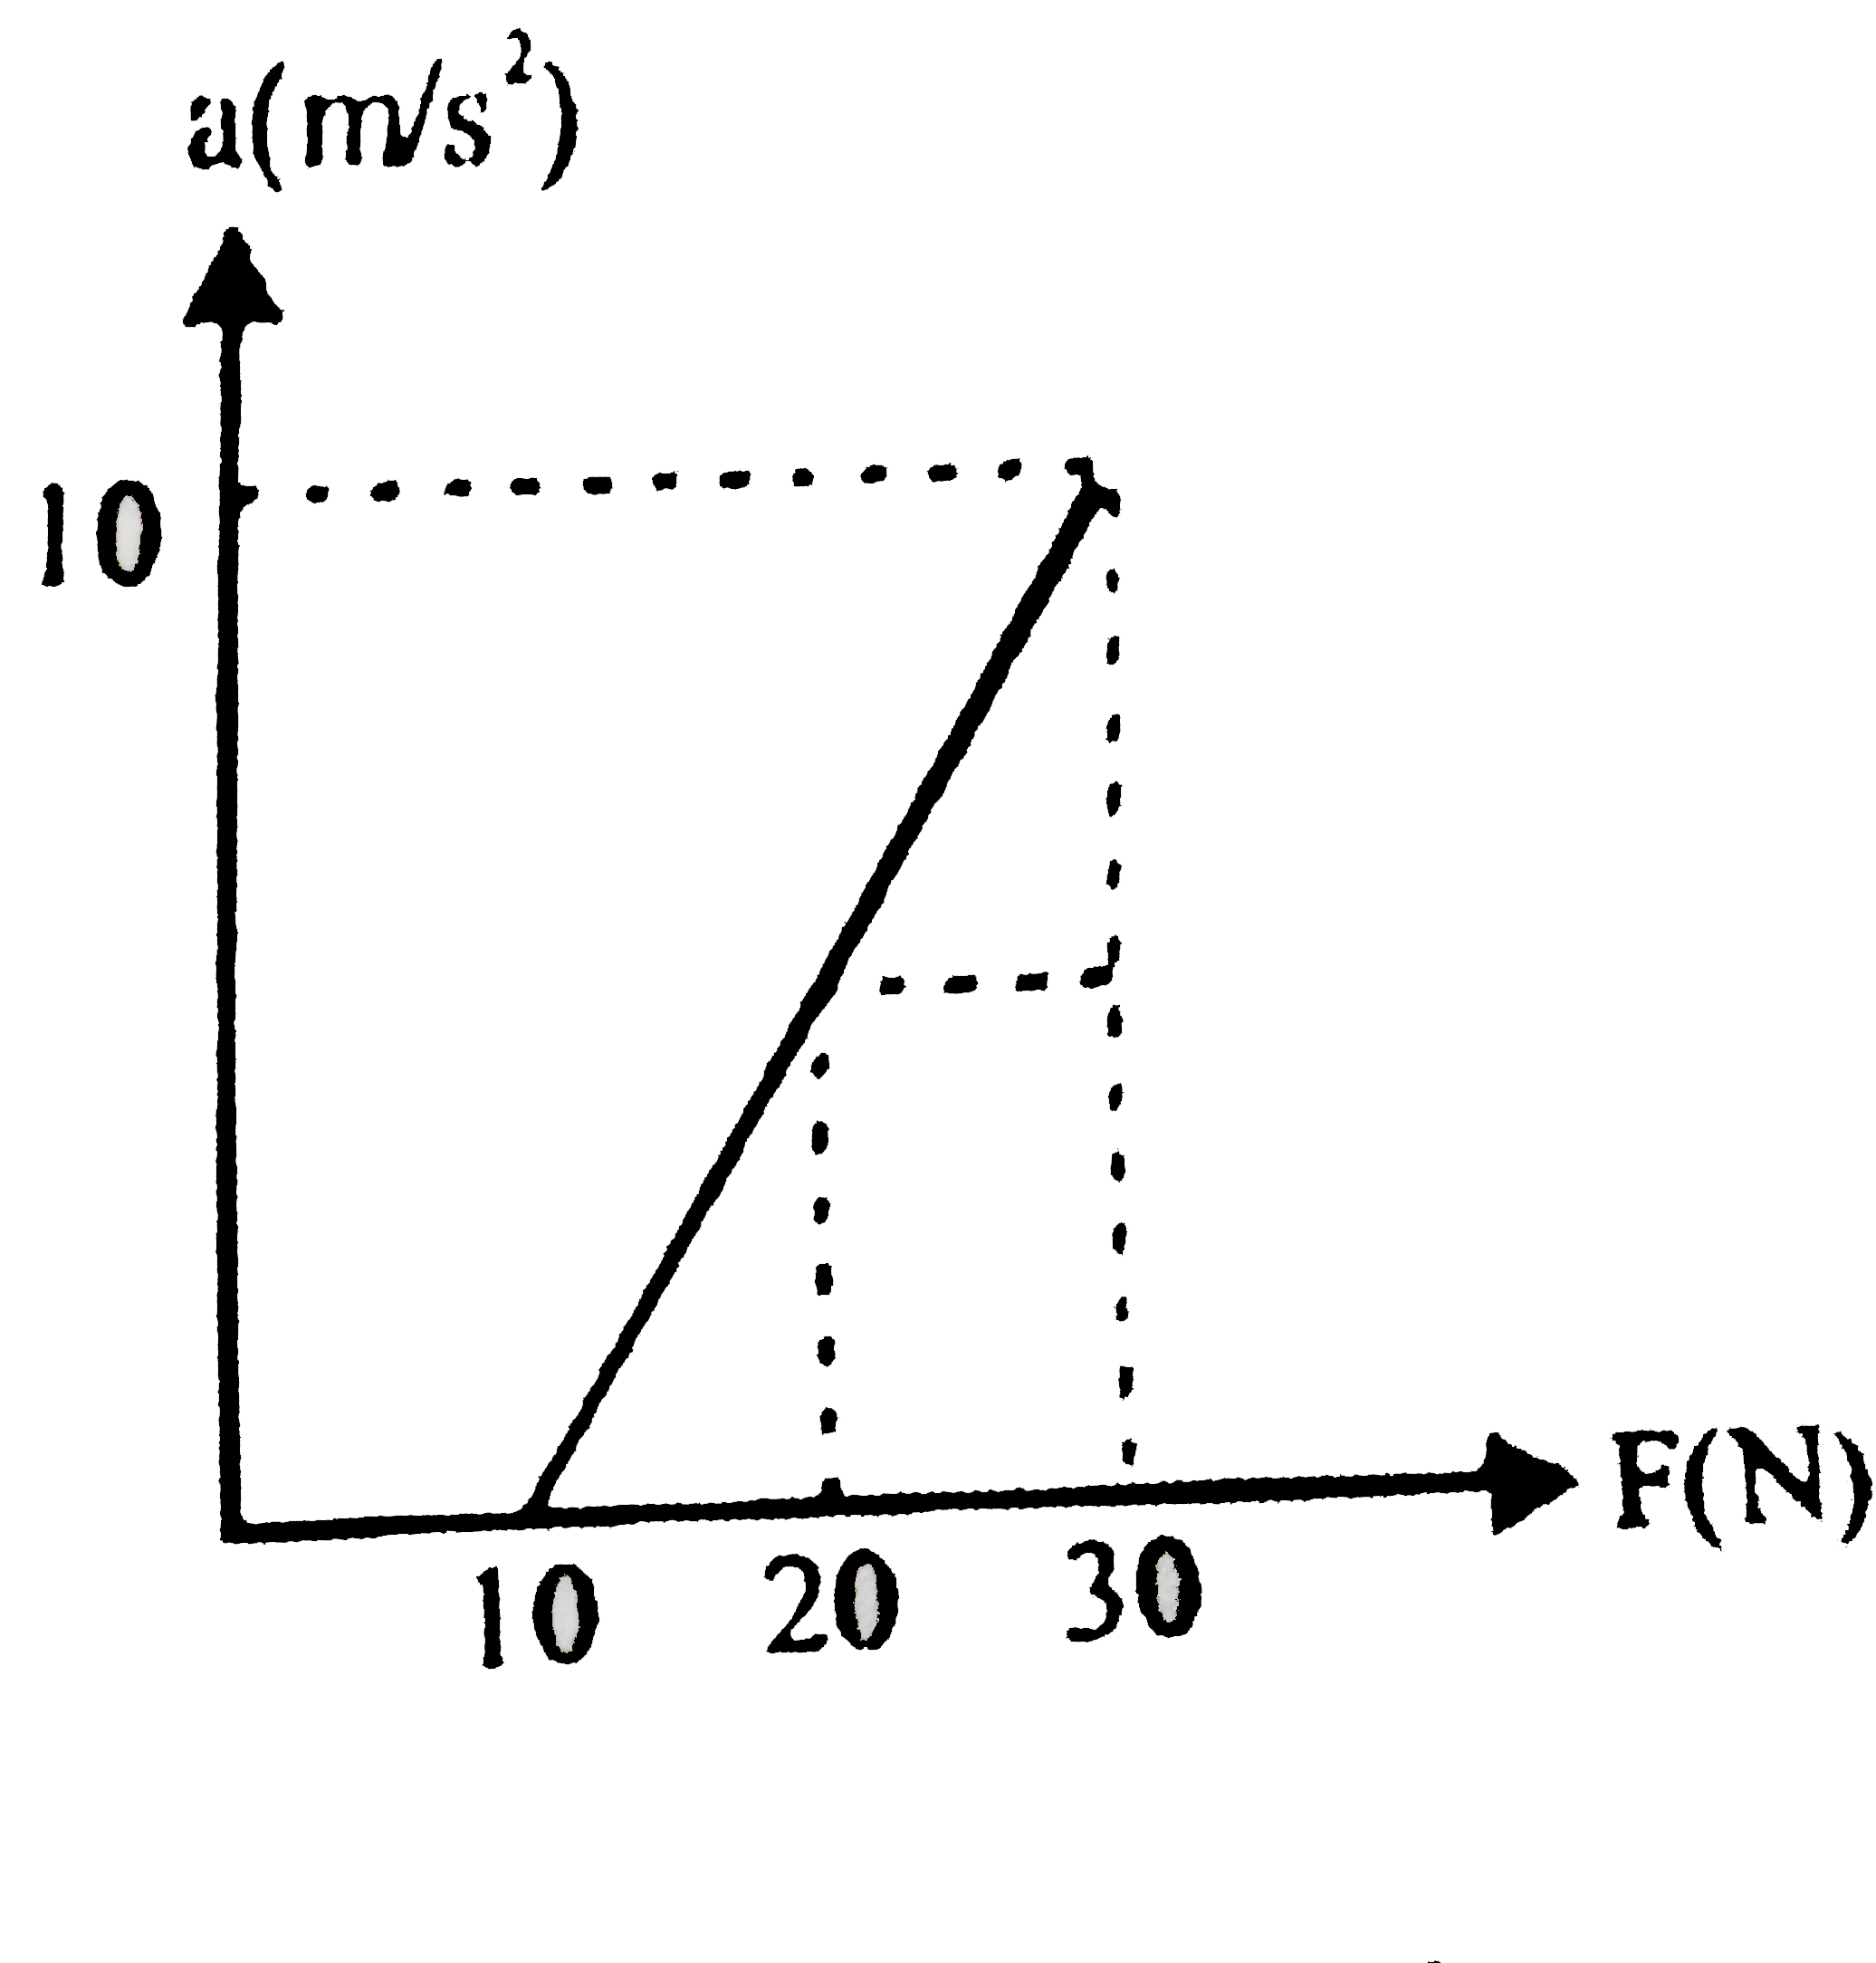
View SolutionA block placed on a rough horizontal surface is pushed with a force F acting horizontally on the block. The magnitude of F is increased and acceleration produced is plotted in the graph shown.
View SolutionA block is pulled a distance x along a rough horizontal table by a horizontal string. If the tension in the string is T, the weight of the block is W, the reaction is N and frictonal force is F. Write down expressions for the work done by each of these forces.
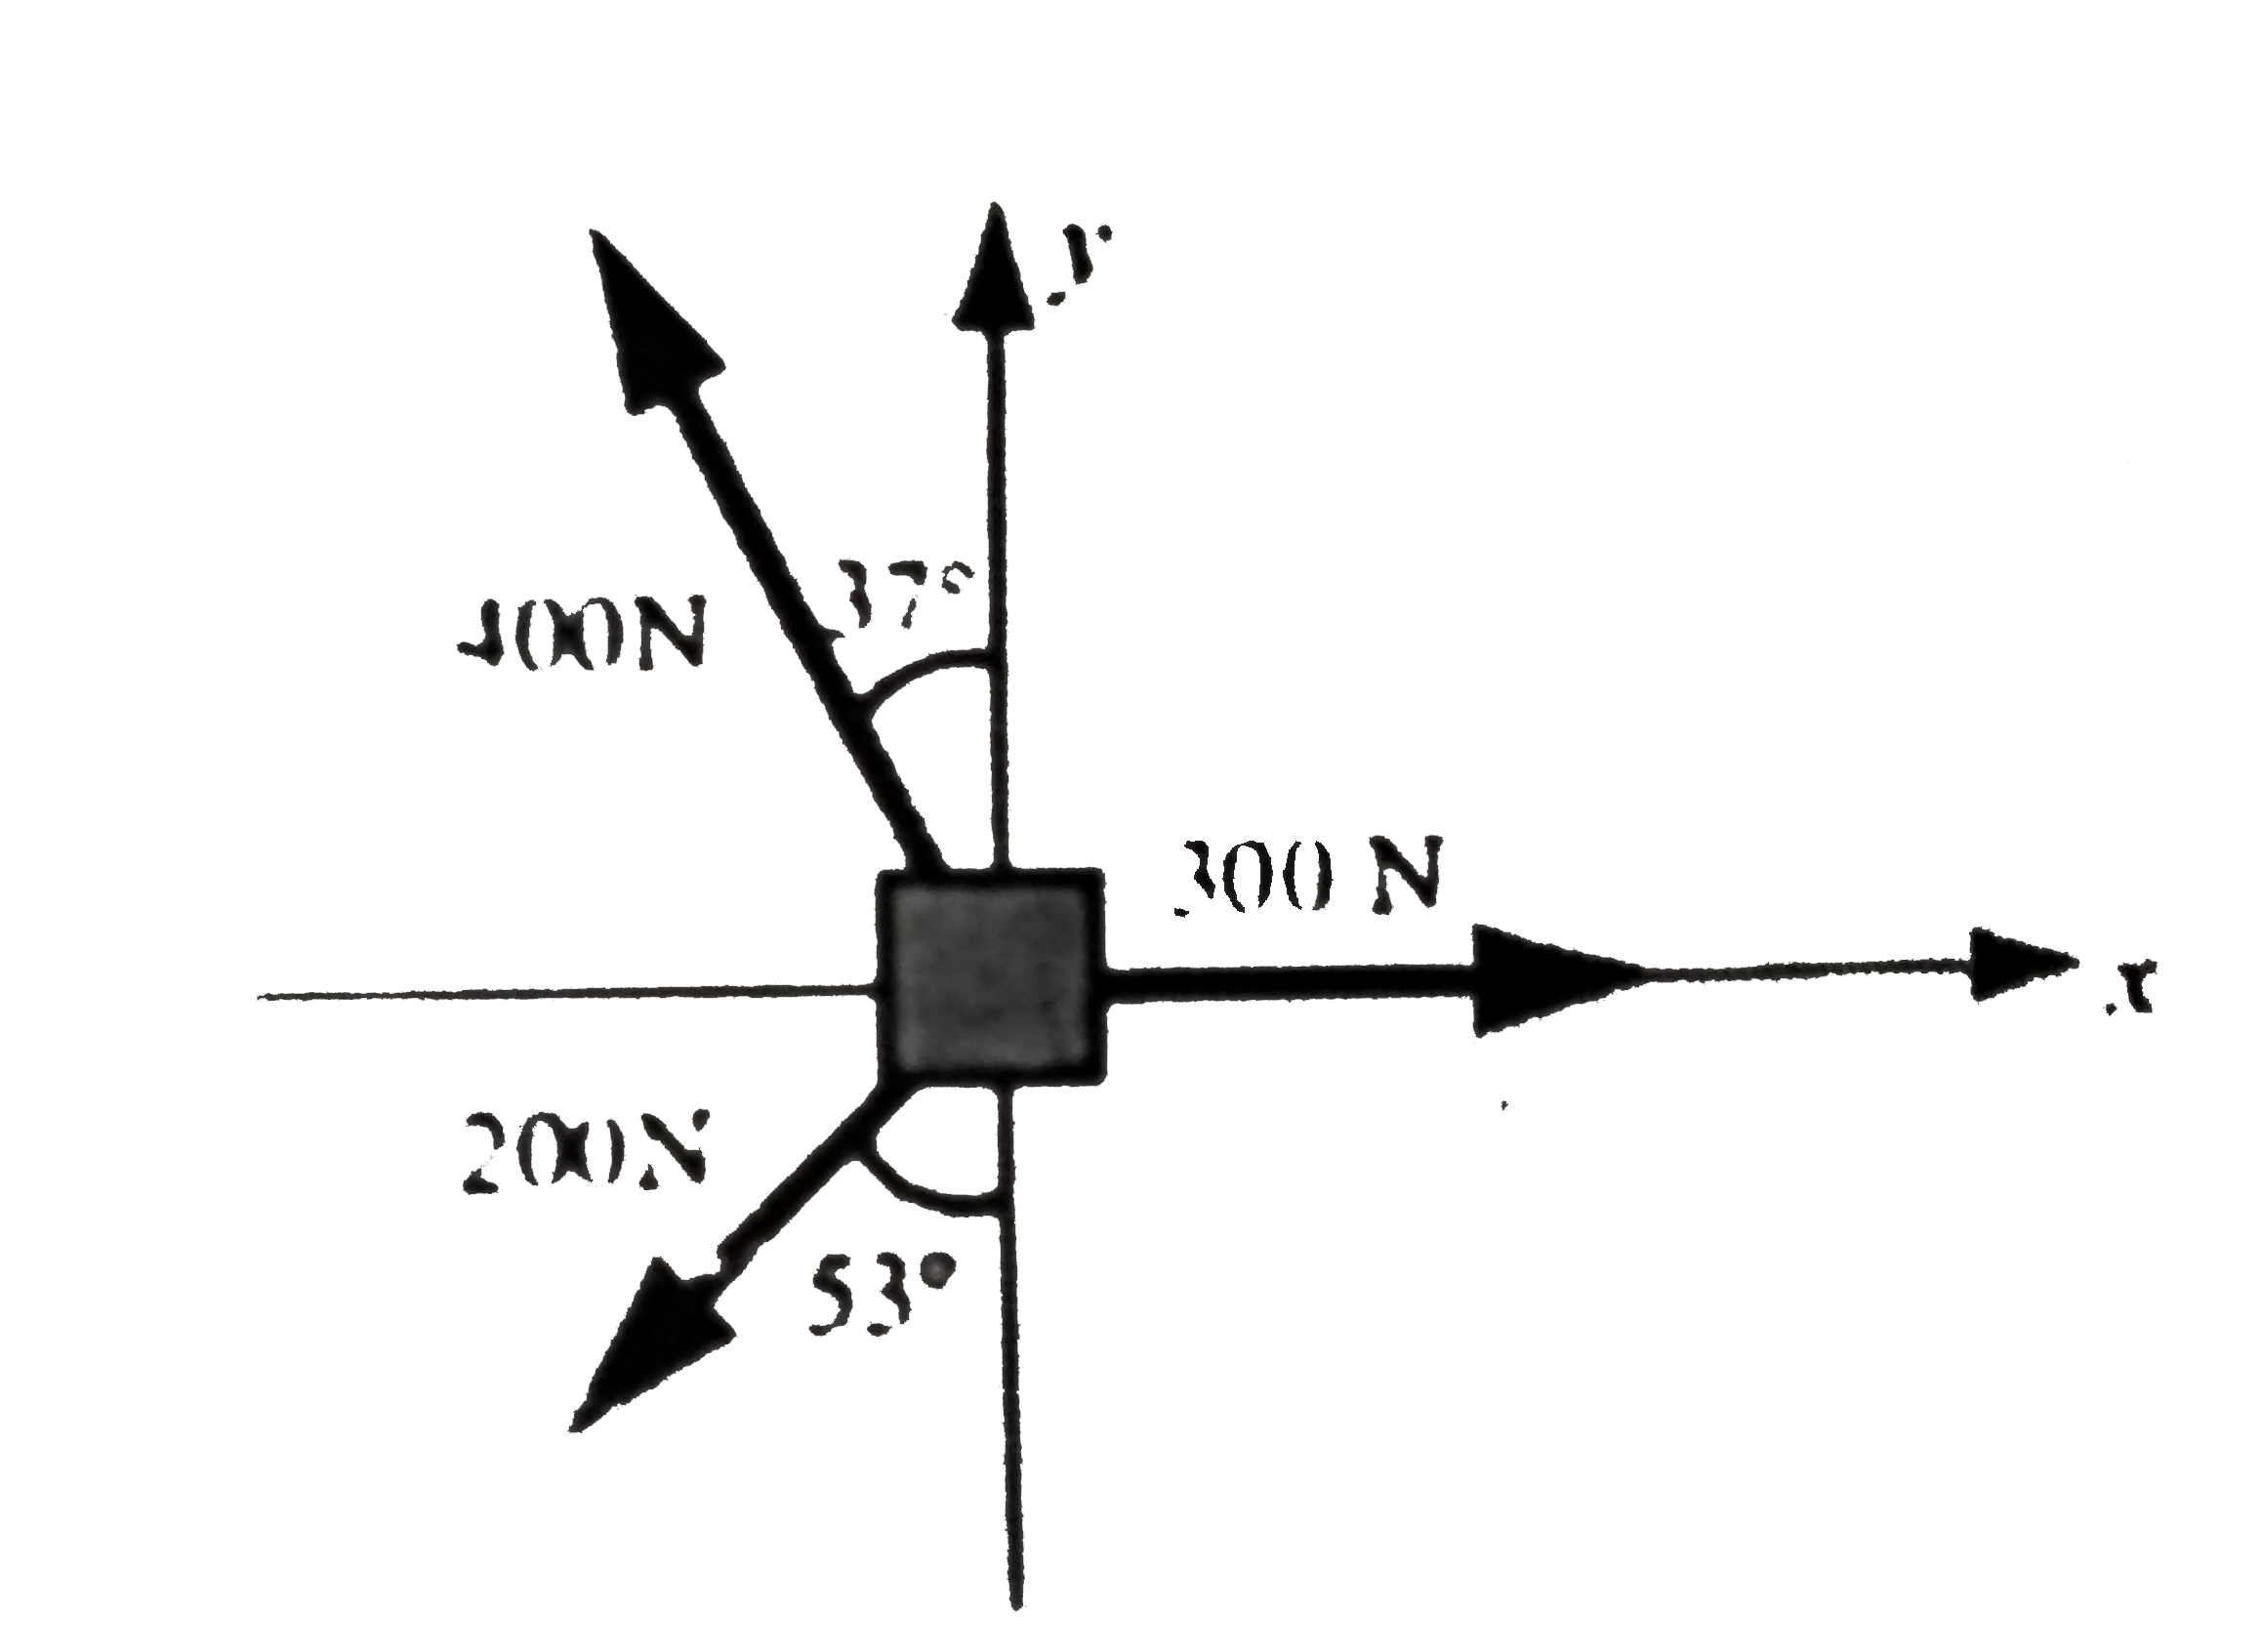
View SolutionA block is placed on a rough horizontal plane. Three horizontalforces are applied on the block as shown in the figure. If the block is in equilibrium, find the friction force acting on the block.
View SolutionA uniform sphere is place on a smooth horizontal surface and as horizontal force F is appied on it at a distance h above the surface. The acceleratioin of the centre
View SolutionA block of mass m is placed on a rough horizontal floor and it is pulled by a ideal string by a constant force F as shown. As the block moves towards right the friction force on block
View SolutionA block is sliding on a rough horizontal surface. If the contact force on the block is √2 times the frictional force, the coefficient of friction is
View Solution

