Draw a curve showing density or pressure variations with respect to distance for a disturbance produced by sound. Mark the position of compression and rarefaction on this curve. Also define wavelengths and time period using this curve.
To solve the question, we will follow these steps:
Step 1: Understanding the Concept of Sound Waves
Sound waves are longitudinal waves that consist of compressions and rarefactions. In a compression, particles are close together, resulting in high pressure and density, while in a rarefaction, particles are spread apart, leading to low pressure and density.
Step 2: Drawing the Curve
1. Draw the X and Y Axes: Start by drawing a horizontal line for the distance (X-axis) and a vertical line for density or pressure (Y-axis).
2. Plotting the Waveform: The curve will resemble a sine wave.
- The peaks of the wave represent compressions (high density).
- The troughs of the wave represent rarefactions (low density).
3. Labeling the Curve:
- Mark the points where the curve reaches its maximum (peaks) as "Compression."
- Mark the points where the curve reaches its minimum (troughs) as "Rarefaction."
Step 3: Defining Wavelength
- Wavelength (λ): The wavelength is defined as the distance between two consecutive compressions or two consecutive rarefactions. On the curve, measure the distance from one peak (compression) to the next peak (compression) or from one trough (rarefaction) to the next trough (rarefaction).
Step 4: Defining Time Period
- Time Period (T): The time period is defined as the time taken to complete one full oscillation of the wave. This can be observed as the time taken for a particle to move from one compression to the next compression or from one rarefaction to the next rarefaction.
Final Representation
- Your final graph should clearly show the sine wave with marked compressions and rarefactions, along with labeled wavelengths and time periods.
Sound waves are longitudinal waves that consist of compressions and rarefactions. In a compression, particles are close together, resulting in high pressure and density, while in a rarefaction, particles are spread apart, leading to low pressure and density.
1. Draw the X and Y Axes: Start by drawing a horizontal line for the distance (X-axis) and a vertical line for density or pressure (Y-axis).
2. Plotting the Waveform: The curve will resemble a sine wave.
- The peaks of the wave represent compressions (high density).
- The troughs of the wave represent rarefactions (low density).
3. Labeling the Curve:
- Mark the points where the curve reaches its maximum (peaks) as "Compression."
- Mark the points where the curve reaches its minimum (troughs) as "Rarefaction."
- Wavelength (λ): The wavelength is defined as the distance between two consecutive compressions or two consecutive rarefactions. On the curve, measure the distance from one peak (compression) to the next peak (compression) or from one trough (rarefaction) to the next trough (rarefaction).
- Time Period (T): The time period is defined as the time taken to complete one full oscillation of the wave. This can be observed as the time taken for a particle to move from one compression to the next compression or from one rarefaction to the next rarefaction.
- Your final graph should clearly show the sine wave with marked compressions and rarefactions, along with labeled wavelengths and time periods.
Topper's Solved these Questions
- SOUNDBOOK - NCERT EXEMPLAR ENGLISHCHAPTER - SOUNDEXERCISE - Short Answer Type Questions
8 Videos
- MOTIONBOOK - NCERT EXEMPLAR ENGLISHCHAPTER - MOTIONEXERCISE - Long Answer Type Questions
6 Videos
- WORK AND ENERGYBOOK - NCERT EXEMPLAR ENGLISHCHAPTER - WORK AND ENERGYEXERCISE - LONG ANSWER TYPE QUESTIONS
8 Videos
Similar Questions
Knowledge Check
Given below are four curves describing variation of velocity with time of a particle. Which one of these describe the motion of a particle initially in positive direction with constant negative acceleration?
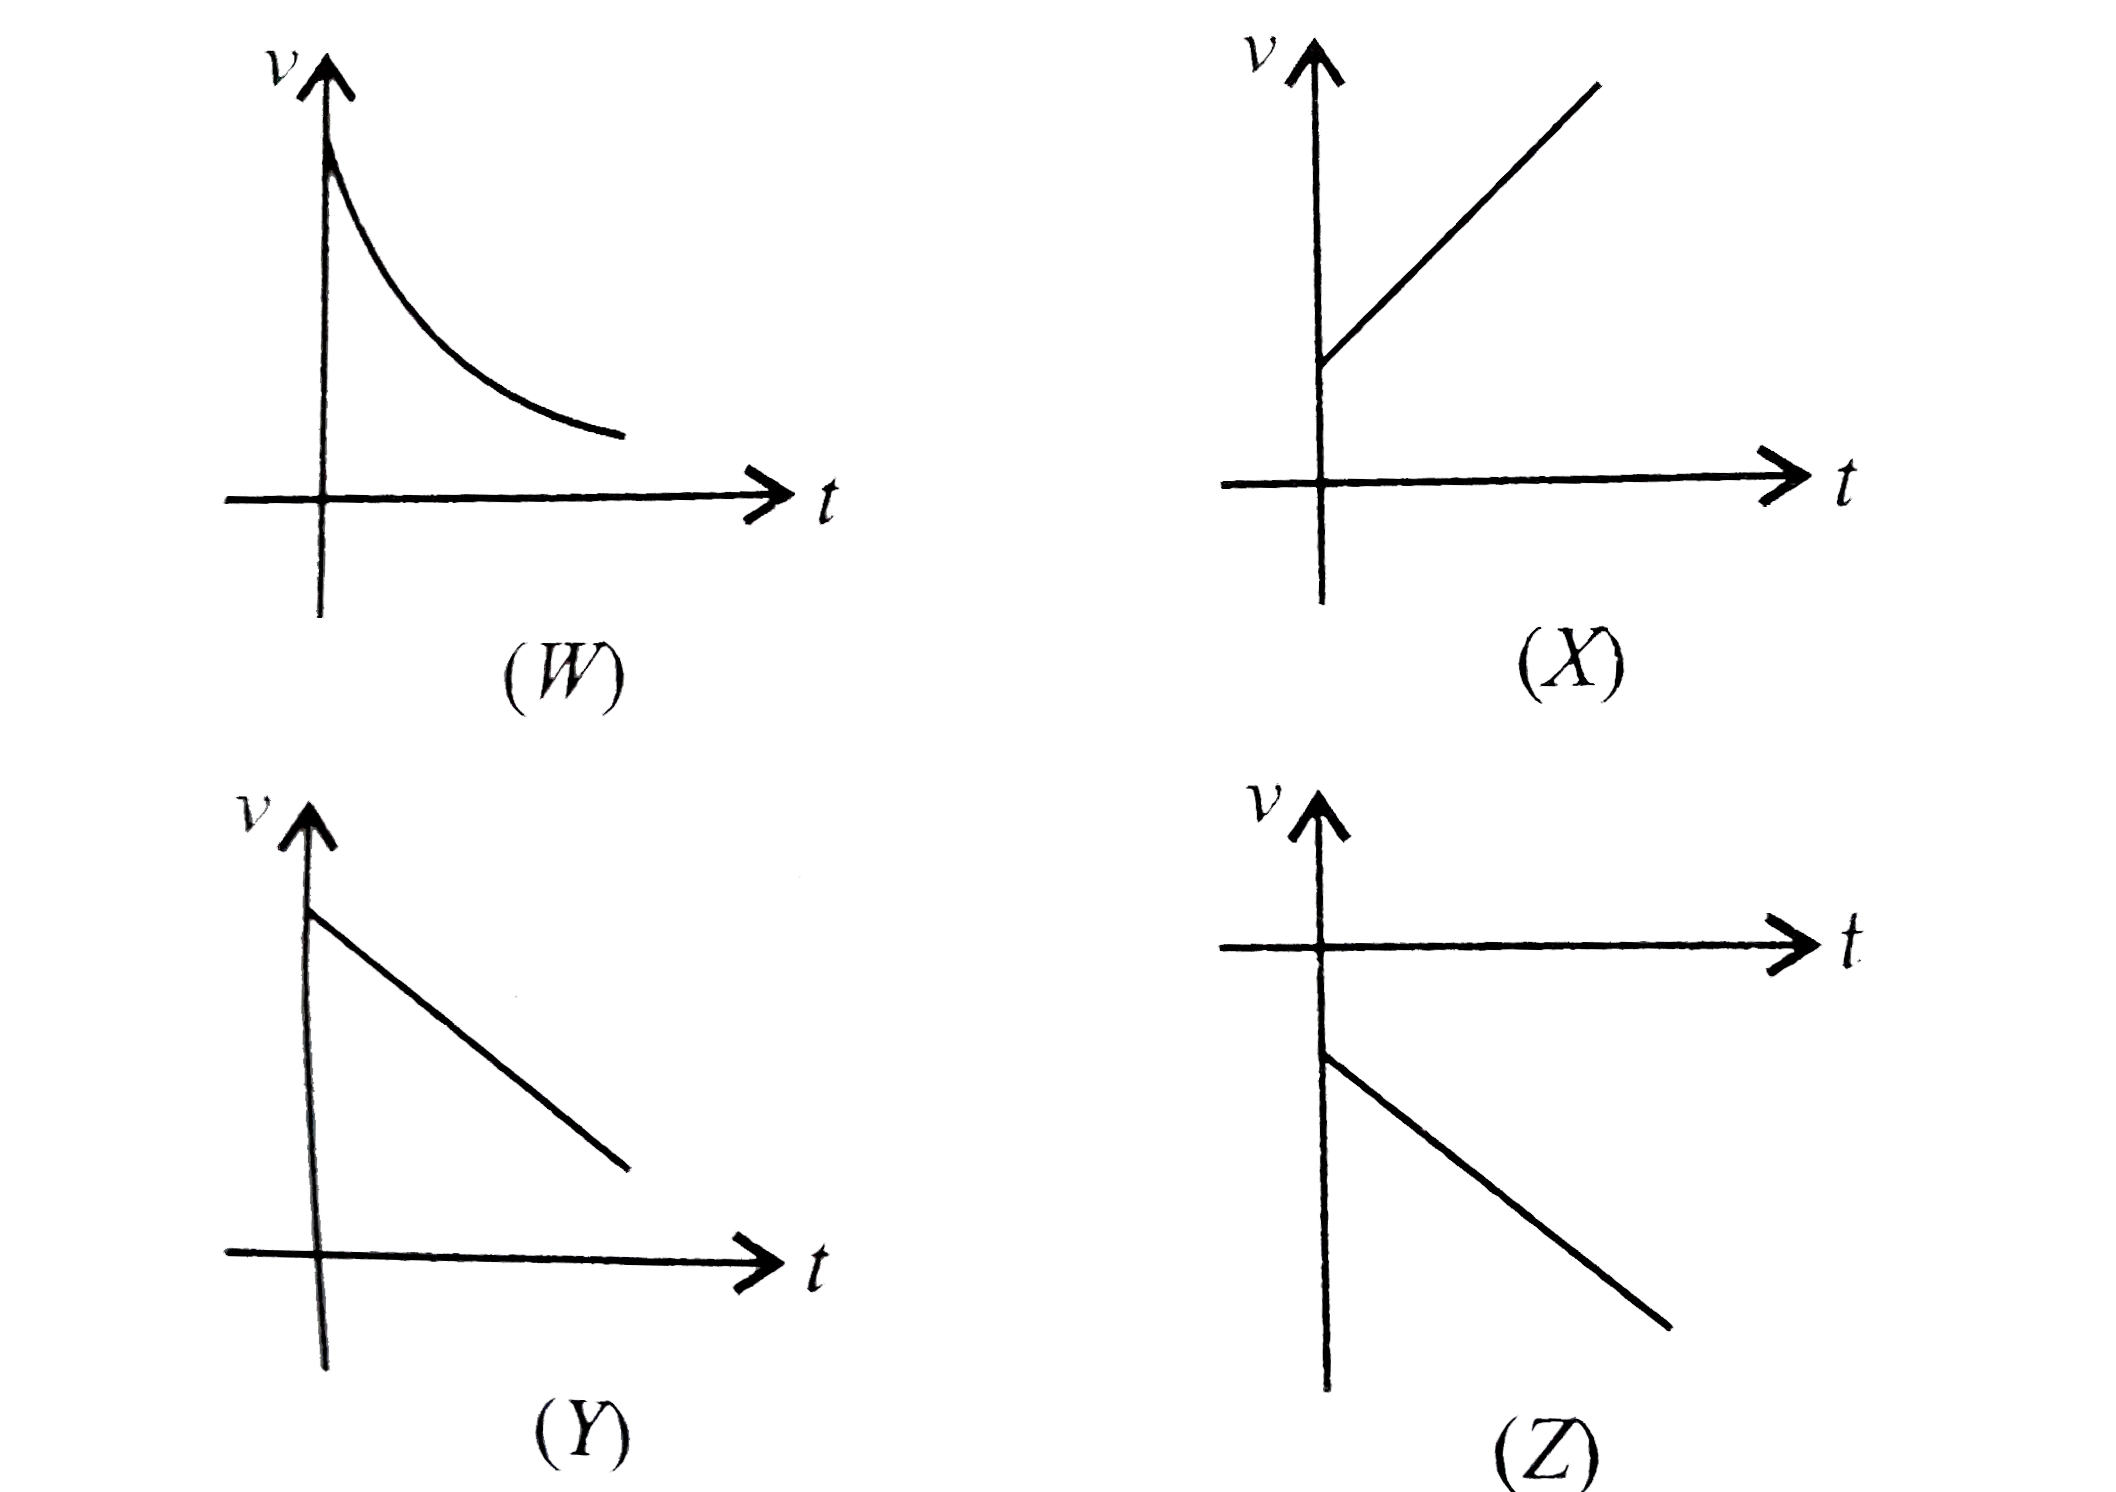 A(W)B(X)C(Y)D(Z)
Following curve shows the variation of intesity of gravitational field (→I) with distance from the centre of solid sphere(r) :
View Solution(a) How does the angle of deviation produced by a prism change with increase in the angle of incidence. Draw a curve showing the variation in the angle of deviation with the angle of incidence at a prism surface.
(b) Using the curve in part (a) above, how do you infer that for a given prism, the angle of minimum deviation δmin is unique for a given light.
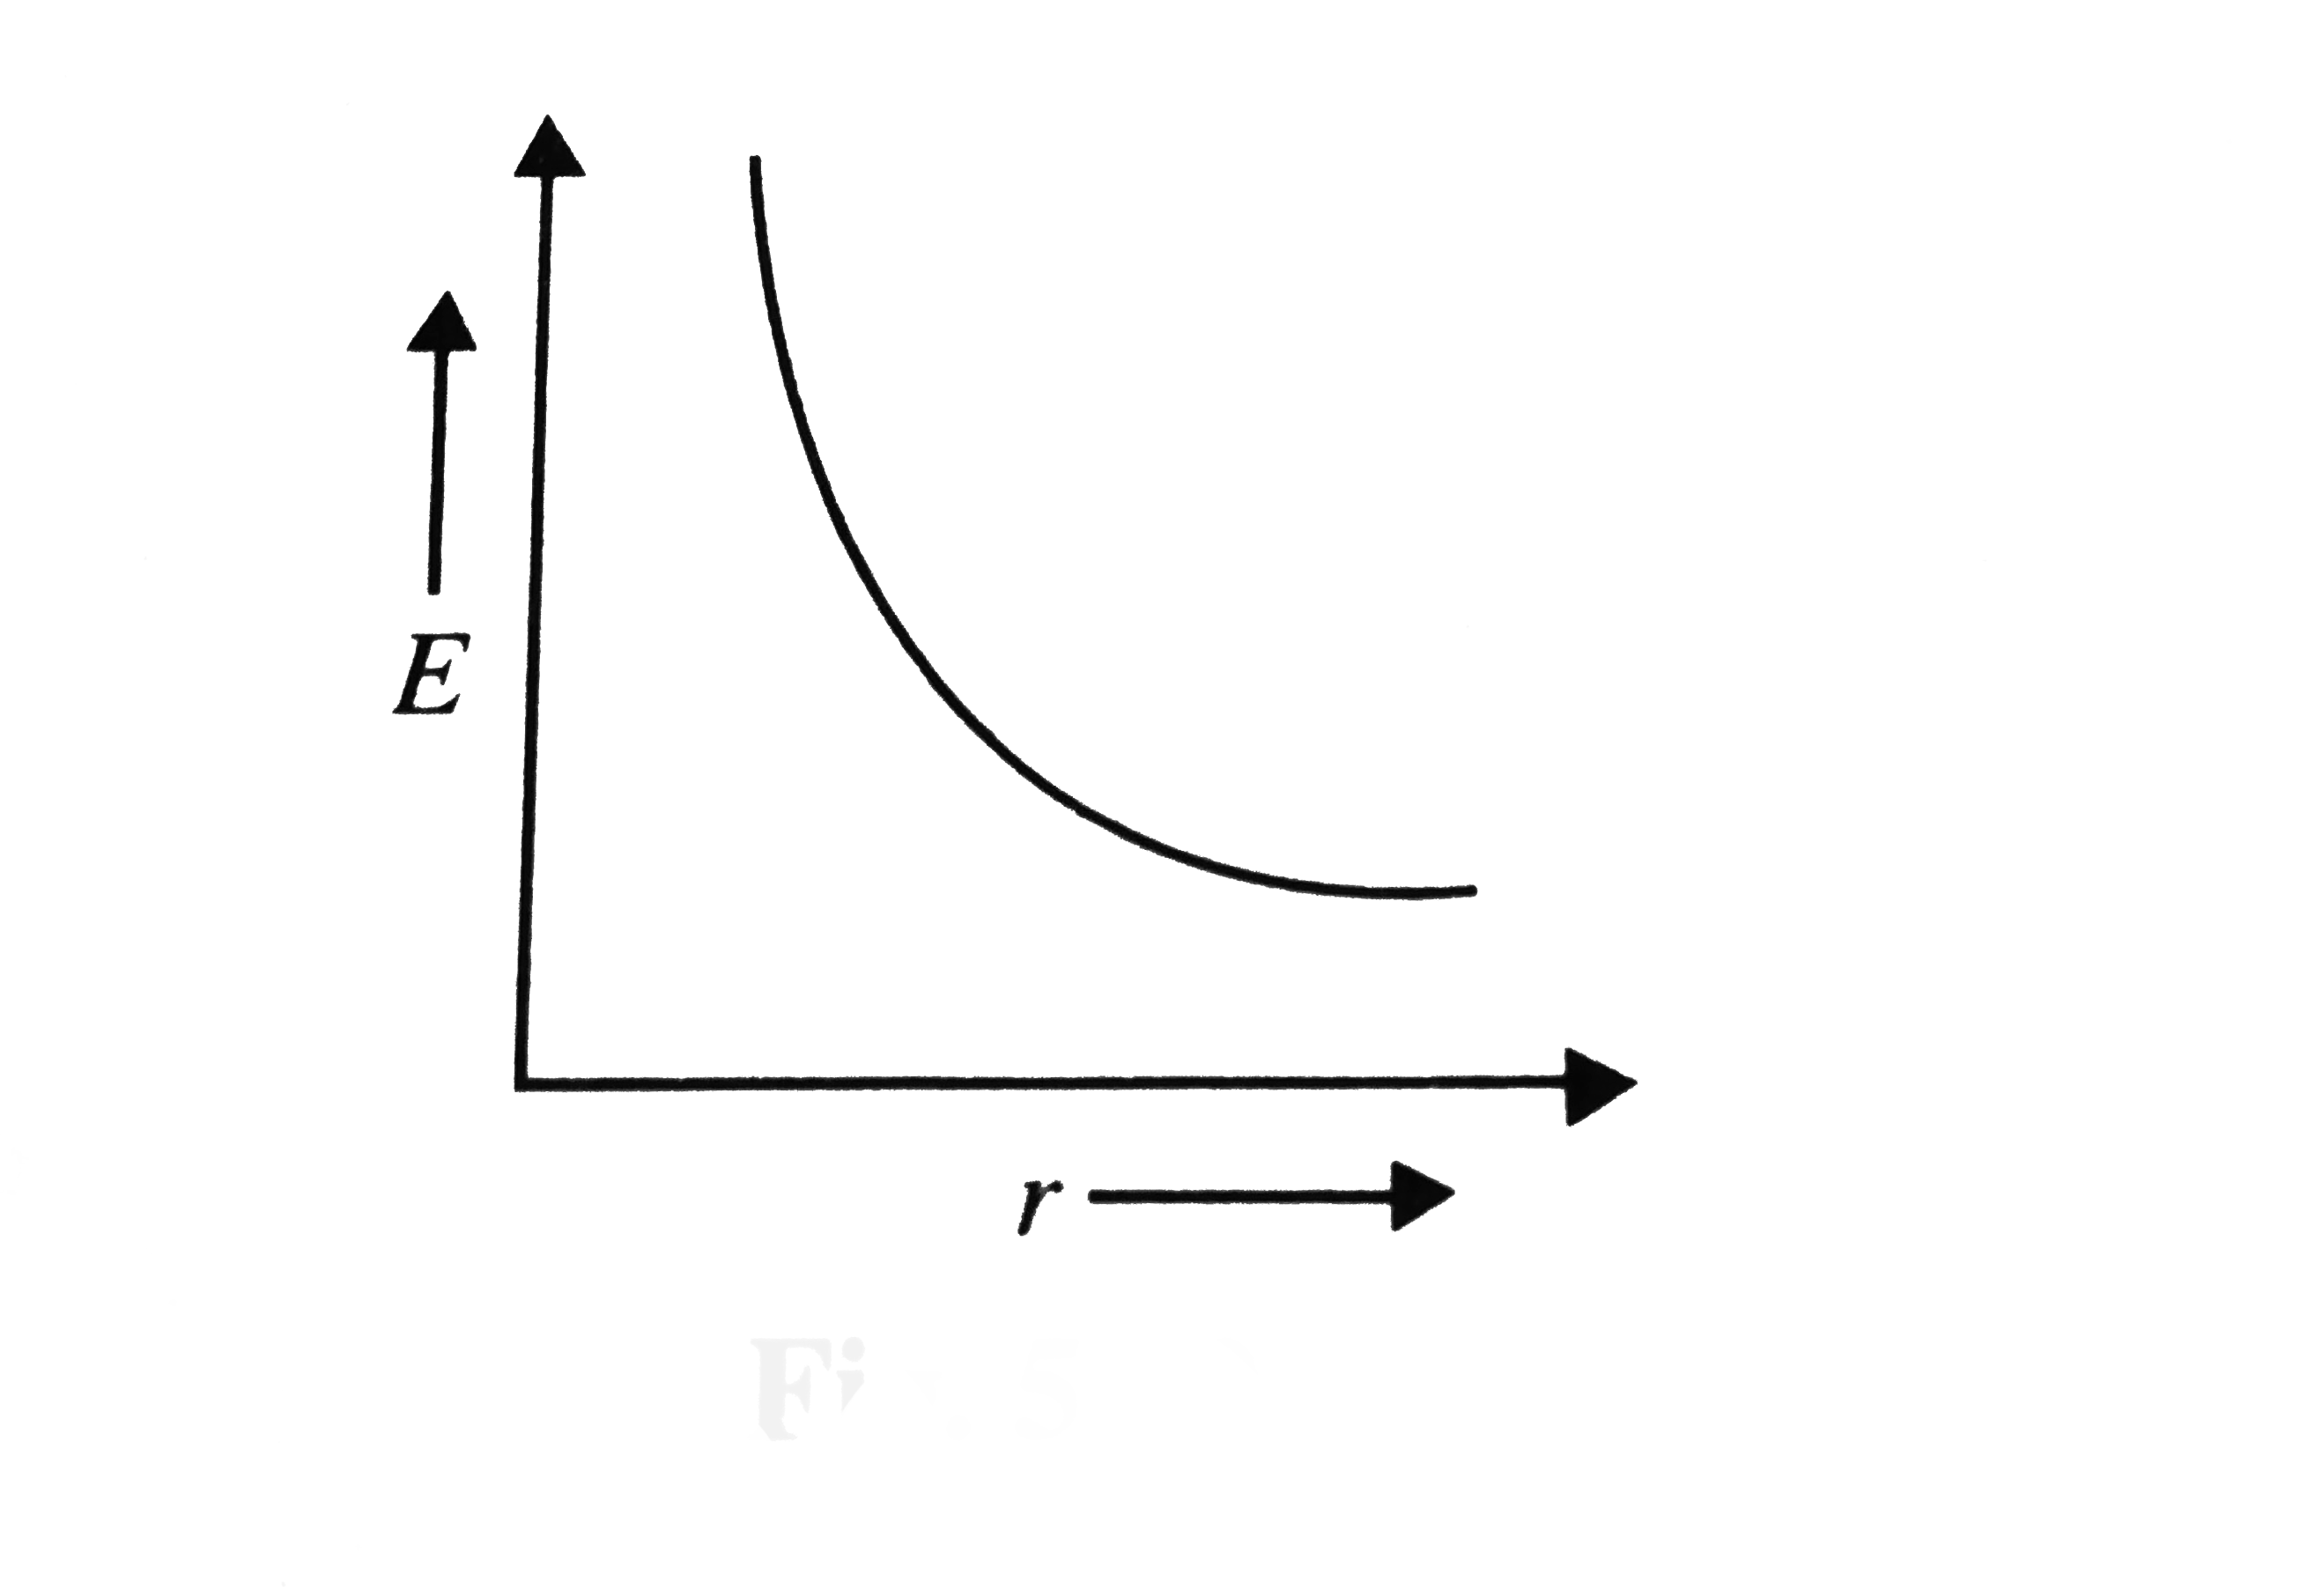
View SolutionEnergy density E (energy per unit volume ) of the medium ar a distance r from a sound source varies acording to the curve shown in figure. Which of the following are possible?
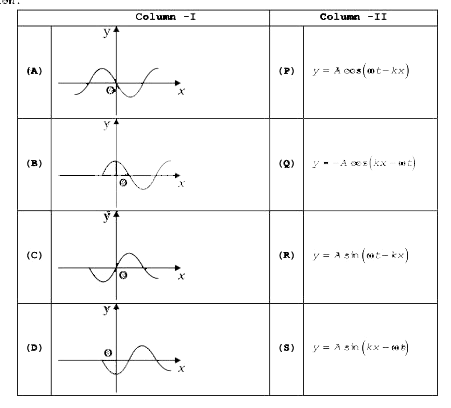
View SolutionFor four sine waves, moving on a string along positive x-direction, displacement distance curves (y-x curves) as shown at time t=0. in this right column, expression for y as function of distance x and time t for sinusoidal waves are given. All terms in the equation have their usual meanings. Correctly match y-x curves with corresponding equation.
View SolutionFrom amongst the following curves, which one shows the variation of the velocity v with time t for a small sized spherical body falling vertically in a long column of a viscous liquid
View SolutionSketch shows the plot of Z v/s P for a hypothetical gas for one mole at three distint temperature.
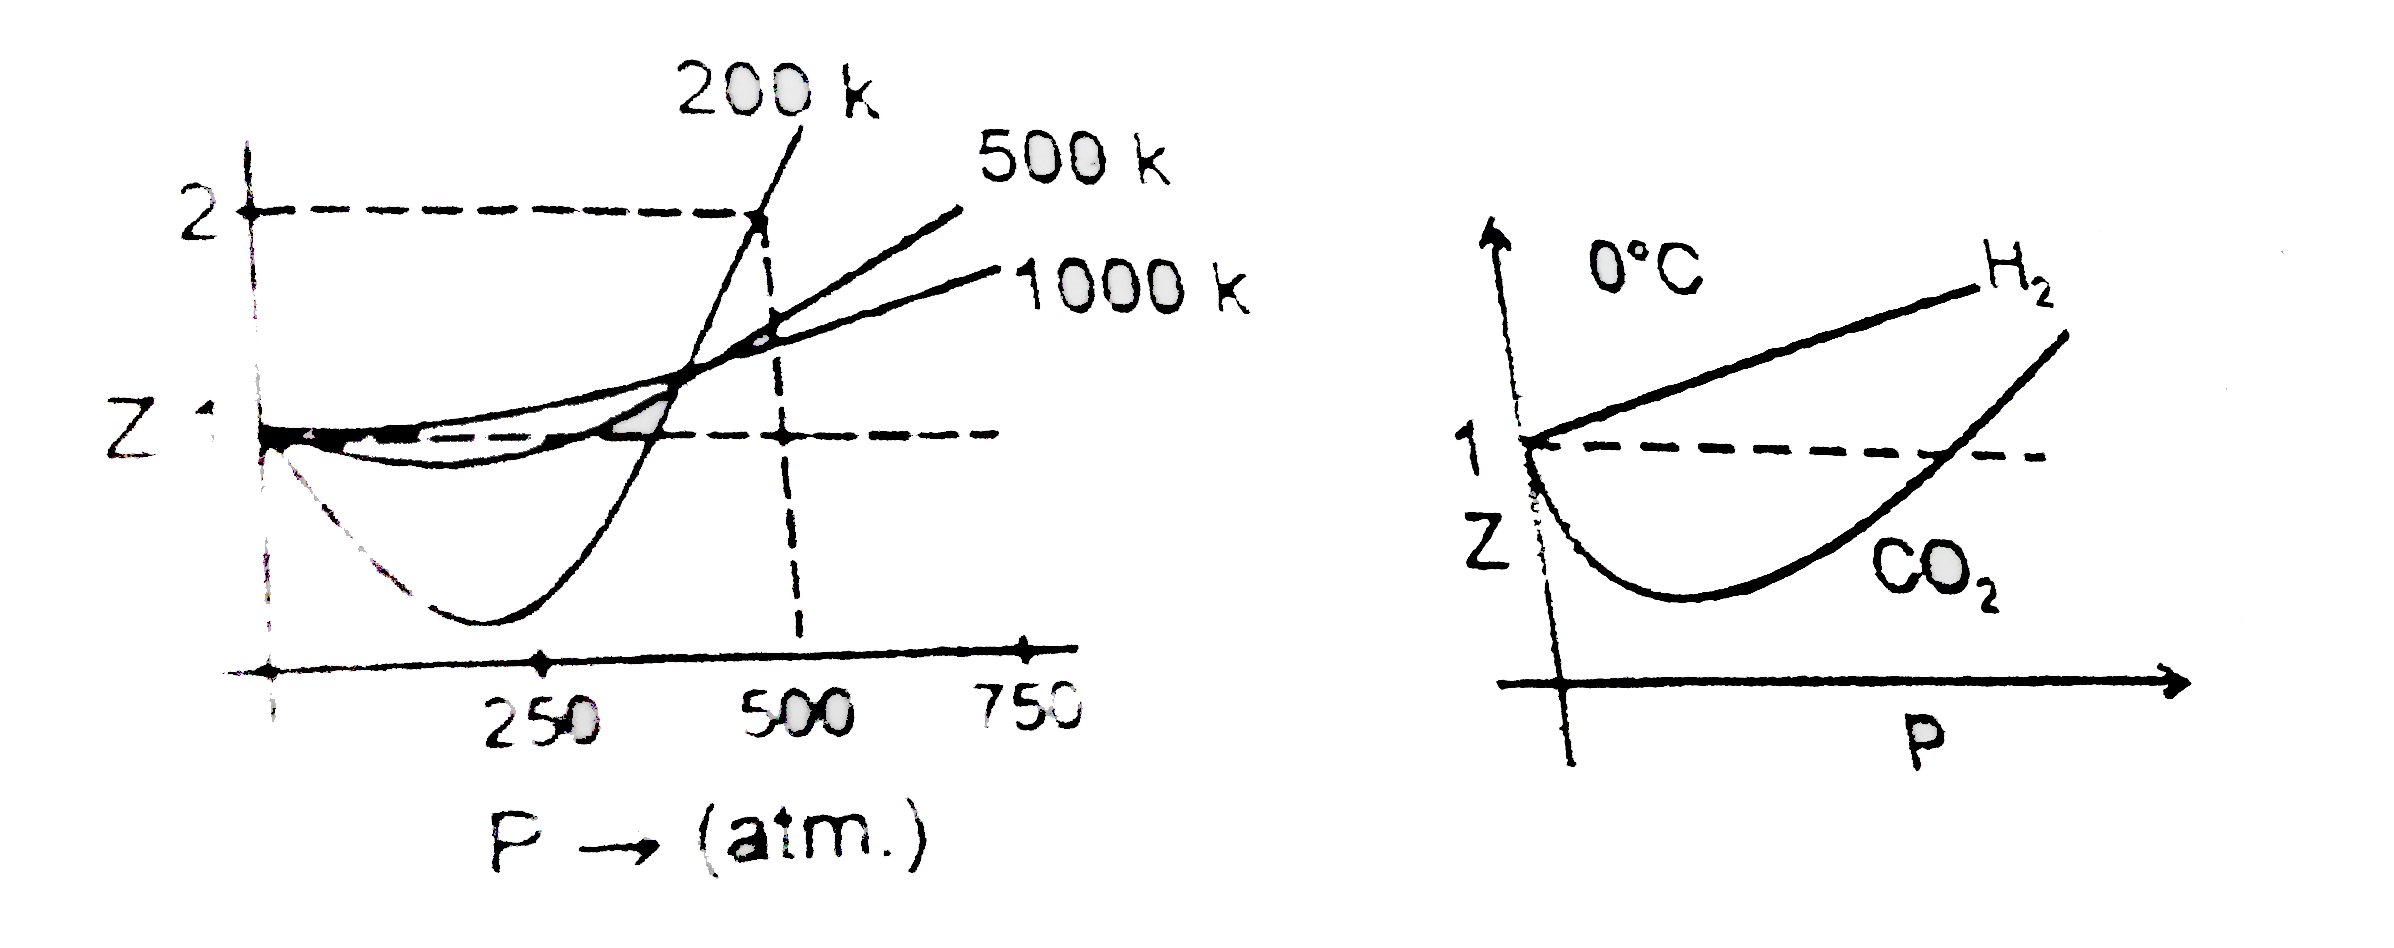
Boyle's temperature is the temperature at which gas shows ideal behaviour over a pressure range in the low pressure region.Boyle's temperature (Tb)=aRb.If a plot is obtained at temperature well below Boyle's temperature then the curve will show negative deviation, in low pressure region and positive deviation in the high pressure region. Near critical temperature the curve is more likely as CO2 and the temperature well above critical temperature curve is more like H2 at 0∘C as shown above.At high pressure suppose all the constant temperature curve varies linearly with pressure according to the following equation : Z=1+PbRT (R=2calmol−1K−1)
Which of the following is correct :
View SolutionSketch shows the plot of Z v/s P for a hypothetical gas for one mole at three distint temperature.
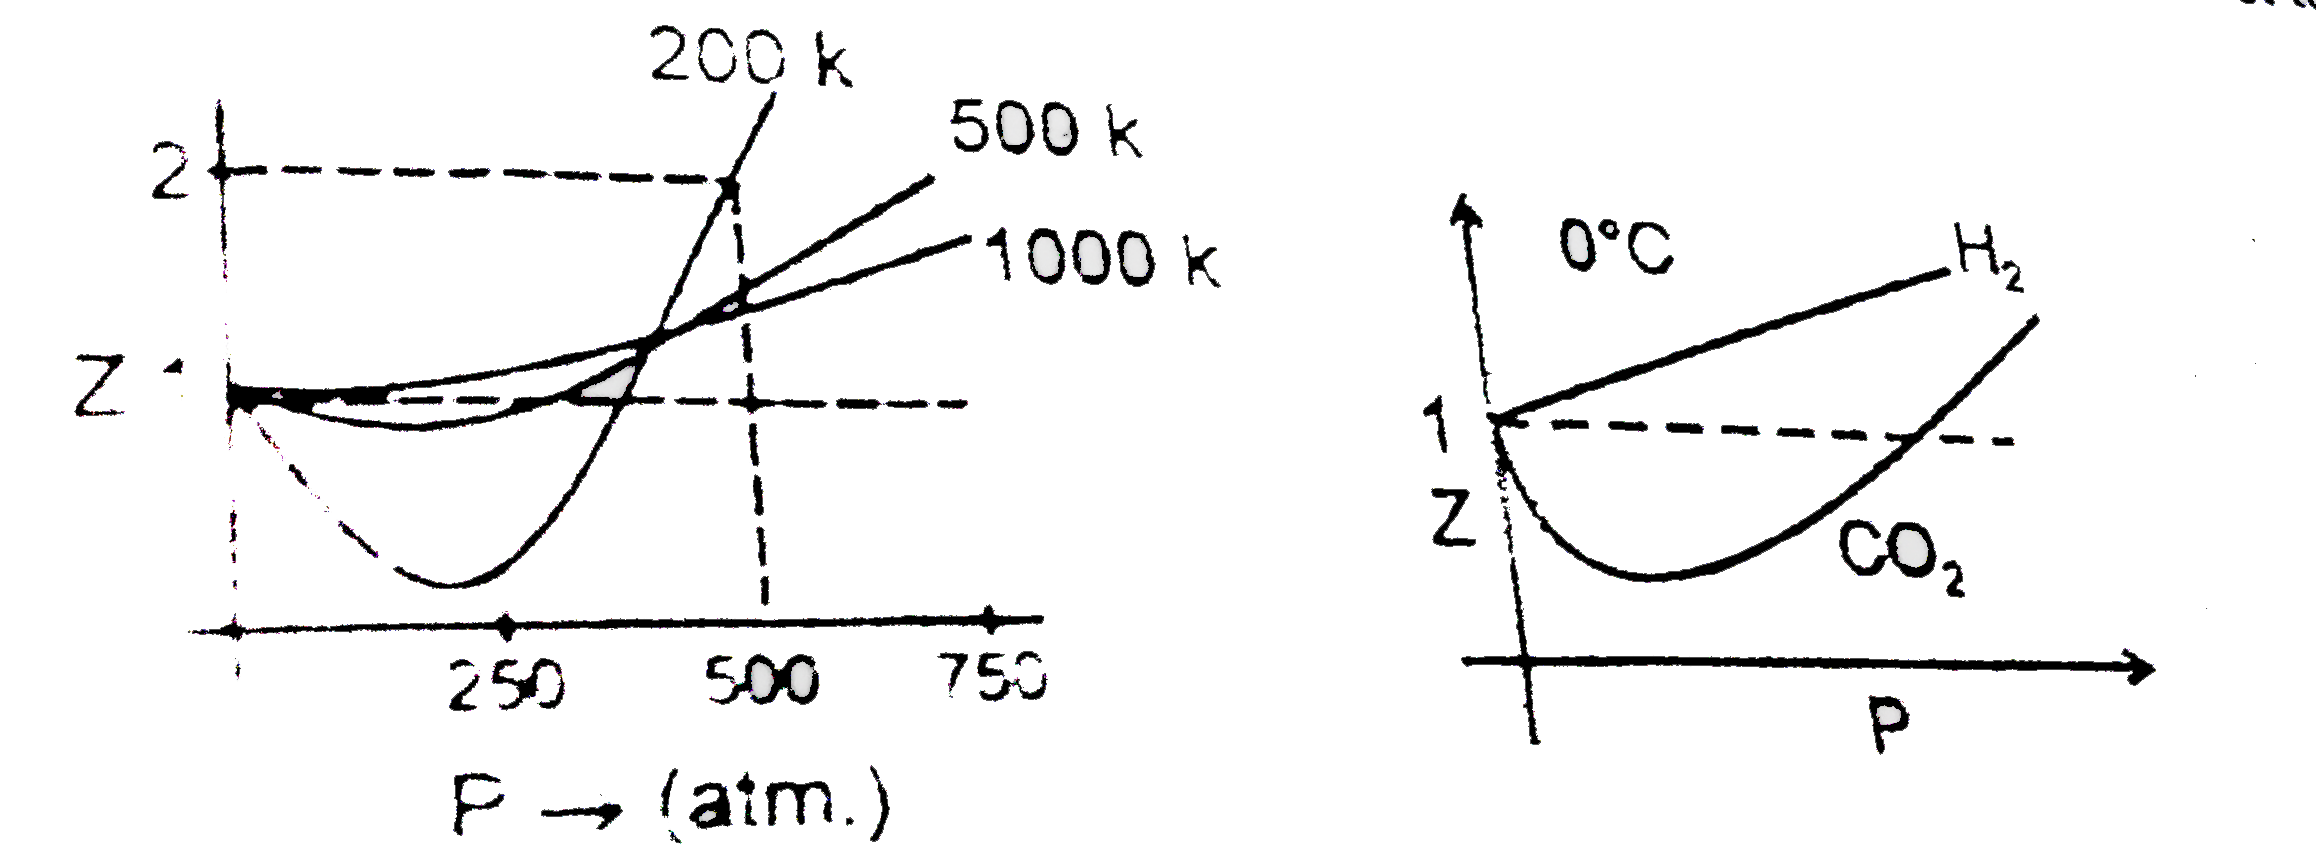
Boyle's temperature is the temperature at which gas shows ideal behaviour over a pressure range in the low pressure region.Boyle's temperature (Tb)=aRb.If a plot is obtained at temperature well below Boyle's temperature then the curve will show negative deviation, in low pressure region and positive deviation in the high pressure region. Near critical temperature the curve is more likely as CO2 and the temperature well above critical temperature curve is more like H2 at 0∘C as shown above.At high pressure suppose all the constant temperature curve varies linearly with pressure according to the following equation : Z=1+PbRT (R=2calmol−1K−1)
For 500 K plot value of Z changes from 2 to 2.2 if pressure is varied from 1000 atm to 1200 atm (high pressure ) then the value of bRT will be
View Solution

