As F shown in diagram increases from zero the graph between friction and F will be
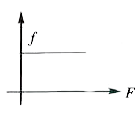
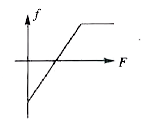
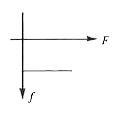
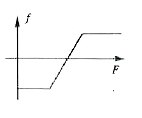
The correct Answer is:D
Topper's Solved these Questions
- BOOK - AAKASH SERIESCHAPTER - FRICTION EXERCISE - ADDITIONAL PRACTICE EXERCISE (LELVL-II) (LECTURE SHEET (ADVANCED)) (MORE THAN ONE CORRECT ANSWER TYPE QUESTIONS)2videos
FRICTION
- BOOK - AAKASH SERIESCHAPTER - FRICTION EXERCISE - ADDITIONAL PRACTICE EXERCISE (LELVL-II) (LECTURE SHEET (ADVANCED)) (LINKED COMPREHENSION TYPE QUESTIONS)2videos
FRICTION
- BOOK - AAKASH SERIESCHAPTER - FRICTION EXERCISE - PRACTICE SHEET EXERCISE-IV)(LEVEL-II) (INTEGER TYPE QUESTIONS)4videos
FRICTION
- BOOK - AAKASH SERIESCHAPTER - FLUID MECHANICSEXERCISE - Questions for Descriptive Answers14videos
FLUID MECHANICS
- BOOK - AAKASH SERIESCHAPTER - GAUSS.S LAW EXERCISE - PROBLEMS (LEVEL - II)12videos
GAUSS.S LAW
Similar Questions
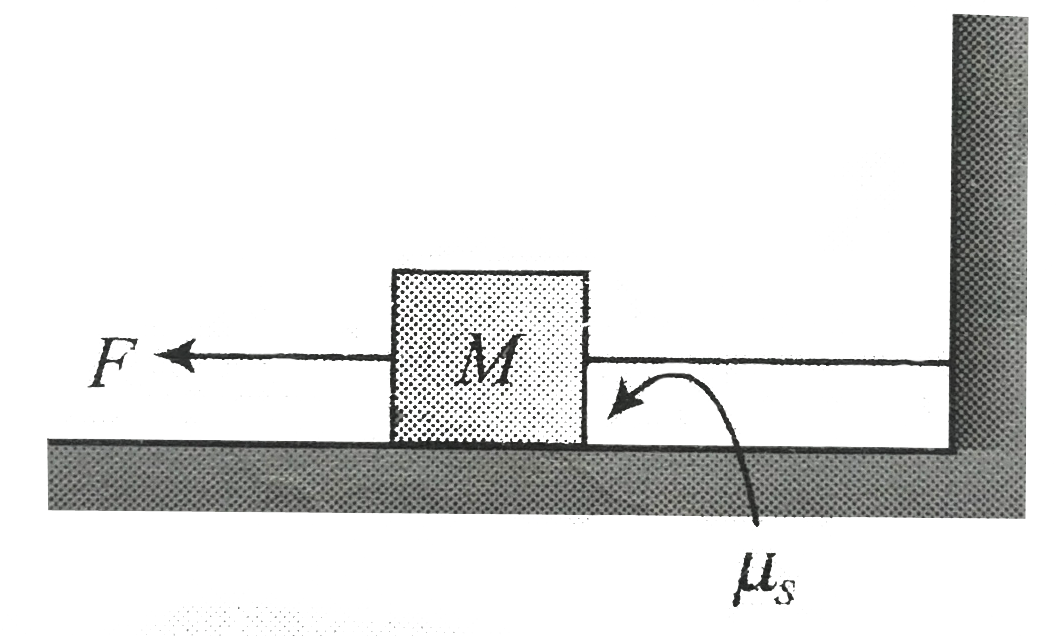
In Fig force F is gradually increased from zero Draw the graph between applied force F and tension T is the string . The coefficient of string friction between the block and the ground is μs
 View Solution
In Fig force F is gradually increased from zero Draw the graph between applied force F and tension T is the string . The coefficient of string friction between the block and the ground is μs
 View Solution
Knowledge Check
- Question 1 - Select One
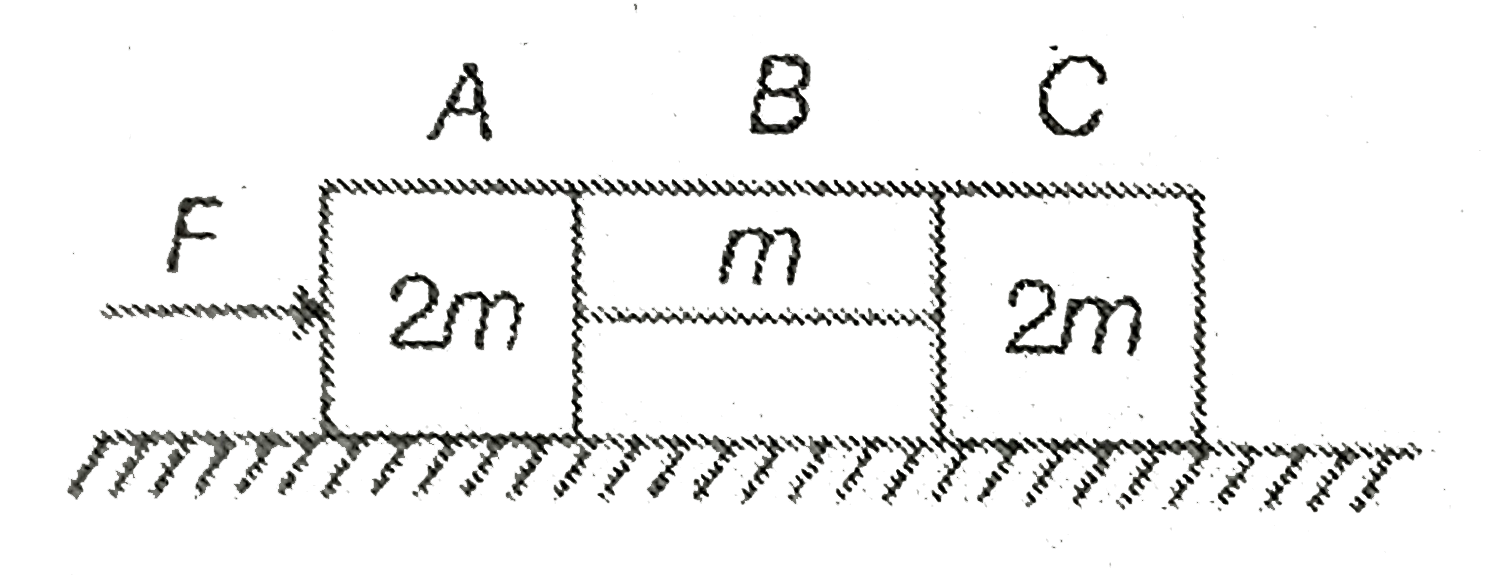
The system is pushed by a force F as shown in figure All surface are smooth except between B and C friction coefficient between B and C is Minimum value of F to prevent block B from down ward slipping is
 A(32μ)mgB(52μ)mgC(52)μmgD(32)μmg
 - Question 2 - Select One
The system is pushed by a force F as shown in figure. All surfaces are smooth except between B and C Friction coefficient between B and C is μ. Minimum value of F to prevent blokc B from downward slipping is
 A(32μ)mgB(52μ)mgC(52)μngD(32)μmg
 - Question 3 - Select One
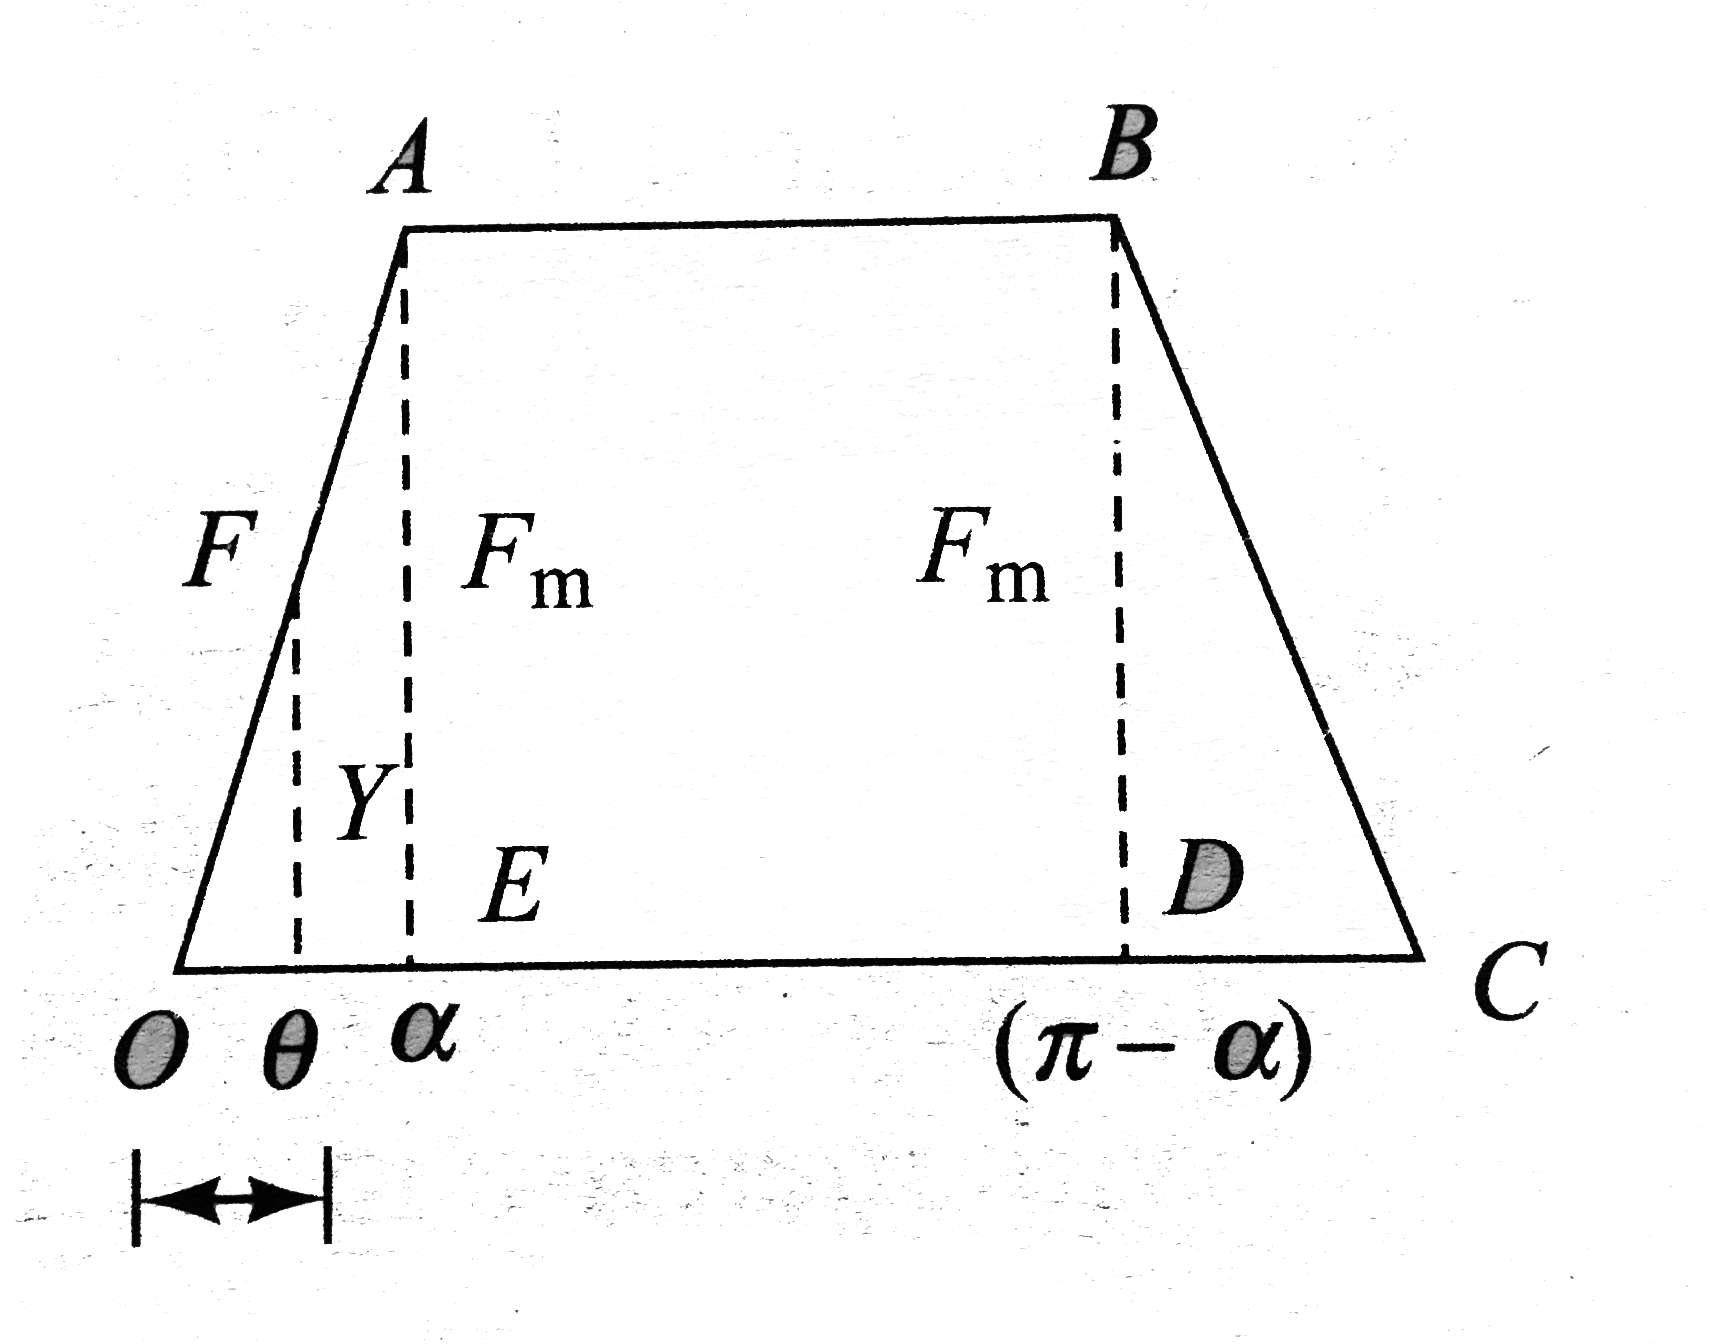
The half cycle of an alternating singnal is shown in fig. It increases uniformly form zero at 0∘→Fmat(α)∘ and decrease uniformly from (Fm)at180∘
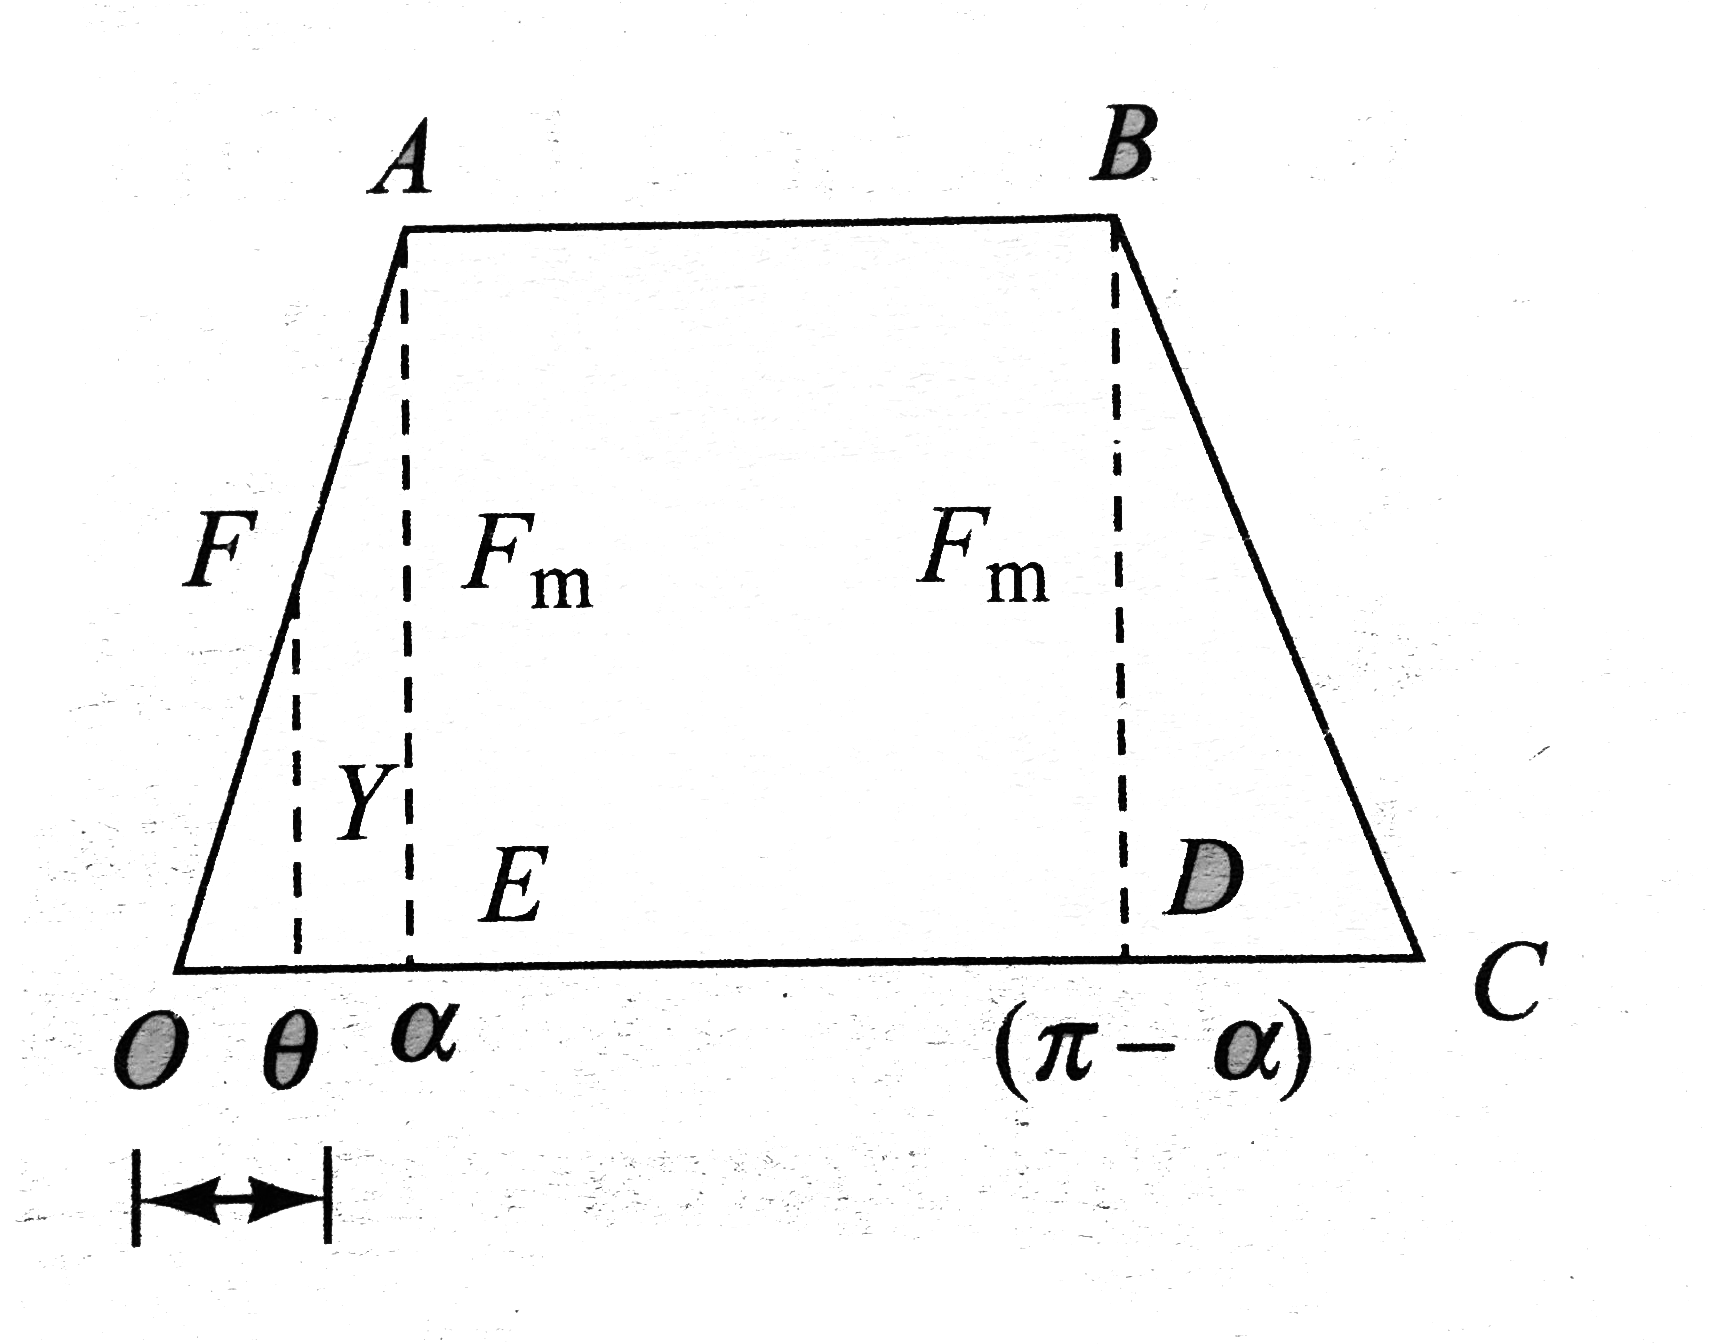
The effective value of the singnal isAFm√(1−4α3π)BFm√(1+4α3π)CFm√(1−3α4π)DFm√(1+3α4π)
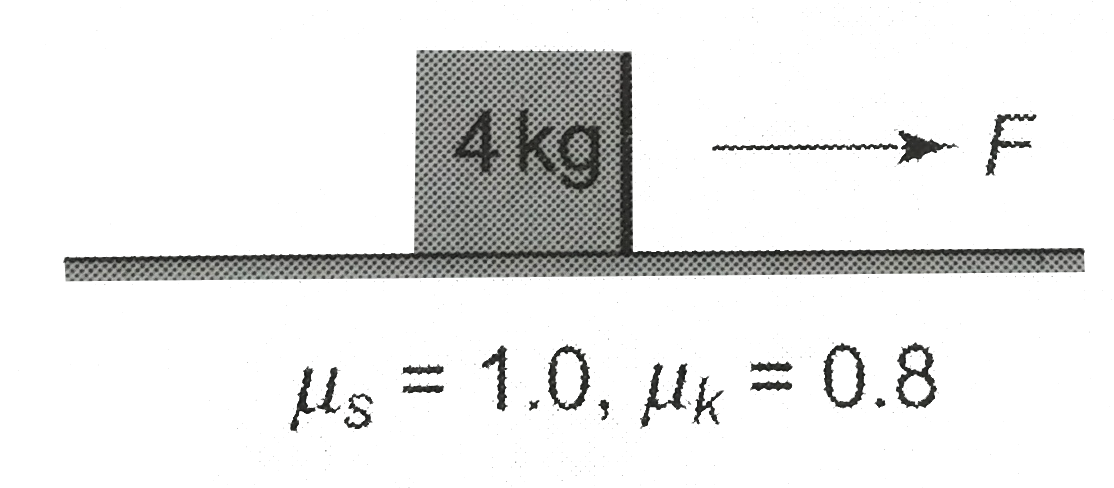
If force F is gradually increased from zero to 50N , tehn (a) find the minimum contact force, (b) find the maximum value of angle of friction when F=30N , (d) find the angle of friction when the block is moving with constant velocity and ( e) sketch a graph between friction and applied force.
 View Solution
The half cycle of an alternating singnal is shown in fig. It increases uniformly form zero at 0∘→Fmat(α)∘ and decrease uniformly from (Fm)at180∘

The effective value of the singnal isView SolutionThe half cycle of an alternating singnal is shown in fig. It increases uniformly form zero at 0∘→Fmat(α)∘ and decrease uniformly from (Fm)at180∘
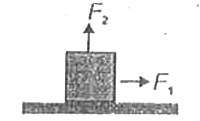
The average value of the singnal isView SolutionIn the figure shown, horizontal force F1 is applied on a block but the block does not slide. Then as the magnitude of vertical force F2 is increased from zero the block begins to slide, the correct statement is
 View Solution
The half cycle of an alternating singnal is shown in fig. It increases uniformly form zero at 0∘→Fmat(α)∘ and decrease uniformly from (Fm)at180∘

The average value of the singnal isView Solution

