Explain effect of frequency of incident radiation in th experiment of photoelectric effect.Solution in Gujrati
Figure shows graph of variation of frequency of incident radiation at constant intensity in the experiment of photoelectric effect.

For different frequency of incident radiation stopping potential value obtained is different but saturation current is same.
For frequency V3>V2>V1,then stopping potential obtained also will be V03>V02>V01.
From this it can be said that when frequency of incident radiation is more then its energy of phtoelectron emitted will depend on enrgy (frequency) of incident radiation.
When energy of photoelectron is more then more disaccelerating voltage (stopping potential) is required to stop them.
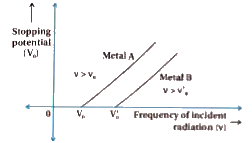
For different metals if graph of frequency of incident radiation and corresponding stopping potential is drawn then it will be a straight line as shown in figure.

Graph shows that:
(i)For given photosensitive surface ,stopping potential varies linearly with frequency .
(ii)For given minimum cut-off frequency V0 stopping potential will be zero.
The above observatio suggest that:
(i)Maximum kinetic energy of photoelectron varies linearly with frequency.But it does not depend on intensity.
(ii)When frequency of incident radiation is less than cut-off frequency V0 the photoelectric emission will not take place for any large value of intensity.
Topper's Solved these Questions
- DUAL NATURE OF RADIATION AND MATTERBOOK - KUMAR PRAKASHANCHAPTER - DUAL NATURE OF RADIATION AND MATTEREXERCISE - Section-A Try yourself
62 Videos
- DUAL NATURE OF RADIATION AND MATTERBOOK - KUMAR PRAKASHANCHAPTER - DUAL NATURE OF RADIATION AND MATTEREXERCISE - Section-A Example
2 Videos
- CURRENT ELECTRICITYBOOK - KUMAR PRAKASHANCHAPTER - CURRENT ELECTRICITYEXERCISE - SECTION [D] MULTIPLE CHOICE QUESTIONS (MCQs) (MCQs ASKED IN BOARD EXAM AND GUJCET)
23 Videos
- ELECTRIC CHARGES AND FIELDS BOOK - KUMAR PRAKASHANCHAPTER - ELECTRIC CHARGES AND FIELDS EXERCISE - SECTION D MCQS ASKED IN COMPETITIVE EXAMES (MCQS AKSED IN BOARD EXAM AND GUJCET)
14 Videos
Similar Questions
Who obtained electromagnetic wave first time in the laboratory ?
View SolutionFor electron moving with speed of 20 m/s and accelerated by 120 V p.D. de-Broglie wavelength can be easily obtained.
View SolutionA wire is bent in the form of circle of radius 2m. Resistance per unit length of wire is 1πΩm. Battery of 6 V is connected between A and B ∠AOB=90∘ . Find the current through the battery.

View SolutionWhen air is replaced by dielectric medium of constant K, the maximum force of attraction between two charges separated by distance d, ..........
View SolutionWhat is the effect of decrease in frequency of incident radiation on the stopping potential in photoelectric emission?
View SolutionIn the photoelectric effect experiment, if f is the frequency of radiation incident on the metal surface and I is the intensity of the intensity radiations, then match the following columns:
View SolutionDescribe an experiment to study the effect of frequency of incident radiation on 'stopping potential ' .
View SolutionIn photoelectric effect the slope of stop of stopping potential versus frequency of incident light for a given surface will be
View SolutionDraw and explain the graph showing the variation of stopping potential with frequency of incident radiation in relation to photoelectric effect.
View SolutionExplain photoelectric effect Explain the effect of increase of intensity of incident radiations on photoelectrons emitted by a photo-tube.
View SolutionExplain effect of variation of intensity of incident radiation on photoelectric current.
View SolutionExplain effect of potential on photoelectric current in experiment of photoelectric effect.
View SolutionHow frequency of incident radiation is changed in experiment of photoelectric effect?
View SolutionHow intensity of incident radiation is changed in experiment of photoelectric effect?
View SolutionExplain the effect of increase of intensity of incident radiation on photoelectric current with suitable graphs.
View Solution
