Draw resistivity → temperature (ρ→T) graph for metals , alloys and semiconductor. Solution in Gujrati
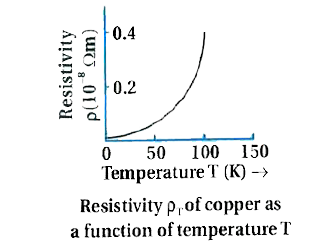
⇒ (a) For metals relation between resistivity and temperature is given by, ρT=ρ0[1+α(T−T0)] hence, relation between ρT and T will be straight line.
⇒ At temperature much lower than 0∘ C the graph will be different than straight line and will be as shown in figure below

⇒ At room temperature graph is a straight line.
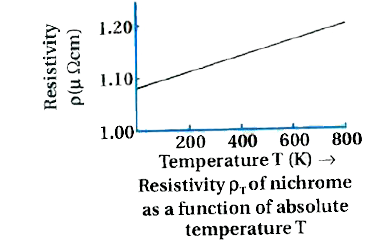
(b) Nichrome (alloy of nickel, iron, chromium) bas large resistivity and has weak dependence of resistivity with temperature.

⇒ Manganin and constantan have similar properties (to resistivity less dependent on temperature) hence they are used in making standard (reference) wire bound resistors.
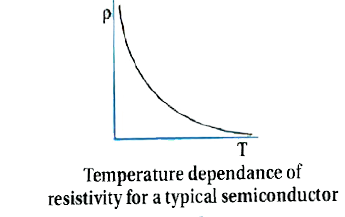
⇒ (c) Resistivity of semi conductor decreases with increase in temperature. For semiconductors ρ→T graph will be as shown below.

Topper's Solved these Questions
- CURRENT ELECTRICITYBook:KUMAR PRAKASHANChapter:CURRENT ELECTRICITYExercise:SECTION [A] TRY YOURSELF
Explore 74 Videos
- CURRENT ELECTRICITYBook:KUMAR PRAKASHANChapter:CURRENT ELECTRICITYExercise:SECTION [B] NUMERICALS (NUMERICAL FROM TEXTUAL ILLUSTRATIONS)
Explore 14 Videos
- BOARD'S QUESTION PAPER MARCH-2020 Book:KUMAR PRAKASHANChapter:BOARD'S QUESTION PAPER MARCH-2020 Exercise:PART-B SECTION -C
Explore 4 Videos
- DUAL NATURE OF RADIATION AND MATTERBook:KUMAR PRAKASHANChapter:DUAL NATURE OF RADIATION AND MATTERExercise:Section-D (MCQs asked in GUJCET/Board Exam)
Explore 1 Video
Similar Questions
What is reason behind producing electric force between two particles ?
View Solution(a) Esttimate the average drift speed of conduction electrons in a copper wite of cross-secttonal area 1.0×10⁻⁷m2 carrying a current of 1.5A. Assume the each copper atom contrbutes roughly one conduction electron. The density of copper is 9.0×10³kg/m3, and its atomic mass is 63.5u. (b) Compare the drift speed obyained above with, (1) thermal speeds of copper atoms at ordinary temperaturtes. (ii) speed of propagation of electric field along the conductor which causes the drift motion.
View SolutionDerive an expression for current I passing through an AC circuit containing only inductor L. Draw a Phasor diagram and graph of v and I versus ωt. Explain instantaneous power and the average power.
View SolutionMass of photon in motion is ………
View SolutionWhich of the following graphs represents zero order if
A→P
At t=0⇒[A]0
At t=t⇒[A]t
View SolutionThe temperature (T) dependence of resistivity (rho) of a semiconductor is represented by :
View SolutionIf the resistivity of an alloy is rho' and that of consituent metals is 'rho' then
View SolutionIF ρ is the resistivity at temperature T, then the temperature coefficient of resistivity is defined as α=1dρρdT, which is a constant physical quantity for a given metal, show that ρ=ρ0ea(T−T0), where ρ0 = resistivity at temperature T0.
View SolutionTemperature dependence of resistivity ρ(T) of semiconductors,insulators and metals is significally based on which of the following factors?
View SolutionThe resistance R of a conducting wire depends on its material , length l and area of cross section A. The resistivity of the material of the wire is rho=(RA)/t the value of rho is for different materials .It is very low for conducting materials like metals,Besides, the resistance of a conductor also depends on its temperature. IF the resistance of a conductor is R_0 at 0^@C and R_1 at t^@C , then R_1=R_0(1+at) where a is called the temperature coefficient of resistance. The resistance increases with temperature for metallic conductors but decreases for graphite,a few metal alloys,and for semiconductors like silicon and germanium. The temperature coefficient of resistance of a semiconductor is
View Solutionwhich of the following graph represents the variation of resistivity (ρ) with temperature (T) for copper?
View SolutionResistivity of metal …… and resistivity on semiconductor …… on temperature decreases
View SolutionWhen the semiconductor is heated ……..
View SolutionThe temperature (T) dependence of resistivity (rho) of a semiconductor is represented by :
View SolutionExplain the variation of resistance of a semiconductor with temperature Also draw the graph showing the variation of resistivity of silicon with temperature
View Solution

