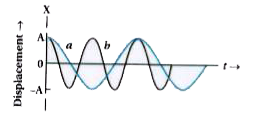
Draw plots for initial phase ϕ=0 for different periods.Solution in Gujrati
In x(t)=Asin(ωt+ϕ),ϕ=0
x(t)=Asinωt
Following graphs shows displacement versus time for different periods.

In this plot the curves (b) has half the period and twice the frequency of the curve (a).
Topper's Solved these Questions
- OSCILLATIONSBOOK - KUMAR PRAKASHANCHAPTER - OSCILLATIONSEXERCISE - SECTION-A (TRY YOURSELF)
64 Videos
- OSCILLATIONSBOOK - KUMAR PRAKASHANCHAPTER - OSCILLATIONSEXERCISE - SECTION-B (NUMERICAL FROM TEXTUAL ILLUSTRATIONS)
40 Videos
- OBJECTIVE QUESTIONS AS PER NEW PAPER STYLE BOOK - KUMAR PRAKASHANCHAPTER - OBJECTIVE QUESTIONS AS PER NEW PAPER STYLE EXERCISE - CHAPTER - 8 (Match Type questions)
5 Videos
- PHYSICAL WORLDBOOK - KUMAR PRAKASHANCHAPTER - PHYSICAL WORLDEXERCISE - SECTION-E (QUESTIONS FROM MODULE)
9 Videos
Similar Questions
What is motion ?
View SolutionOn an average, a human heart is found to beat 75 times in a minute. Calculate its frequency and period.
View SolutionType of satellites are given in Column-I and their uses are given in Column-II. Match them properly :
Column-IColumn-II(1) Polar satellite(a) Tele communication(2) Geo-stationary satellite(b) Investigation(c) For information about atmosphere
View Solution.…. state of substance at very high temperature has generated hope of energy source for mankind.
View SolutionIn a wave, the path difference corresponding to a phase difference of phi is
View SolutionTwo particle execute SHM with amplitude A and 2A and angular frequency ω and 2ω repectively. At t=0 they starts with some initial phase difference. At, t=2π3ω. They are in same phase. Their initial phase difference is-
View SolutionIn a wave, the path difference corresponding to a phase difference of phi is
View SolutionFor Question, find (i) period and (ii) initial phase
Hint : Period , T=2πω, initial phase =ϕ
Compare given euation with x=Acos(ωt+ϕ)
View Solutionएक आवर्त गति में प्रारम्भिक कला है। इसे आवर्तकाल ϕ=3π16 में व्यक्त कीजिये।
View SolutionThe value of phase at t=0 is ϕ and is called ......
View SolutionObtain the formula of intensity if the phase difference at a point from two sources is ϕ.
View SolutionThe amplitude of SHM is 5cm , period 4sec and initial phase is pi//6 . Its displacement at t=0 [initial displacement] is
View SolutionThe amplitude of SHM is 5cm , period 4sec and initial phase is π/6. Its displacement at t=0 [initial displacement] is
View SolutionThe displacement of a particle executing SHM is given by x=0.10sin(2πtT+ϕ) where all the quantities are in SI units. The time period of vibration is 3s. At t = 0, the particle is displaced by 0.05m. Find the initial phase,
View SolutionThe amplitude of SHM is 5cm, period 4sec and initial phase is pi//6 . Its displacement at t = 0 [ initial displacement] is
View Solution
